The Apgar Score and Its Components in the Preterm Infant
Thomas Hegyi, MD*; Tracy Carbone, MD*; Mujahid Anwar, MD*; Barbara Ostfeld, PhD*; Mark Hiatt, MD*; Anne Koons, MD*; Jennifer Pinto-Martin, PhD‡; and Nigel Paneth, MD, MPH§
ABSTRACT. Objective. The Apgar score is well-char-acterized in full-term infants but not in premature in-fants. The objective of this study was to assess the Apgar score in preterm infants with respect to the relationships between the 1- and 5-minute scores, the correlation of the Apgar score with pH and with other variables, and the relationship among the individual Apgar components.
Methodology. We recorded Apgar scores at 1 and 5 minutes in a population-based cohort of preterm infants (n51105) with birth weight<2000 g, from three inten-sive care nurseries in central New Jersey. Linear correla-tion analysis was used to examine the relacorrela-tionship be-tween 1- and 5-minute Apgar scores and bebe-tween the individual components of the Apgar score. Multiple re-gression analysis was used to explore the relationship between various perinatal characteristics and the Apgar score, and between pH and Apgar score. Stepwise logis-tic regression analysis was used to assess the determi-nants of mortality.
Results. The 1-minute Apgar score median (25%, 75%) was 6(4,8) and correlated with the 5-minute score of 8(7,9) atr 5.78. Slight but significant differences were seen between male (n5557) and female (n5508) infants in the 1-minute (6[4,8] and 7[4,8]) Apgar scores. One- and 5-minute scores of white infants (7[4,8] and 8[7,9]; n 5 713) were significantly higher than those of black infants (5[3,7] and 8[6,9]; n5280). Birth weight and gestational age were both linearly related to both Apgar scores. Low Apgar score (<3 at 1 minute and<6 at 5 minutes) was significantly associated with birth weight, gestational age and mode of delivery. Low arterial blood pH (<7.01) at birth was significantly related to low Apgar score. One hundred fifty-nine infants died; these infants were sig-nificantly smaller (9836382 vs 14626369 g), less mature (27 vs 31 weeks), had lower arterial blood pH (7.2060.18 vs 7.3160.11), had lower 1- (3[2,6] vs 7[4,8]) and 5-minute Apgar scores (6[4,8] vs 8[7,9]), and a greater incidence of low Apgar score (32% vs 6%) than did survivors.
Conclusions. Among the components of the Apgar score, respiratory effort, muscle tone, and reflex activity correlated well with one another; heart rate correlated less well; and color the least. Our data confirms the limited use of the Apgar score in preterm infants and demonstrates the different responses of the Apgar score’s
components.Pediatrics1998;101:77– 81;Apgar score, com-ponents, prematurity, acidosis, mortality.
ABBREVIATION. UI, unit increase.
I
n the 40 years since the Apgar score was devel-oped by Virginia Apgar1 to assess newborn in-fants, it has promoted infant evaluation immedi-ately after birth, trained students and physicians to observe several clinical signs simultaneously in mak-ing clinical decisions, and assisted in the establish-ment of standard policies for resuscitation. The Ap-gar score continues to be used as the best established index of immediate postnatal health.The description of the Apgar score and its corre-lation with other measures such as pH is based largely on data obtained from term newborns and may not apply to premature infants. In the Central New Jersey Neonatal Brain Hemorrhage Study, or-ganized to screen a cohort of premature infants for germinal matrix and intraventricular hemorrhage, we systematically collected a large number of clinical variables, including 1- and 5-minute Apgar scores.2 The data on the incidence, timing, and outcome of intraventricular hemorrhage has been previously re-ported.3,4In this article we present the results of our analysis of the Apgar score in preterm infants with respect to the relationships between the 1- and 5-minute scores, the correlation of the Apgar score with pH and with other variables, and the relation-ship among the individual Apgar components.
METHODS Study Population
Infants born in central New Jersey (Monmouth, Ocean, and Middlesex counties) between August 1984 and June 1987, and weighing 501 to 2000 g were eligible for inclusion. The 1105 study infants were born or transferred to three study hospitals with intensive care units constituted 83% of all infants in the region born during the period of study who met the birth weight criteria. Details of patient enrollment and collection of data have been reported previously.2
Apgar Score Designation
Apgar scores were provided by care providers attending the delivery of the premature infant including pediatric attendings and housestaff, neonatal fellows, and obstetrical nursing staff. Because delivery of these infants was attended by pediatric staff, most of the Apgar scores were assigned by either a pediatric attending, senior pediatric resident, or a neonatal fellow who were well-trained in assigning the Apgar score. However, in a small percentage of infants, due to unexpected delivery, Apgar score was assigned by the obstetrical nursing staff who were oriented in assessment of the infant and assigning the Apgar score. Apgar From the *Division of Neonatology, Department of Pediatrics,
UMDNJ-Robert Wood Johnson Medical School, St Peter’s Medical Center, New Brunswick, New Jersey; the ‡Department of Pediatrics and Clinical Epide-miology Unit, University of Pennsylvania, Philadelphia, Pennsylvania; and the §Program in Epidemiology and Department of Pediatrics and Human Development, College of Human Medicine, Michigan State University, East Lansing, Michigan.
Received for publication Dec 12, 1996; accepted May 15, 1997.
Reprint requests to (T.H.) St Peter’s Medical Center, 254 Easton Ave, New Brunswick, NJ 08903.
scores were assessed at the designated time intervals after delivery and recorded on standard labor and delivery forms.
Statistical Analysis
Apgar scores were expressed as median (25%–75%). Categori-cal data were analyzed using thex2test. Differences in median values were analysed using Kruskal-Wallis analysis of variance by ranks and median test. Multiple regression analysis was used to explore the relationship between various perinatal characteristics and the Apgar score, and between pH and Apgar score. Stepwise logistic regression analysis was used to assess the determinants of mortality. Significant differences were judged by aPvalue,.05.
RESULTS
In the study population, mean birth weight was 1393 6 406 g and mean gestational age 31.3 6 4.1 weeks. Complete Apgar score data were available in 1067 (96.6%) infants. One-minute Apgar score was 6(4,8) and 5-minute score was 8(7,9). The two scores correlated with each other atr5.78.
Perinatal Characteristics and Apgar Score (Table 1) The relationship between 1- and 5-minute Apgar score and the incidence of low Apgar score (,3 at 1 minute and ,6 at 5 minutes) with birth weight, gestational age, mode of delivery, sex, race, and ges-tation is shown in Table 1. Both 1- and 5-minute Apgar scores and the incidence of low Apgar score were significantly different among the birth weight groups. Significant differences for gestational age were seen between the two groups of infants ,31 weeks’ gestation and the two groups .30 weeks’ gestation. Infants born after vaginal delivery had lower 1-minute Apgar scores than those born by caesarean section. Both 1- and 5-minute Apgar scores were significantly higher in white than black infants, and the 1-minute score was higher in females.
Multiple regression analysis of determinants of the
1-minute Apgar score showed significant positive slopes for birth weight (b 5 0.391) and gestational age (b50.152). Similar prediction of birth weight (b 5 0.346) and gestational age (b 5 0.207) was also found for the 5-minute Apgar score. Stepwise regres-sion analysis showed that birth weight explained 25% of the variance in the 1-minute Apgar score and this explained variance only increased to 27% with the addition of gestational age. Similarly, for the 5-minute Apgar score birth weight accounted for 25% of the explained variance, which increased to 28% with the addition of gestational age. Odds ratio with low Apgar score for birth weight,1.5 kg was 5.0 in comparison with birth weight of 1.5 to 2 kg, and for birth weight,1.0 kg was 9.0 in comparison with birth weight of 1 to 2 kg.
Relationship of Blood pH and Apgar Score (Table 2) Measurements of cord blood arterial pH were available in 869 infants. Blood pH correlated signif-icantly with both 1- and 5-minute Apgar scores (r5
0.17 for the 1-minute andr5 0.24 for the 5-minute Apgar score). Removing color from the Apgar score did not improve the correlation coefficient with blood pH for either the 1- or 5-minute Apgar score. Low blood pH (,7.01) was significantly associated with low Apgar score (,3 at 1 minute and ,6 at 5 minutes). Complete information on all the variables included in Table 1 and cord blood pH was available on 701 infants. Multiple regression analysis for 1-minute Apgar score in this subset of 701 infants showed significant slopes for birth weight (b 5 0.357), gestational age (b50.101), mode of delivery (b5 20.01), and pH (b 5 0.169). Stepwise linear regression analysis showed that birth weight ac-counted for 18% of the variance in the 1-minute Apgar score, with the addition of cord blood pH the explained variance increased to 21% and with the addition of the other significant variables to 23%. For the 5-minute Apgar score significant slopes were seen for birth weight (b50.276), gestational age (b5 0.206), and cord blood pH (b 5 0.233). Stepwise linear regression analysis showed that birth weight again accounted for 18% of the variance in the 5-minute Apgar score; the addition of pH increased it to 24% and gestational age to 26%.
Relationship of Apgar Score to Mortality
One hundred fifty-nine infants died before day 28 of life and 946 infants survived. Nine infants died in the delivery room. Complete data on mortality, birth weight, gestational age, and 1- and 5-minute Apgar scores were available in 1009 infants of whom 134 died. Stepwise logistic regression analysis showed birth weight accounted for 16% of the variance in TABLE 1. Perinatal Characteristics and Apgar Score*
1-min Apgar 5-min Apgar Low Apgar Score Birth weight
,1001 g (n5218) 3 (2,5)† 6 (4,8)† 63 (29%)† 1001–1500 g (n5368) 6 (4,7) 8 (7,8) 21 (6%)
.1500g (n5476) 7 (6,8) 9 (8,9) 16 (3%) Gestational age
,27 weeks (n5154) 3 (1,5)† 6 (4,8)† 45 (29%)† 27–30 weeks (n5329) 5 (4,7) 7 (6,8) 32 (10%) 31–34 weeks (n5410) 7 (5,8) 8 (8,9) 17 (4%)
.34 weeks (n5137) 8 (5,8) 9 (8,9) 3 (2%) Mode of delivery
Vaginal (n5432) 7 (4,8)† 8 (7,9) 50 (12%)† Cesarean section
(n5520)
6 (4,8) 8 (7,9) 38 (7%)
Sex
Males (n5557) 6 (4,8)† 8 (7,9) 54 (10%) Females (n5508) 7 (4,8) 8 (7,9) 46 (9%) Race
mortality, which increased to 20% with the addition of low Apgar score. Gestational age had little inde-pendent effect on mortality. In a subset of 795 infants with blood pH data available 117 died. In this subset of infants stepwise logistic regression analysis showed that the main determinant of mortality was again birth weight accounting for 14% of the variance. This explained variance in mortality increased to 19% with the addition of low cord blood pH and to 21% with the further addition of low Apgar score. Gesta-tional age had no significant effect.
Apgar Score Component Analysis (Table 3)
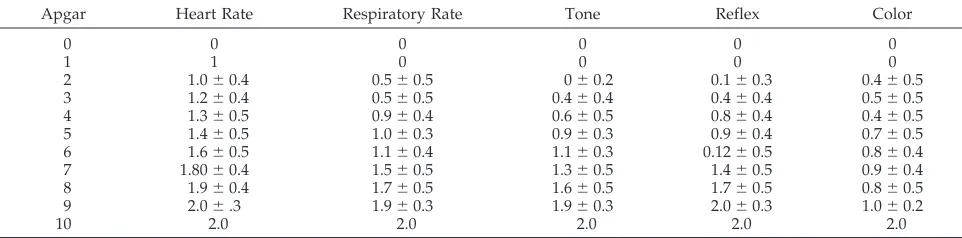
Significant (P , .01) correlations were found among components of the 1-minute Apgar score, with the strongest correlations among the triad of respiratory rate, tone, and reflex. Heart rate corre-lated somewhat less well with the other components, and color had the lowest correlation with the other components. The Figure illustrates the increasing contribution of each component to the 1-minute Ap-gar score from 0 to 10. As the 1-minute ApAp-gar score increased, the absolute value of each component in-creased. We constructed a model to compare the contribution of each component by examining a hy-pothetical rate of increase per each Apgar score be-tween 1-minute Apgars of 0 and 10. The respiratory rate, tone, and reflex components produced the larg-est increases in the total score (unit increase [UI] 5 0.20), followed by heart rate (UI5 .16), and then by
color (UI5 .14). As the Figure shows, these results reflect the large contribution of heart rate at lower Apgar scores and the smaller contribution at higher scores. It also shows that tone contributes more at higher Apgar scores compared with heart rate. Heart rate leveled close to 1 at a 1-minute Apgar score of 1 but tone reached about the same value at a 1-minute Apgar score of approximately 5. Table 4 shows the mean level of each component at each 1-minute Ap-gar score.
DISCUSSION
The Apgar score has been useful for nearly four decades, focusing on five physiological signs (heart rate, respiratory effort, reflex irritability, muscle tone, and color) to denote the condition of an infant during the first critical minutes of life. The score has been used as a predictive index for neonatal mortality and morbidity and for later neurologic or developmental disability in term infants.5
The present investigation provides Apgar score data on a large number of unselected preterm infants weighing,2000 g at birth, and examines the score and its components. The observation that females had significantly higher 1-minute scores is of statis-tical rather than clinical interest. However, it is of interest to speculate as to the etiology of this finding. Greenough and colleagues6measured catecholamine levels in cord arterial blood from preterm infants and found that females had significantly higher catechol-amine levels after asphyxia and tended also to have higher catecholamine levels without asphyxia. It is possible that this difference in pressor response con-tributes to the Apgar score differences noted.
Each component of the Apgar score, heart rate, respiratory effort, tone, reflex irritability, and color, carries the same weight in the assessment and there-fore contributes equally to the total score. However, each component has a different relationship to the total score as well as to the remaining components of the score. The most important of the signs is heart rate, which indicates life or death; failure of the heart rate to respond to resuscitation is an ominous prog-nostic sign. We found respiratory effort, tone, and reflex irritability to closely correlate and also to
Figure. Evolution of components with increasing 1-minute Apgar score.
TABLE 3. Correlation Coefficients Between the Components of the 1-Minute Apgar Score
Components of 1-Minute Score Correlation Coefficient*
Tone-reflex .72
Tone-respiratory rate .68
Respiratory rate-reflex .64
Respiratory rate-heart rate .60
Heart rate-tone .57
Heart rate-reflex .54
Color-reflex .39
Color-respiratory rate .35
Color-tone .34
Color-heart rate .31
closely correlate with the total score. These compo-nents seem to measure the neurological integrity of the infant. Finally, color correlated most poorly among the components and is likely a measure of neither life or neurological integrity. Marx and co-workers7 confirmed the lack of utility of color by showing that the exclusion of the score for color actually increased the correlation between the total score and umbilical arterial pH. Our data do not show improvement in correlation with blood pH by excluding color from the Apgar score.
In our study, the incidence of low Apgar scores was inversely related to birth weight, a finding con-firming previous observations.8,9 In a retrospective study of 641 live infants weighing ,2500 g, Laden-hoff et al9showed that the frequency of a low Apgar score was significantly correlated with the birth weight of the infant and was independent of the mode of delivery and the presentation. Caitlin and co-workers10tested the hypothesis that Apgar scores were related to the newborn infant’s level of matu-rity and showed the 1- and 5-minute Apgar scores to be directly related to gestational age. Respiratory efforts, muscle tone, and reflex were the major de-terminants of a decreasing Apgar score with declin-ing gestational age. Lan and co-workers11found that at 1 minute of life, the relative risks of low birth weight among infants with Apgar scores of 0 to 3 and 4 to 6 were 115.0 and 5.9 times higher than those of normal infants, respectively. In the very low birth weight category, the relative risks of the above score were 252.5 and 51.1, in this order. Our subjects con-sisted of infants with birth weights,2000 g. Within this weight group the odds ratio in infants with low Apgar scores to have a birth weight,1.5 kg was 5.0 and,1.0 kg was 9.0, respectively.
A number of investigators have observed a poor relationship between Apgar scores and pH measure-ments.12,13Perkins and Papile8noted correlations be-tween cord blood gases and Apgar scores to be poor, with most preterm newborns showing normal gases irrespective of Apgar scores. Similar findings were noted by Goldenberg et al14 who compared 1- and
in the presence of acidosis, a finding similar to ours. Approximately 15% of our group died before day 28 of life. Several studies have examined the relation-ship of neonatal death rate to the 1-minute Apgar score. James and co-workers15 demonstrated, in .27 000 infants, that death rate was inversely corre-lated with this score. Myers et al16 noted enhanced survival when the 1-minute Apgar score was at least 4. The importance of the 1-minute Apgar in predict-ing survival was also observed by Behnke and co-workers,17although they also emphasized the contri-bution of the 5-minute score, birth weight, and gestational age. In our data the most important de-terminant of mortality was birth weight, with addi-tional small contributions by low cord blood arterial pH and low Apgar score.
The Apgar score has been widely used to identify infants who require resuscitation at birth, to predict outcome, and to evaluate change in the condition of the newly born over the first minutes of life. Our data confirms the limited use of the Apgar score in pre-term infants. However, it remains the best tool for the identification of preterm infants in need of car-diopulmonary resuscitation. Our data show that in infants with birth weights,2000 g, low Apgar score correlates both with acidosis and mortality, but the weak correlation emphasizes the limitations of the score in predicting morbidity or immediate mortal-ity, a conclusion similar to that of Schmidt et al.18
ACKNOWLEDGMENT
Supported by a grant (RO1-NS-20713) from the National Insti-tute of Neurological Diseases and Stroke.
REFERENCES
1. Apgar V. Proposal for a new method of evaluation of the newborn infant.Anesth Anal.1952;32:260 –262
2. Pinto-Martin J, Paneth N, Witomski T, et al. The Central New Jersey Neonatal Brain Hemorrhage Study: design of the study and reliability of the ultrasound diagnosis.Paediatr Perinatol Epidemiol.1992;6:273–284 3. Paneth N, Pinto-Martin JA, Gardiner J, et al. Incidence and timing of germinal matrix/intraventricular hemorrhage in low birth weight in-fants.Am J Epidemiol.1993;137:1167–1176
4. Pinto-Martin JA, Riolo S, Cnaan A, et al. Cranial ultrasound prediction TABLE 4. Mean Component Values at Each 1-Minute Apgar
Apgar Heart Rate Respiratory Rate Tone Reflex Color
0 0 0 0 0 0
1 1 0 0 0 0
2 1.060.4 0.560.5 060.2 0.160.3 0.460.5
3 1.260.4 0.560.5 0.460.4 0.460.4 0.560.5
4 1.360.5 0.960.4 0.660.5 0.860.4 0.460.5
5 1.460.5 1.060.3 0.960.3 0.960.4 0.760.5
6 1.660.5 1.160.4 1.160.3 0.1260.5 0.860.4
7 1.8060.4 1.560.5 1.360.5 1.460.5 0.960.4
8 1.960.4 1.760.5 1.660.5 1.760.5 0.860.5
9 2.06.3 1.960.3 1.960.3 2.060.3 1.060.2
8. Perkins RP, Papile LA. The very low birth weight infant: incidence and significance of low Apgar scores, “asphyxia,” and morbidity. Findings at delivery.Am J Perinatol.1985;2:108 –113
9. Ladehoff P, Pedersen GT, Sorensen T. Apgar scores in low birth weight infants delivered vaginally and by cesarean section.Acta Obstet Gynecol Scand.1986;65:3–5
10. Catlin EA, Carpenter MW, Brann BS, et al. The Apgar score revisited: influence of gestational age.J Pediatr.1986;109:865– 868
11. Lan SJ, Yen YY, Lee CH, Chiu JF, Chang IC, Hsieh SF. The study of Apgar score and infant birth weight in the central Taiwan.Kao Hsiung I Hsueh Ko Hsueh Tsa Chih.1991;7:318 –322
12. Svenningsen L, Eidal K. Lack of correlation between umbilical artery pH, retinal hemorrhages and Apgar score in the newborn.Acta Obstet Gynecol Scand.1987;66:639 – 642
13. Josten BE, Johnson TR, Nelson JP. Umbilical cord blood pH and Apgar scores as an index of neonatal health.Am J Obstet Gynecol.1987;157:
843– 848
14. Goldenberg RL, Huddleston JF, Nelson KG. Apgar scores and umbilical arterial pH in preterm newborn infants.Am J Obstet Gynecol.1984;149: 651– 654
15. James LS, Weisbrot IM, Prince CE, Holaday DA, Apgar V. The acid-base status of human infants in relation to birth asphyxia and the onset of respiration.J Pediatr.1958;52:379
16. Myers SA, Paton JB, Fisher DE. The effect of initial Apgar score on the birthweight-specific survival of the very low-birthweight infant.Am J Perinatol.1987;4:288 –292
17. Behnke M, Carter RL, Hardt NS, Eyler FD, Cruz AC, Resnick MB. The relationship of Apgar scores, gestational age, and birthweight to sur-vival of low-birthweight infants.Am J Perinatol.1987;4:121–124 18. Schmidt B, Kirpalani H, Rosenbaum P, Cadman D. Strengths and
lim-itations of the Apgar score: a critical appraisal.J Clin Epidemiol.1988; 41:843– 850
DEVELOPMENT OF LANGUAGE-SPECIFIC PHONEMES
A 6-month-old Japanese infant can still detect English “r” and “l” sounds. But after another 6 months of exposure to the Japanese phoneme that lies between them (and not to English phonemes), the child standardizes on the Japanese phoneme and hears “l” and “r” as the same.
Calvin WH.Talking Heads.Review of Deacon TW.The Symbolic Species.New York, NY: WW Norton; 1997.
DOI: 10.1542/peds.101.1.77
1998;101;77
Pediatrics
Koons, Jennifer Pinto-Martin and Nigel Paneth
Thomas Hegyi, Tracy Carbone, Mujahid Anwar, Barbara Ostfeld, Mark Hiatt, Anne
The Apgar Score and Its Components in the Preterm Infant
Services
Updated Information &
http://pediatrics.aappublications.org/content/101/1/77
including high resolution figures, can be found at:
References
http://pediatrics.aappublications.org/content/101/1/77#BIBL
This article cites 18 articles, 1 of which you can access for free at:
Subspecialty Collections
http://www.aappublications.org/cgi/collection/neonatology_sub
Neonatology
sub
http://www.aappublications.org/cgi/collection/fetus:newborn_infant_
Fetus/Newborn Infant
following collection(s):
This article, along with others on similar topics, appears in the
Permissions & Licensing
http://www.aappublications.org/site/misc/Permissions.xhtml
in its entirety can be found online at:
Information about reproducing this article in parts (figures, tables) or
Reprints
http://www.aappublications.org/site/misc/reprints.xhtml
DOI: 10.1542/peds.101.1.77
1998;101;77
Pediatrics
Koons, Jennifer Pinto-Martin and Nigel Paneth
Thomas Hegyi, Tracy Carbone, Mujahid Anwar, Barbara Ostfeld, Mark Hiatt, Anne
The Apgar Score and Its Components in the Preterm Infant
http://pediatrics.aappublications.org/content/101/1/77
located on the World Wide Web at:
The online version of this article, along with updated information and services, is
by the American Academy of Pediatrics. All rights reserved. Print ISSN: 1073-0397.