University of New Hampshire
University of New Hampshire Scholars'
Repository
PREP Reports & Publications
Institute for the Study of Earth, Oceans, and Space
(EOS)
2014
Piscataqua Region Environmental Planning
Assessment 2015
Piscataqua Region Estuaries Partnership
Follow this and additional works at:
https://scholars.unh.edu/prep
Part of the
Marine Biology Commons, and the
Terrestrial and Aquatic Ecology Commons
This Report is brought to you for free and open access by the Institute for the Study of Earth, Oceans, and Space (EOS) at University of New Hampshire Scholars' Repository. It has been accepted for inclusion in PREP Reports & Publications by an authorized administrator of University of New Hampshire Scholars' Repository. For more information, please contactnicole.hentz@unh.edu.
Recommended Citation
Piscataqua Region Estuaries Partnership, "Piscataqua Region Environmental Planning Assessment 2015" (2014).PREP Reports & Publications. 358.
University of New Hampshire Nesmith Hall, 131 Main Street Durham, NH 03824 www.prepestuaries.org
An evaluation of environmental
planning efforts and land use
regulations for the
52 communities in the
Piscataqua Region.
PAGE 2 • 2015 PISCATAQUA REGION ENVIRONMENTAL PLANNING ASSESSMENT REPORT
Executive Summary
This is the second assessment of land use regulations and planning
practices in our watershed, and provides an important
understand-ing of how we are managunderstand-ing our community’s natural resources.
Although progress in protecting water quality has been made,
management actions are inconsistent across the watershed and even
within sub watersheds. In order to protect the places we live, and
accommodate growth. It is clear that purposeful coordination and
consistency is critical to success in improving water quality and
mini-mizing community costs associated with pollution and impacts from
intensifying weather events.
Conserving Land
Protecting and managing land in its natural
state is the easiest, cheapest and most effective action all
commu-nities can take. Conserving land and keeping it natural contributes
the most to reducing pollution and the
asso-ciated costs of treating impaired water. It is
clear from this assessment that most important
region-wide action needed is to conserve land
and increase and manage buffers and setbacks
along waterbodies.
Stormwater Management
All
communi-ties can reduce their treatment costs by working
to limit impervious cover in new building and
redevelopment projects. Municipalities can
begin by placing a cap of no more than 10% on
impervious cover for any development efforts
coming before town planning boards. Secondly,
it is critically important to adopt the model storm
water ordinance developed by the Southeast
Watershed Alliance and UNH Stormwater Center.
Communities also need to begin considering and enacting local
regulations requiring water quality assessments for all new proposed
development, based on a consistent measurement tool currently being
developed by DES and UNH SWC.
PREP’s Promise
To work with partners in continuing to build the
toolbox for communities to accomplish these important efforts, and to
support efforts to adopt and implement best practices. Dealing with
the issues of water pollution, stormwater, climate change and growth
is an on-going challenge, but done together in a targeted and
purpose-ful way, we can accomplish gains in improving water quality, keeping
costs down and maintaining what is truly special about our region.
TABLE OF CONTENTS
Watershed Map . . . 3
Glossary . . . 4
Watershed Threats . . . 5
Nitrogen Loading . . . 6
Impervious Cover . . . 8
Climate Change . . . 10
Findings . . . 13
Freshwater Wetlands . . . 14
Shoreland Protection . . . 18
Stormwater Management . . . 22
Climate Change . . . 26
Actions . . . 31
Acknowledgements & References . . . 35
Purpose and Methodology
The initial Piscataqua Region Environmental Planning Assessment
(PRE-PA) was first completed in 2010 (http://scholars.unh.edu/prep/36/) to
document the current status of environmental planning efforts and land use
regulations for each of the 52 municipalities (city and town governments) in
the Piscataqua Region watershed. The assessment involved the analysis of
questions associated with both regulatory and non-regulatory approaches
to resource management.
The 2015 PREPA is designed to provide an updated information base
to inform ongoing and emerging planning and environmental
protec-tion efforts, and to identify gaps and inconsistencies in the standards of
environmental protection reflected in the current ordinances, development
regulations, and natural resource protection strategies in each of the 52
mu-nicipalities. The 2015 PREPA also gathered information on municipal land
use policies and adaptation planning strategies designed to mitigate the
impacts of climate change on the Piscataqua Region
watershed. Data were collected and are current as of
Fall 2014.
The 2015 PREPA builds on the database of
infor-mation collected from the first assessment in 2010.
PREP, NH Department of Environmental Services, and
four regional planning commissions in New
Hamp-shire and Maine developed an updated questionnaire
to collect information on local programs, policies, and
regulations designed to protect water quality and
ecosystems, and prepare for the impacts of climate
change in the Piscataqua Region.
Staff from Southern Maine Regional Planning
Commission, Strafford Regional Planning Commission,
Rockingham Planning Commission and Southern NH
Re-gional Planning Commission worked with local officials
in the 52 communities to complete the questionnaire. Municipal master plans,
zoning ordinances, subdivision and site plan review regulations, natural hazard
mitigation plans, open space plans, natural resource inventories, and climate
change vulnerability assessments were reviewed to gather information. PREP
staff worked with analysts from Truslow Resource Consulting and the planning
commissions to ensure the information collected was as accurate as possible and
then compiled it into a database and analyzed for regional trends.
To present the overall findings for each of the major themes report cards
were created. Each report card is calculated based on the responses to the
topic associated questions, and what percentage of those responses attained
the minimum protective standards suggested by NHDES or PREP. Answers to
all of the questions from the assessment forms can be found online at
PAGE 4 • 2015 PISCATAQUA REGION ENVIRONMENTAL PLANNING ASSESSMENT REPORT
community allows more pollutants, sediments, and organic matter to reach neighboring water bodies. Effective Impervi-ous Cover (EIC) refers to those surfaces directly connected to waterbodies. (See pages 8-9)
Atmospheric Deposition
The process by which a pollutant in the atmosphere falls to land or surface waters through either wet or dry deposition. Wet deposition occurs when the pollutant is contained in rain or snow. Dry deposition occurs when the pollutant is attached to aerosols that fall to the earth.
Buffers
A strip of vegetated land between a water body and ad-jacent upland maintained in permanent vegetation (trees, shrubs, and/or grasses) and free from agricultural or urban encroachment. (See pages 14-15)
• Vegetated buffer: areas of natural or established vegetation allowed to grow with minimal to no maintenance. These are the most protective buffers.
• Managed buffer: managed areas may allow tree thinning, landscaping, and some accessory structures (sheds, swing sets), but should support a well distributed cover of trees, shrubs, and groundcover within the buffer area.
Setbacks
A municipal regulatory tool used to protect existing and potential lands from future encroachment. Setbacks and buffers should be used in conjuction to achieve necessary protections for clean, healthy watersheds. (See pages 18-19)
Stream Order
Stream size is organized in a numbered order. Streams of a higher number order are larger than those of a lower number order. Rivers are examples of higher order streams, typically 3rd or 4th order.
Great Bay Estuary
The body of water beginning at the confluence of the Piscataqua River with the Atlantic Ocean and extending to the head-of-tide dams on Winnicut, Squamscott-Exeter, Lamprey, Oyster, Bellamy, Cocheco, Salmon Falls, and Great Works Rivers. The Great Bay Estuary covers approximately 13,440 acres (21 square miles).
Piscataqua Region Watershed
The area of land where all of the water that drains off of it goes into either Great Bay Estuary or the Hampton-Seabrook Estuary. Piscataqua Region Watershed contains 42 towns in New Hampshire and 10 towns in Maine and covers 1,086 square miles. (See map on previous page)
Point source pollution
Pollution that comes from a single drainage pipe and enters into a water body. Point source pollution is commonly associated with wastewater treatment plants that release effluent into a river or other water body. (See pages 6-7)
Non-point source pollution
Pollution that generally results from land runoff, precip-itations, atmospheric deposition, drainage, seepage, or hydrologic modification. Pollution running off a landscape increases as impervious
cov-er/development increases.
(See pages 6-7)
Impervious Cover
Hard surfaces that cover
the ground and prevent rain and melting snow from soak-ing into the soil, such as the roofs of houses and buildsoak-ings, roads, and parking lots. Increased impervious cover within a
Illustration by Ellis, J.H. (2008)
Glossary
W A T E R S H E D T H R E A T S
P I S C A T A Q U A R E G I O N
E N V I R O N M E N T A L P L A N N I N G
A S S E S S M E N T
PAGE 6 • 2015 PISCATAQUA REGION ENVIRONMENTAL PLANNING ASSESSMENT REPORT
Nitrogen Loading
What & Why
Nitrogen is a nutrient that is essential to life in
the estuaries. However, scientific understanding of estuaries is
that high levels of nitrogen may cause problems like the excessive
growth of plants and algae. When the plants dies, oxygen
needed by fish is pulled out of the water and can cause fish to
How It Happens
NON-POINT SOURCE POLLUTION Nitrogen enters the bay
primarily in two ways. First, nitrogen from fertilizers from lawns and farms, septic systems, animal wastes, and air pollution or atmospheric deposition from the whole wa-tershed is carried into the bay through rain and snowmelt runoff, river flow, and groundwater flow, this is called Non-Point Source Pollution. These sources account for 70% of the nitrogen entering our system.
POINT SOURCE POLLUTION Second, there are 18
munic-ipal sewer treatment plants that discharge treated waste-water out through pipes either into the bay or into rivers that flow into the bay, this is called point-source pollution.
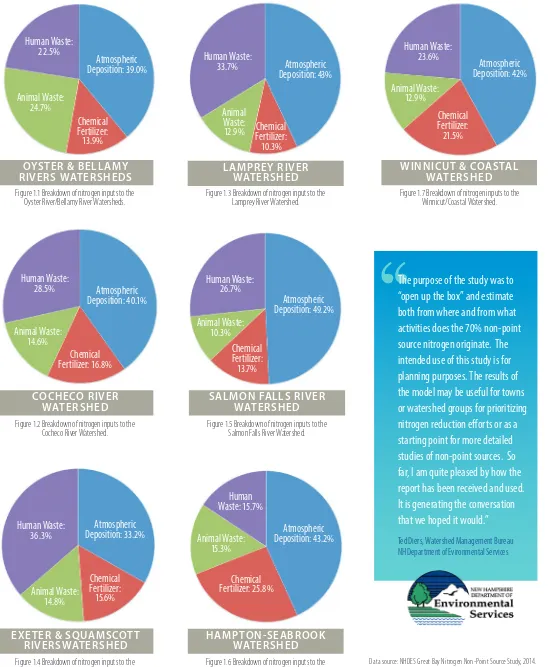
The graphs from the recently released Great Bay Ni-trogen Non-Point Source Study from NHDES (pg. 7), break down Nitrogen loading to the bay from non-point sources by subwatershed. For more detailed graphs of non-point source pollutant loads by town, source and pathway visit http://des.nh.gov/organization/divisions/water/wmb/coastal/ documents/gbnnpss-report.pdf
When the plants die, oxygen needed by fish is pulled
out of the water and can cause fish to suffocate.
suffocate. The rapid plant growth can also shade or smother
underwater eelgrass meadows and other important habitats,
limiting important functions such as providing food and shelter
and cleaning the water. Excess nitrogen is a problem across the
US and around the world.
What & Why
Nitrogen is a nutrient that is essential to life in
the estuaries. However, scientific understanding of estuaries is
that high levels of nitrogen may cause problems like the excessive
growth of plants and algae. When the plants die, oxygen needed
by fish is pulled out of the water by decomposers and can cause
T H R E A T S : N I T R O G E N L O A D I N G
COCHECO RIVER WATERSHED
EXETER & SQUAMSCOTT RIVERSWATERSHED
LAMPREY RIVER WATERSHED
SALMON FALLS RIVER WATERSHED
HAMPTON-SEABROOK WATERSHED
WINNICUT & COASTAL WATERSHED
Figure 1.3 Breakdown of nitrogen inputs to the
Lamprey River Watershed. Figure 1.7 Breakdown of nitrogen inputs to the Winnicut/Coastal Watershed.
Figure 1.2 Breakdown of nitrogen inputs to the
Cocheco River Watershed. Figure 1.5 Breakdown of nitrogen inputs to the Salmon Falls River Watershed.
Figure 1.4 Breakdown of nitrogen inputs to the
Exeter-Squamscott River Watershed. Figure 1.6 Breakdown of nitrogen inputs to the Hampton-Seabrook Watershed. Data source: NHDES Great Bay Nitrogen Non-Point Source Study, 2014. Nitrogen measured in pounds per year.
The purpose of the study was to
“open up the box” and estimate
both from where and from what
activities does the 70% non-point
source nitrogen originate. The
intended use of this study is for
planning purposes. The results of
the model may be useful for towns
or watershed groups for prioritizing
nitrogen reduction efforts or as a
starting point for more detailed
studies of non-point sources. So
far, I am quite pleased by how the
report has been received and used.
It is generating the conversation
that we hoped it would.”
Ted Diers, Watershed Management Bureau NH Department of Evironmental Services
Atmospheric Deposition: 40.1% Animal Waste: 14.6% Human Waste: 28.5% Chemical Fertilizer: 16.8% Atmospheric Deposition: 33.2% Animal Waste: 14.8% Human Waste: 36.3% Chemical Fertilizer: 15.6%
OYSTER & BELLAMY RIVERS WATERSHEDS
Figure 1.1 Breakdown of nitrogen inputs to the Oyster River/Bellamy River Watersheds.
PAGE 8 • 2015 PISCATAQUA REGION ENVIRONMENTAL PLANNING ASSESSMENT REPORT
Impervious Cover
Why It Matters
Pollutants like lawn fertilizers, road salts, pet waste, car flu-ids and litter end up on impervious surfaces. When it rains, instead of soaking in like it might in a forest, the rain runs off and it picks up all the polllutants and delivers them to the nearest waterbody. Impervious cover can also increase the velocity and volume of water during rain and snow-melt events leading to flash flooding. With the projections of increased rains due to climate change, this is a great concern. PREP has been tracking impervious surfaces in the Piscataqua Region since 1995.
Within the last 20 years impervious surface covering the Great Bay Watershed has increased from 28,695 acres
in 1990 to 63,241 acres in 2010. Overall, the population for the 52 municipalities in the watershed has grown by 19% from 316,404 in 1990 to 377,427 in 2010. During this same period, the total impervious surfaces within the towns grew by 120%. Therefore, the rate of increasing imper-vious surfaces has been six times the rate of popula-tion growth.
A great deal of research has shown that when 10% or
more of the land area of a watershed is covered with
impervious surfaces, water quality becomes impaired.
What & Why
Impervious surfaces are paved parking lots,
roadways, and roofs. During rain storms and snow melt, water
running off of impervious surfaces carries pollutants and
Note: High resolution impervious surface mapping was not available for Brookfield and Wakefield, New Hampshire and communities in Maine. Lower resolution mapping was used for these communities.
IMPERVIOUS SURFACE (4%) CONSERVED LAND (14%)
This map shows the acreage of conser-vation land (in green) and the acreage of impervious cover (in orange).
Main-taining a balance between conserva-tion land that cansoak up pollution,
like nitrogen, and impervious cover that helpsdeliver pollutionto surface waters is essential to maintaining clean
water in our estuaries. In addition, conservation land can help to
mitigate atmospheric deposition
of nitrogen which is the primary source of non-point source nitrogen in
every subwatershed in our region.
PREP’S GOALS
1.
Conserving 20% of the
watershed by 2020.
2.
No increase in the number
of watersheds & towns
with >10%
impervious cover.
PAGE 10 • 2015 PISCATAQUA REGION ENVIRONMENTAL PLANNING ASSESSMENT REPORT
Why It Matters
New Hampshire’s coastal climate, specifically, is expect-ed to continue warming as a result of increasing carbon emissions from human activities. With warming comes increased precipitation and frequency of
precipitation events, rapid and increasing snowmelt, coastal flooding, and relative sea level rise (Wake et al., 2011).
These major changes to climate and weather events will substantially affect water quality, wildlife habitat, and human commu-nities in unprecedented ways. An additional challenge associated with changing weather
patterns includes PREP’s ability to collect and interpret data to understand the health and changes in our estu-aries. As we experience more ‘unusual’ weather events,
the following are a few examples of what may become more difficult to understand and plan management strategies for • Increasing precipitation events that wash higher levels of
pol-lutants and nitrogen into the system,
• Observing changes in salt marsh migration and how our marshes are responding to these events, • Warming of waters that allow for the growth of vibrios and possibly other diseases such as MSX and Dermo (both oyster diseases),
• Appearance and growth of invasive species such as nuisance macroalgaes
With these unusual weather events and pat-terns growing more regular, the significant impacts associated with them make the data inconsistent from year to year (less stable and more varied). That in turn makes it harder to identify trends and changes.
Climate change impacts
are likely to contribute
additional stress to
coastal habitats that we
are working to conserve
and restore.
What & Why
New England’s climate is changing, and
the best available scientific information indicates that
climate change impacts such as sea level rise, increasing
temperatures, and more frequent severe storm events are
likely to increase throughout the next century. These major
changes to climate and weather events will substantially
affect water quality, wildlife habitat, and human
communities in unprecedented ways.
Seabrook, NH, photo by Maren-Bhagat Seabrook, NH
Predicted Impacts
Beyond changing the climate in the Piscataqua Region, climate change impacts are likely to contribute additional stress to coastal habitats that we are working to conserve and restore. For instance, increased frequency and intensi-ty of precipitation events will in turn transport additional non-point source pollution to our waterways negatively affecting water quality, eelgrass beds, and oyster reefs. Communities have an opportunity to begin—or contin-ue—planning for these predicted changes through local zoning laws or other town legislation (Wake et al., 2011).
Climate Change and New
Hampshire’s Economy
Climate change is fundamentally changing what it means to live in New England. Increased coastal flooding and extreme weather events are going to stress not only the natural resources in the Seacoast, but also infrastructure. Seacoast residents are all too familiar with increased flood-ing, and this trend is expected to continue.
In addition to flooding risks, the increased tempera-tures and precipitation are expected to negatively impact winter tourism in New England. In a study conducted by the Natural Resource Defense Council in December 2012 it was estimated that during the 2010 season the winter tourism industry in New Hampshire supplied jobs for nearly 8,000 employees and $259 million in wages adding a value of $451 million to the New Hampshire economy1.
1 Natural Resource Defense Council and Protect Our Winters December 2012 http://protectourwinters.org/climate_report/report.pdf
King Tide at Seabrook Beach, NH photo by Ron Sher
Most seacoast area
businesses have no
plans for how they’d
rebound from the impacts of a natural
disaster, yet admit they’d lose their
customer base in as little as three weeks
if they remained down. Given 25
percent of New Hampshire’s workforce
lives in the Seacoast region and given
the prospect for sea level rise and more
frequent and severe flooding , a bright
future for people, property and
prosperity depends on moving from
response to resilience. If its not on
paper, you don’t have a plan.”
Roger Stephenson, PREP Management Committee
T H R E A T S : C L I M A T E C H A N G E
PREDICTED IMPACTS
Precipitation (Frequency and Intensity)
Snowmelt
Snow accumulation
Coastal flooding (frequency and intensity)
W A T E R S H E D F I N D I N G S
P I S C A T A Q U A R E G I O N
E N V I R O N M E N T A L P L A N N I N G
A S S E S S M E N T
This section features a series of report cards that are calculated based on the responses to the assessment
questions regarding the topics of freshwater wetlands, shoreland protection, stormwater management
and climate change and what percentage of those responses attain the minimum protective standards
PAGE 14 • 2015 PISCATAQUA REGION ENVIRONMENTAL PLANNING ASSESSMENT REPORT
Freshwater Wetlands
Freshwater Wetland
The quality of shoreline habitat may
be the single biggest influence on the abundance and variety of
wildlife that live in or around a water body. High quality shoreland
buffers are characterized by bushes, trees, sedges, and other
plants rooted in the soil abutting water bodies. Freshwater
wetlands are the most threatened habitats in our watershed.
STORAGE Store large quantities of water for low flow periods in rivers during droughts
HABITAT For wildlife, birds & plants
FOOD For wildlife, birds, insects & invertebrates
PROTECTION Provide flood storage during heavy rains and rapid snow melt
FILTRATION Filters and traps polluted sediments to help maintain clean, drinkable, fishable
and swimmable waters
DRINKING WATER Releases water in low flow periods into rivers to allow for sustainability of
drinking water sources
What Freshwater Wetlands Do for Us
MANAGED BUFFERS
These managed areas may allow limited tree thinning,
landscaping, and some accessory structures (sheds, swingsets),
but should support a well distributed cover of trees, shrubs,
and groundcover within the buffer area.
What’s at Risk
Filling, ditching and changing hydrology to allow for build-able land is still quite prevalent and leaves these wetlands vulnerable to degradation. Polluted stormwater runoff from developed areas such as lawns, parking lots, driveways and buildings adjacent to wetlands can impact the hydrology, plant community and habitat of freshwater wetlands.
What Can Help
Enacting an enforced buffer of vegetated, undisturbed land surrounding the wetland is the best way to protect water bodies from pollution and degradation and to allow for the wetlands to continue to filter water, store water and provide food and habitat for wildlife. Given the abundance of wetlands in many Seacoast communities, a full 100’ minimum disturbance buffer on all wetlands may be difficult to achieve, especially in the developed areas. However, even a 25’ or 50’ buffer provides significant environmental benefit as opposed to a lawn or parking lot immediately adjacent to a wetland. Recent research conducted in the PREP region shows strong support by residents and homeowners for towns to increase buffers in order to protect and improve water quality and wildlife habitat (Johnston 2013).
Identifying and designating the highest functioning wetlands as Prime Wetlands in a community is important to help protect those areas of greatest ecological health and significance. Prime wetlands have greater protections under RSA 482-A:151
What Science Says
The New Hampshire Wildlife Action Plan, UNH Cooperative Extension and the NH Department of Environmental Ser-vices suggest that a 300 foot buffer of upland, unimpacted by development (no paved roads, buildings, driveways, etc.) protects
water resources and habitat for many species. However, New Hampshire Fish and Game suggests that the highest-quality wetlands are typically at least 1000 feet from houses, roads, driveways and trails and sur-rounded by in-tact vegetation.2 NO VEGETATION DISTURBANCE BUFFERS
The most protective. Undisturbed natural forest cover provides
maximum water quality filtering and wildlife benefits.
W H Y F R E S H W A T E R W E T L A N D S M A T T E R
Buffers are a critical
conservation practice
that the Natural
Resources Conservation Service (NRCS)
actively promotes. Buffers provide many
benefits including; streambank
stabilization, slow water runoff, trap
sediment, reduce noise and odors, trap
fertilizers and pesticides, provide food
and nesting for wildlife, among others.
Buffer installation, in conjunction with
land protection, provides significant
resource improvement for New
Hampshire’s lands, waters, and wildlife.”
Rick Ellsmore
State Conservationist, USDA - NRCS
Photo by Luca Barone The Islinglass River runs from Strafford through Barrington and
Rochester to meet the Cocheco River in Dover, NH
PAGE 16 • 2015 PISCATAQUA REGION ENVIRONMENTAL PLANNING ASSESSMENT REPORT
This report card is calculated based on the responses to six questions regarding freshwater wetland protection, and what percentage of those responses attain the minimum protective standards suggested by NHDES or PREP.
Assessment Questions
About Freshwater Wetlands
Does the municipality have designated “prime” wetlands (NH) or “significant” wetlands (ME), and adopted local regulations to protect these wetlands? Note: If the municipality does not have any of these types of wetlands then the question is not counted in the overall score.
Do municipal regulations offer explicit protection of vernal pools?
Does the municipality have a No soil disturbance or No Vegetation Disturbance buffer requirement that is >= 100 feet?
Does the municipality have a Building Setback requirement that is >= 100 feet?
Does the municipality have a Fertilizer
Application Setback requirement that is >= 100 feet?
Freshwater Wetlands Report Card
Visit www.prepestuaries.org/PREPA/ to see all results
RESULTS BY TOWN
F I N D I N G S : F R E S H W A T E R W E T L A N D S
71%
OF MUNICIPALITIES
ALLOCATED FUNDS COLLECTED
FROM THE LAND USE CHANGE
TAX TO LAND CONSERVATION.
THE PERCENT OF THESE
COLLECTED FUNDS ALLOCATED
ANNUALLY FOR CONSERVATION
RANGES FROM
13-100%.
2%
OF MUNICIPALITIES IN THE
WATERSHED HAVE ADOPTED
REGULATIONS RESTRICTING THE
APPLICATION OF FERTILIZER
ADJACENT TO WATERBODIES, AND
ONLY HALF OF THESE COMMUNITIES
REQUIRE A 100' BUFFER.
See Glossary on page 4 to learn the difference
between Buffers and Setbacks.
46%
OF MUNICIPALITIES IN
THE PREP REGION HAVE NO
REGULATIONS RESTRICTING THE
DISTURBANCE OF VEGETATED
BUFFERS ALONG WETLANDS.
75%
OF MUNICIPALITIES HAVE
NO REGULATIONS RESTRICTING
OR PREVENTING THE
APPLICATION OF FERTILIZERS
ALONG WETLANDS.
Painted Turtle in a wetland photo by Chris Keeley
The State of New Hampshire has a statute that enables towns to designate wetlands as
PRIME WETLANDS
and as such they are subject to greater protections. Learn more here:
http://des.nh.gov/organization/divisions/water/wetlands/prime_wetlands.htm
PAGE 18 • 2015 PISCATAQUA REGION ENVIRONMENTAL PLANNING ASSESSMENT REPORT
Vegetated Shorelands
A naturally vegetated
shoreland buffer (often referred to as a “riparian”
buffer) typically includes the natural floodplain of
a stream or river, and may encompass upland and
wetland areas. Shorelands also include those areas
adjacent to beaches, ponds and lakes.
What Shorelands Do for Us
SHADE
Keep rivers and streams cool to protect habitat for colder fish species like brook
trout
HABITAT
For birds, wildlife & plants, they are important breeding grounds for fish, turtles
and insects and nesting grounds for birds.
NUTRIENT RETENTION
The plants, shrubs and trees alongside a stream or river can take up and use
excess nitrogen and phosphorus before it reaches the water.
STABILIZATION
Of soil, sediment and small plants to prevent erosion. It helps keep lakes, ponds
and rivers clean and not muddy.
DRINKING WATER
The plants and ground soak up water, filter it and refill underground aquifers for
drinking water
PROTECTION
Of property, life and lands from floods, storm surges and polluted waters
ENJOYMENT &PROPERTY VALUES
From the land, it allows a natural and quiet place to view the water, to fish, to
walk. From the water it allows for views of natural shoreland surrounded by trees
and solitude. Waterfront properties are worth more with pristine waters than
with muddy, degraded waters.
Durham Point, Durham NH, Photo by John Carroll
What’s at Risk
From ponds to lakes, to streams and rivers, and salt marshes, bays and beaches, strong local land use regula-tions protecting shorelands are critical to protecting the long-term water quality of the Piscataqua Region’s sur-face waters. Salt marshes have been shown to be critical carbon sinks and capable of adjusting to gradual changes in sea level. Coastal salt marshes have been proven to be critical in protecting communities from coastal storms and surges. Building, development and other land use practices can impact natural buffers and decrease their ability to hold back sediment and floodwater, filter pollu-tion and help soak up storm water. Erosion of unvegetated or sparsely vegetated buffers can increase the sediment and cloudiness of lakes of rivers. As wetland boundaries – both marsh and coastal – change and as storm surges increase with climate change, shoreland buffer protection is increasingly important.
What Can Help
Enacting an enforced setback of all buildings, septic systems and fertilizer application from all ponds, lakes, streams, rivers and coastlines. Allowing for undisturbed, vegetated buffers of at least 100 feet on all water bodies, big or small have the best impact. Small stream tribu-taries usually make up the majority of stream miles in a watershed and have a direct impact on the water quality of the larger river segments and are the most vulnerable due to lack of local protection regulations.
W H Y S H O R E L A N D P R O T E C T I O N M A T T E R S
See Glossary on page 4 to learn the difference
between Buffers and Setbacks.
What Science Says
There is no one magic number at which a shoreland buffer is “wide enough” to meet all environmental objectives - generally speaking, bigger is better when it comes to protecting water quality and maintaining wildlife habitat. Buffers of less than 35 feet have not been found to sustain long-term protection of aquatic communities. A fertilizer application setback of 100 feet is the surest way to keep the nutrients from leaching into waterbodies and causing algae growth. The figure below provides a summary of the envi-ronmental services provided by different buffer widths.
PAGE 20 • 2015 PISCATAQUA REGION ENVIRONMENTAL PLANNING ASSESSMENT REPORT
This report card is calculated based on the responses to twenty questions regarding Shoreland Protection on 1st through 4th order streams and lakes/ponds, and what percentage of those responses attains the minimum protective standards suggested by NHDES or PREP. Note: Tidal Shoreland Protection was not included in this report card because not all towns have tidal shoreland.
Visit www.prepestuaries.org/PREPA/ to see all results
RESULTS BY TOWN
Assessement Questions About Shoreland
Protection 1st Order Streams
(see glossary on page 4 for definition)
Does the municipality have a No Vegetation
Disturbance or Managed buffer requirement
that is >= 75 feet?
Does the municipality have a Septic Setback
requirement that is >= 100 feet?
Does the municipality have a Primary Structure
Setback that is >= 100 feet?
Does the municipality have a Fertilizer
Application Setback requirement that is
>= 100 feet?
Assessment Questions About Shoreland Protection
2nd-4th Order Streams and Lakes/Ponds
(see glossary on page 4 for definition)
Does the municipality have a No Vegetation
Disturbance or Managed buffer requirement
that is >= 100 feet?
Does the municipality have a Septic Setback
requirement that is >= 100 feet?
Does the municipality have a Primary Structure
Setback that is >= 100 feet?
Does the municipality have a Fertilizer
Application Setback requirement that is
>= 100 feet?
% SUGGESTED PROTECTIVE STANDARDS ATTAINED
57%
OF MUNICIPALITIES HAVE
ADOPTED REGULATIONS TO
MANAGE AND PROVIDE LIMITED
PROTECTION FOR VEGETATED
BUFFERS ALONG SHORELAND.
F I N D I N G S : S H O R E L A N D P R O T E C T I O N
63%
OF MUNICIPALITIES HAVE
NOT ADOPTED REGULATIONS
REQUIRING NO DISTURBANCE
OF VEGETATED BUFFERS
ALONGSIDE STREAMS, PONDS,
AND LAKES.
THE PERCENTAGE OF LAND
CONSERVED IN EACH TOWN
RANGES FROM
2-30%
.
[Note: PREPA indicates Durham has 43% land conserved but this is not accurate because the figure includes UNH lands which are not permanently conserved.]
87%
OF MUNICIPALITIES REQUIRE
SETBACKS FOR PRIMARY
STRUCTURES FROM WATERBODIES;
27%
REQUIRE THESE STRUCTURES
TO BE SETBACK AT LEAST 100'.
83%
OF MUNICIPALITIES
REQUIRE SETBACKS FOR SEPTIC
SYSTEMS FROM WATERBODIES;
52%
OF MUNICIPALITIES
REQUIRE SEPTIC SYSTEMS TO
BE SETBACK AT LEAST 100'
FROM WATERBODIES.
One thing we have
learned over the past
several decades since
the Clean Water Act was passed is that
what we do on land profoundly affects
water quality. If we are to preserve and
protect our fresh, estuarine and marine
waters (and by extension the animals
and plants that live in them), we need to
separate our activities on land from
receiving waters using buffers. A gentle
slope of well-vegetated upland 100 feet
away from an open water body or
wetland will capture much of the
potential pollutants running off our
developed areas. “
Dr. David Burdick, University of New Hampshire
PAGE 22 • 2015 PISCATAQUA REGION ENVIRONMENTAL PLANNING ASSESSMENT REPORT
Stormwater Management
Stormwater Management
Stormwater contributes to over
90% of the surface water quality impairments in New Hampshire.
Increased regulations and permitting at the federal level are
quickly bringing stormwater management to the forefront in many
Piscataqua Region communities. Local efforts can make a big
difference when combating the impacts from stormwater pollution.
What’s in Stormwater
SOILS
Rain and snowmelt run off and pick up dirts and soils along their way
OILSFrom oil leaks in cars and spills around the house or gas station
NUTRIENTSNitrogen from the atmosphere comes in the form of rain and snow.
BACTERIAWaste from pets, livestock and wildlife as well as failing septic systems contains
bacteria and when rain and snowmelt run across the ground it picks up waste left
behind.
CHLORIDES
Found in road salts and other deicing materials that are applied to roads, highways,
parking lots and driveways, what’s left behind can get picked up by stormwater and
cause a salinity increase in rivers and streams.
TOXIC CONTAMINANTS
Motor oil, gasoline, pesticides and herbicides are picked up by runoff and delivered
to area streams and rivers.
What’s at Risk
As more and more acres of forest and farmland are con-verted to impervious surfaces (roads, parking lots, roofs, etc.), rain and snow melt is much more likely to pick up contaminants and transport them directly to streams, rivers, lakes, and estuaries. Conventional development practices and patterns have increased the volume and pol-lution load of stormwater runoff in Piscataqua Region wa-tersheds. As the population of the watershed has grown dramatically in the last 20 years, development has created new impervious surfaces at an average rate of nearly 1,500 acres per year. Many stormwater management systems designed to control some runoff are not always able to handle the large storm events that New Hampshire has experienced over the last several years and communities are facing increasing costs from failures of these systems (e.g. culverts, bridges, swales, etc.)
Additional stormwater pollution effects:
• Muddy streams from erosion and increased soils and sediments.
• Fish kills and harm to aquatic life, like eelgrass and oysters from increased nutrients and cloudy waters. • Cloudy, discolored water, surface sheens and build-up
from toxic contaminants.
• Algae blooms from excess nutrients.
What Can Help
Undeveloped land in a natural state provides excellent protection of water quality so land conservation is the best and most effective tool to helping reduce stormwa-ter pollution. Adopting ordinances and regulations for new development that mandates the use of stormwater filtration practices to clean runoff, and infiltration practices to reduce runoff is another very effective thing commu-nities can do. In addition requiring improved stormwater controls for reducing runoff for redevelopment projects or other significant construction.3
If communities can make a long-term commitment to fund and maintain stormwater controls along with an accounting mechanism to track long-term benefits of strategies they can plan better and be more proactive. Consider innovative funding mechanisms such as impacts fees, exaction fees and stormwater utilities to help build funding in a community.
What Science Says
Replicating nature wherever possible is the best action. In-stead of paving with impervious surfaces, creating spaces and places that allow the stormwater to soak in and filter is the best way to combat stormwater pollution. Implement-ing low impact development and green infrastructure standards in a community is a cost-effective way to keep more water on site, remove pollutants and help alleviate flooding. Green infrastructure uses natural “green” meth-ods to help reduce problems associated with stormwater runoff. Examples include shrub and tree buffers along streams, engineered systems that treat runoff by infiltrat-ing or filterinfiltrat-ing the water on site, incentives or education to encourage homeowners to protect soil and water, or regulations that require better stormwater control for new construction.
3http://southeastwatershedalliance.org/wp-content/uploads/2013/05/Final_
SWA_SWStandards_Dec_20121.pdf
4http://southeastwatershedalliance.org/green-infrastructure
W H Y STOR MWATE R M A N AG E ME NT I S IMP ORTA NT
We possess the tools and
know-how to address the
technical issues [of
stormwater]; however, the greater challenge
is in educating the public about the role
individual properties play in the stormwater
runoff problems, and the responsibility that
each property owner has in managing the
discharge of unwanted substances from their
properties. Developing public outreach and
education programs and encouraging
practical public participation projects that
engage individuals and municipal leaders in
innovative and creative ways will over time
make the biggest difference by modifying
behavior and attitudes about our individual
impacts on the environment.”
PAGE 24 • 2015 PISCATAQUA REGION ENVIRONMENTAL PLANNING ASSESSMENT REPORT
Assessment Questions About
Stormwater Management
Does the municipality have stormwater
management regulations?
Does the municipality have less than or
equal to 9% Impervious Cover?
Is the minimum area of soil disturbance that
“triggers” application of the municipality’s
stormwater management regulations less
than or equal to 20,000 sqft?
Does the municipality have a cap of 10%
effective impervious cover (EIC) for new
development in residentially zoned lots of 1
acre or more?
Do the municipality’s existing regulations
require the use of Low Impact Development
(LID) techniques to the maximum extent
practicable for new development and
re-development?
Do the municipality’s stormwater
management regulations reflect the
minimum design criteria for water quality (a)
volume/flow (WQV/WQF), (b) groundwater
recharge volume (GRV), and (c) peak flow
control defined in the NH Stormwater
Management Volume 2?
This report card is calculated based on the responses to eight questions regarding Stormwater Management and what percentage of those responses attains the minimum protective standards suggested by NHDES or PREP.
Stormwater Management Report Card
Visit www.prepestuaries.org/PREPA/ to see all results
RESULTS BY TOWN
F I N D I N G S : S T O R M W A T E R M A N A G E M E N T
ONLY
9 OUT OF 52
MUNICIPALITIES HAVE ADOPTED
A STORMWATER MANAGEMENT
ORDINANCE, AS RECOMMENDED
BY PREP.
3 OUT OF 52
TOWNS HAVE A CAP
OF 10% EFFECTIVE IMPERVIOUS
COVER (EIC) FOR NEW
DEVELOPMENT IN RESIDENTIALLY
ZONED LOTS OF 1 ACRE OF MORE.
28 OUT OF 42
ELIGIBLE NH
COMMUNITIES HAVE REPRESENTATION
ON THE SOUTHEAST WATERSHED
ALLIANCE.
The Southeast
Watershed Alliance,
which is a body politic
made up of the 42
communities in the NH coastal
watershed, is poised to provide regional
solutions to assist communities in
meeting the new stormwater
requirements and realizing savings
through economies of scale and
minimizing duplication of efforts. As a
first step, the Alliance developed model
stormwater regulations under a grant
with partners. Those regulations are
available on the SWA website at no cost
for communities to incorporate into
their regulations and achieve credit
towards meeting the pending MS4
permit requirements.”
Mike Trainque
Southeast Watershed Alliance
Counterbalancing Development with Management Strategies
Credit: UNH Stormwater Center
UNH Stormwater
Center Guidance
PAGE 26 • 2015 PISCATAQUA REGION ENVIRONMENTAL PLANNING ASSESSMENT REPORT
Climate Change
What & Why
Communities throughout the Piscataqua Region
Watershed are already seeing the effects of climate change
and more changes are expected in the future. Learning what
resources and infrastructure in your town are vulnerable to
climate change is the first step in preparing for changing climate
and building a more resilient community.
Seabrook, NH, Photo credit: King Tide Photo Contest winner Mike Barron
INCREASING TEMPERATURE
Temperatures are expected to increase in the Piscataqua/Great Bay region and
extreme heat is expected to become more frequent while extreme cold is expected
to become less frequent reducing annual snow cover.
SEA-LEVEL RISE
Sea level has been steadily increasing since 1926 and we can expect that sea level
will continue to rise further increasing the extent of coastal flooding and storm
surge.
INCREASING PRECIPITATION/ FLOODING
Increased precipitation as well as increased frequency and magnitude of extreme
precipitation events are expected to continue resulting in more frequent and longer
periods of flooding.
What’s At Risk
• Greater stress on routine and emergency services • Property loss leading to tax revenue loss
• Impacts on coastal historical resources and culture • Species loss and change including more invasive species • Loss of pollinators
• Changes in wildlife habitat
• Risks to drinking water supply from increased runoff during precipitation events
• Changes in groundwater flow to wetlands
For a more complete list of risks associated with climate change please review Carbon Solutions New England, “New Hampshire’s Climate: Past and Future Changes”1
What Can Help
The first step in preparing for a changing climate is to conduct a climate vulnerability assessment within your community . A climate vulnerability assessment will provide valuable information on why and how a town should adapt existing plans, policies, and regulations to become more resilient. For communities who have completed a climate vulnerability assessment the next step is to draft and adopt an adaptation planning strategy for your community.
What Science Says
Temperatures are expected to increase in the Piscataqua/ Great Bay region resulting in more extreme heat events during the summer and less extreme cold events during the winter. Warmer winters and increasing precipitation suggests a greater portion of winter precipitation will fall as fain reducing snow cover across the region.
Projected Sea-Level Rise
Sea-level rise is an impact of climate change unique to coastal communities and communities with tidal rivers. According to the Coastal Risks and Hazards Commission Science and Technical Advisory Panel (STAP) sea level is expected to rise between 0.6 feet and 6.6 feet by 2050 de-pending on the scenarios chosen by the National Climate Assessment in 2012.
1 https://www.climatesolutionsne.org/sites/climatesolutionsne.org/files/greatbayreport_online.pdf
2 Sea-level Rise, Storm Surges, and Extreme Precipitation in Coastal New Hampshire: Analysis of Past and Projected Future Trends.
http://nhcrhc.stormsmart.org/files/2013/11/CRHC_SAP_FinalDraft_09-24-14.pdf
Time Period* Intermediate Low Intermediate High Highest
2050
0.6 ft.
1.3 ft.
2.0 ft.
2100
1.6 ft.
3.9 ft.
6.6 ft.
*Using mean sea level in 1992 as a reference (Parris et al., 2012) Data source: Science and Technical Advisory Panel, NHCRHC, 2014.
I M P A C T S O F C L I M A T E C H A N G E
STAP recommends coastal communities plan for the “Intermediate High” scenario, but urges communities to be prepared to manage and adapt to the “Highest” scenario if necessary. Given sea-level rise projections, it is estimated that today’s 100-year flood storm surge will occur more fre-quently by 2050. Combined with more frequent and intense storms communities could be facing more frequent and longer durations of flooding.2
PAGE 28 • 2015 PISCATAQUA REGION ENVIRONMENTAL PLANNING ASSESSMENT REPORT
Assessment Questions about Climate Change
Has the municipality completed some
form of climate change vulnerability
assessment?
Has the municipality completed some
form of climate change adaptation
planning effort?
Has the municipality adopted
regulatory changes intended to reduce
the municipality’s vulnerability to
potential climate change impacts?
This report card is calculated based on the responses to the three major questions regarding Climate Change prepared-ness and what percentage of climate change preparedprepared-ness actions have been completed by each municipality.
Climate Change Report Card
Visit www.prepestuaries.org/PREPA/ to see all results
RESULTS BY TOWN
% SUGGESTED PROTECTIVE STANDARDS ATTAINED
NO
COMMUNITIES HAVE
UPDATED DESIGN STANDARD
REQUIREMENTS FOR NEW
PUBLIC INFRASTRUCTURE THAT
ACCOUNTS FOR THE IMPACTS OF
CLIMATE CHANGE.
F I N D I N G S : C L I M A T E C H A N G E
ONLY
11%
OF MUNICIPALITIES
HAVE COMPLETED VULNERABILITY
ASSESSMENTS.
10%
OF MUNICIPALITIES HAVE
IDENTIFIED INFRASTRUCTURE IN
NEED OF RELOCATION DUE TO THE
IMPACTS OF CLIMATE CHANGE.
A culvert in Portsmouth’s South End is close to overflowing during King Tide, October 2014. Photo by Cindy Jupp Jones.
Starting today, if all new
or rebuilt homes, other
buildings and
infrastruc-ture are designed with fuinfrastruc-ture flood levels in
mind we will be far less vulnerable when the
day comes when sea level really is four feet
higher than today. The additional cost of
designing-in that adaptation is small
compared to the loss and damage that
would otherwise result. We need to take a
“no-regrets” approach to planning and
design by building in resiliency to our
communities starting now. That approach is
essential in the event of a worst case
scenario, more than necessary in a best case
scenario, but a good thing either way.”
Cliff Sinnott,
W A T E R S H E D A C T I O N S
P I S C A T A Q U A R E G I O N
E N V I R O N M E N T A L P L A N N I N G
A S S E S S M E N T
This section contains region-wide recommended actions that are based upon
the findings of the assessment. Town-by-town action plans can be found in the
PAGE 32 • 2015 PISCATAQUA REGION ENVIRONMENTAL PLANNING ASSESSMENT REPORT
Actions: Region-Wide
Taking Action Now
The 2015 PREPA provides a
comprehensive review of the current state of municipal
environmental regulations in place in the 52 communities
in the Piscataqua Region watershed. The results of the
review show that although communities value their natural
resources and have taken steps to manage those resources,
there are critical protections still needed in most communities
throughout the watershed.
The time to act is now. The Piscataqua Region is a very spe-cial place, that is being recognized in many ways as one of the top areas in the country to live. As a result
the region is experiencing unprecedented growth that will continue into the future. To grow thoughtfully and retain what is special in our communities and our estuaries we must take action now.
The following actions are critical:
1. Increase naturally vegetated buffers adjacent
to all streams, rivers, lakes, ponds, estuaries, and wetlands to a minimum of 100’ from the water resource.
2. Increase setback requirements for septic systems and primary structures to at least 100’ from all streams, rivers, lakes, ponds, estuaries, and wetlands.
3. Adopt regulations preventing the application of fertilizer within 100’ of all streams, rivers, lakes, ponds, estuaries, and wetlands.
4. Adopt model stormwater management regulations.1
5. Conduct a climate vulnerability assessment to prepare for community impacts resulting from more frequent storm events and associated flooding.3
6. Increase land conservation efforts. Work with landowners in-terested in voluntary land conservation. Many communities in the watershed complete an Open Space Plan and/or Natural Resource Inventory that identifies town-specific conservation priorities.2
All 52 towns in the
Piscatqua Region
need to do the 6
critical actions.
Freshwater Wetlands
& Shoreland Protection
BUFFERS are still inconsistent region-wide. Enacting
comprehensive, cohesive buffer regulations on all streams, rivers, wetlands and shorelands is the most essential thing communities can do. For guidance see Buffers for Wetlands and Surface Waters: A Guidebook for NH Municipalities.4
SETBACKS for septic systems and primary structures: Septic
systems and primary structures (houses, build-ings) located along shorelands and wetlands impact water quality due to the leaching of polluting nutrients from leach fields and runoff from yards, driveways, roofs, and roads. PREP recommends both septic systems and primary structures be setback at least 100’ from waterbod-ies. Setbacks are also one of the easi-est, cheapest and most effective ways to limit pollution entering our water systems.
Fertilizer application regulations – Every commu-nity in the watershed needs to address the problem of too much nitrogen entering waterbodies from abut-ting uplands. Lawn fertilizer, and to a smaller extent, fertilizer applied by agricultural operations, are sources of nitrogen.
Stormwater
Management
Stormwater management encompasses the
following activities: 1) controlling non-point source pollu-tion from future development; 2) mitigating and reducing non-point source and stormwater pollution from existing development; 3) and managing the quality and quantity of
surface water and groundwater resources. All commu-nities in the PREP region need a cost effective way to manage stormwater.
Communities are strongly encouraged to use the model developed by the watershed-based Southeast Watershed Alliance (SWA) available on the SWA website.1
Land Conservation
Permanently protecting land from development is a critical tool used by most municipalities to protect water
resources and wildlife habitat. It is the least expen-sive and most effective action to preventing
water pollution and supporting healthy ecosystems. Conserved land provides critical
ecosystem services, including flood storage and food production. It enhances land values in a community and meets the increasing
need for recreational opportunities. As of 2015 municipalities have conserved
14% of land in the region. The development of a town-specific Natural Resources Inventory (NRI) is an important first step to enable local decision makers to identify and prioritize land for conservation.
Allocating funds through town bonds is the best way to accomplish conservation.
Secondly, allocating funds collected via the land use change tax to costs associated with land conservation provides municipalities with an exisist-ing pool of funds.
Land Conservation
Plans for NH and Maine
2NH Climate
Adaptation Workgroup
Resources
3KEY RESOURCES FOR ACTION:
Southeast Watershed
Alliance’s Model Stormwater
Ordinance
1A C T I O N S : W H A T W E C A N D O
For more information, visit www.prepestuaries.org/PREPA/
1http://southeastwatershedalliance.org/wp-content/uploads/2013/05/Final_SWA_SWStandards_Dec_20121.pdf 2 http://prepestuaries.org/initiatives/conservation-restoration
PAGE 34 • 2015 PISCATAQUA REGION ENVIRONMENTAL PLANNING ASSESSMENT REPORT
Climate Change
Vulnerability & Adaptation
The PREPA asked several questions about municipal actions regarding climate change, and our region has a ways to go in this important area.
Municipalities are acknowledging and planning for the effects of increasing and intensifying storm events that are causing flooding, erosion, and property damage. Local deci-sion makers need to assess and plan for how these impacts will affect their communities. An assessment should help inform land use decisions, and identify areas most at risk. “Sandy-sized storms” are going to continue to happen more frequently, and it is critically important that our communities are prepared.
The New Hampshire Coastal Adaptation Workgroup (NHCAW) is a collaboration of 19 organizations working to help communities in New Hampshire’s seacoast prepare for the effects of extreme weather events and associated impli-cations. The NHCAW website provides links to many resourc-es for municipalitiresourc-es to help learn more about the impacts of climate change in the region, http://nhblog.stormsmart. org/links-to-resources-for-adaptation-to-climate-change/. The NHCAW also hosts periodic workshops inviting all town boards, leaders and decision makers to come and learn about the issues facing the seacoast and develop tools and action plans to help communities move forward in ad-dressing the impacts from a changing climate.
See our Subwatershed Reports for town-by-town
Action Plans. Visit
www.prepestuaries.org/PREPA/
for more information
Use Municipal Natural Hazard Mitigation Plans
to Support Climate Adaptation Planning and
Water Quality Protection!
The Federal Emergency Management Agency (FEMA) requires every municipality in the country to develop a Natural Hazard Mitigation Plan, and to update the Plan every 5 years. The purpose of these Plans is to protect citizens and their property from exposure to natural hazards such as flooding, storm surges, winter storms, extreme heat, etc. Plans are researched and written by municipal staff, including the Emergency Management Director, Road Agent, Police Chief and Fire Chief, with assistance from consulting planners and staff from NH Homeland Security and Emergency Management.
Acknowledgements & References
Project Manager: Jill Farrell, PREP
Project Intern: Abigail Gronberg, UNH
Graphic Designer: Alicen Armstrong Brown,
Tangram 3DS, Kittery, ME
Assessment Consultant: Theresa Walker, Rockingham Planning Commission
Data Consultant: Truslow Resource Consulting,
Portsmouth, NH
Spatial Mapping Consultant: Kirsten Howard, New Hampshire Coastal Program
In addition to PREP funds, this project was made possible through funding from the Lamprey Rivers Advisory Com-mittee and the NH Coastal Program.
Thanks to PREP’s Management Committee and other interested parties who helped guide the assessment questions and report development including:
Natural Resource Outreach Coalition
New Hampshire Coastal Adaptation Workgroup Rockingham Planning Commission
Southern New Hampshire Regional Planning Commission Southern Maine Regional Planning Commission
Strafford Regional Planning Commission
Chris Fuert, Wells National Estuarine Research Reserve Cory Riley, Great Bay National Estuarine Research Reserve Cliff Sinnott, Rockingham Planning Commission
David Burdick, University of New Hampshire David Cedarholm, Tighe and Bond
Steve Couture, New Hampshire Coastal Program Derek Sowers, formerly with PREP
James Houle, UNH Stormwater Center Mike Trainque, Southeast Watershed Alliance Rachel Rouillard, PREP
Rick Ellsmore, USDA-NRCS
Roger Stephenson, Stephenson Strategic Communications Ted Diers, NH Department of Environmental Services
References
Connecticut River Joint Commission. 2000. Introduction to Riparian Buffers Fact Sheets Series. URL: http://www.crjc.org/riparianbuffers.htm
Ellis, J.H. (2008). URL: http://www.mtaudubon.org/issues/wetlands/documents/Science%20Series/MA_Science_Setbacks_WaterQuality_2008.pdf
Exeter-Squamscott River Local Advisory Committee (ESRLAC), 2012. Exeter-Squamscott River Watershed Management Plan Update. URL: http://des.nh.gov/organization/divisions/water/wmb/rivers/documents/ext-squam-plan.pdf
Fargo, T. 2002. Quantifying the Bellamy River Watershed Hydrologic Budget. Town of Madbury. URL: http://townofmadbury.com/BellamyWaterBudgetToM.pdf
Johnston, R.J., B. Holland, C. Feurt, P. Wiley, K. Wilson, T. Smith, J. Miller, J. Aman, M. Dionne, C. Peter and V. DeLauer. 2014. Integrating Ecological and Economic Data for Ecosystem Service Valuation: The Wells Riparian Land Project. Wells National Estuarine Research Reserve.
Lamprey River Watershed Association (LRWA), 2015. About the Waterehsed. URL: http://www.lrwa-nh.org/about-the-watershed/
NH Department of Environmental Services. (NHDES), 2010. Environmental Fact Sheet: The Cocheco River. WD-R&L-23. URL: http://des.nh.gov/organization/commissioner/pip/factsheets/rl/documents/rl-23.pdf
NH Department of Environmental Services. (NHDES), 2011. Environmental Fact Sheet: The Lamprey River Watershed. WD-R&L-24. URL: http://des.nh.gov/organization/commissioner/pip/factsheets/rl/documents/rl-24.pdf
Salmon Falls Watershed Collaborative (SFWC), 2011. Action Plan. http://prepestuaries.org/01/wp-content/uploads/2013/12/sfwc-salmon-actionplan_final.pdf
Vanasse Hangen Brustlin, Inc. (VHB), 2014. Oyster River Integrated Watershed Plan for Nitrogen Load Reductions, Final Technical Report – July 2014. URL: http://www.oysterriveriwp.com/pdf/2014-07-10-ORIWMP-v12-Final%20with%20cover.pdf
This report was funded in part by the U.S. Environmental Protection Agency through an agreement with the University of New Hampshire
www.prepestuaries.org Twitter.com/PREPCommunity Facebook.com/PREPCommunity