Lincoln
University
Digital
Thesis
Copyright
Statement
The
digital
copy
of
this
thesis
is
protected
by
the
Copyright
Act
1994
(New
Zealand).
This
thesis
may
be
consulted
by
you,
provided
you
comply
with
the
provisions
of
the
Act
and
the
following
conditions
of
use:
you
will
use
the
copy
only
for
the
purposes
of
research
or
private
study
you
will
recognise
the
author's
right
to
be
identified
as
the
author
of
the
thesis
and
due
acknowledgement
will
be
made
to
the
author
where
appropriate
you
will
obtain
the
author's
permission
before
publishing
any
material
from
the
thesis.
A Study of Endogenous Transposon Activity
in Grapevine (
Vitis vinifera
L.
)
A thesis
submitted in partial fulfilment
of the requirements for the degree of
Doctor of Philosophy
at
Lincoln University
by
Darrell K. Lizamore
Lincoln University
Abstract of a thesis submitted in partial fulfilment of the
requirements for the degree of Doctor of Philosophy.
Abstract
A Study of Endogenous Transposon Activity in Grapevine (
Vitis vinifera
L.)
by
Darrell K. Lizamore
Transposable elements (TEs) are recognised as a significant and ubiquitous component of eukaryotic
genomes. This thesis contributes to the current knowledge of these elements by describing the
stimulated mobilisation of multiple class I and class II elements from eight TE superfamilies in
grapevine somatic embryo cultures following stress treatments and tissue culture, leading to the
production of new vegetative material.
An in silico analysis of class I TEs in the grapevine genome revealed that although the majority of the 137 defined retrotransposon families exist mainly as eroded fragments, several families show
evidence of recent mobility or appear in transcript databases. Based on these results, a
high-resolution S-SAP technique was used to identify insertion polymorphisms of three Ty1-Copia TE
families (Edel, Noble and Cremant) and one Ty3-Gypsy family (Gret1) across 32 grapevine genotypes,
demonstrating the contribution of these elements to genetic diversity in Vitis.
By supplementing bacterial suspensions with an organosilicone surfactant, the efficiency of
Agrobacterium-mediated transient transformation of grapevine leaf tissue was improved by an average of 72-fold. This protocol was used to show that of the above four TE families, only the
long-terminal repeat (LTR) sequence of Edel is able to drive expression of reporter genes in grapevine leaf
tissue, but all four are capable of stimulating expression in the model plant N. tabaccum. After two
generations, the LTR sequences of Gret1 and Edel no longer induced reporter gene expression in
stable N. tabaccum transgenic plants, but the LTR sequences of Cremant and Noble retained a
wound-responsive expression pattern.
Due to their sessile lifestyle, plants are forced to endure and adapt to environmental challenges.
Biotic (e.g. pathogen attack) and abiotic (e.g. wounding / drought) stress events have previously been
cultures were co-cultivated with live yeast species endemic to New Zealand vineyards. Abiotic
stresses and fungal extracts did not elicit the same response. A total of 24 new TE polymorphisms,
relating to all four of the TE families analysed, were detected by S-SAP in a population of 183 vines
regenerated from EC cultures. The majority (14) of these polymorphisms were found in vines
regenerated from yeast-stressed EC tissue. The regenerated vines also displayed a variety of
phenotypic abnormalities.
Finally, whole-genome sequence data from twenty of the regenerated vines revealed that vines
passaged through somatic embryogenesis experienced a general activation of the mobilome,
resulting in an average of 64 new TE insertions per plant from both TE classes. Yeast stress at the
embryogenic callus stage increased the number of new TE insertions identified by 63%. Despite a
strong general bias against coding DNA sequence (CDS) insertions, approximately 2 insertions were
found in this context per plant. These data are discussed with regards to the biological implications of
endogenous TE mobilisation and the potential use of these elements for saturation mutagenesis in
grapevine.
Keywords: genomics, grapevine, mobilome, somatic embryogenesis, somatic mutation,
retrotransposon, transposable element, transposon display, Vitis vinifera, VvMYBA1, whole-genome
Acknowledgements
Research is a long an expensive process, but I have been truly humbled by the number of people who
have invested time, energy and finances into this project.
My supervisor, Dr Chris Winefield, has been unfailing in his support and assistance throughout my
doctoral studies. I have the greatest admiration for his ability to be at the same time both
enthusiastic and critical towards my work and I am fortunate to have gained both a friend and a
mentor in these past few years. I am also especially thankful to my co-supervisor, Prof Brian Jordan,
for his invaluable advice and feedback at all stages of the project, both in academic and personal
regards.
My work has been funded by a Lincoln University Doctoral Scholarship and the inaugural New
Zealand Winegrowers (NZW) Rod Bonfiglioli Memorial Scholarship. I am most grateful to these two
groups for this opportunity. Specifically, I would like to thank Dr Simon Hooker at NZW for his
positivity and support.
Dr Susan Thompson (bioinformatician, Plant & Food Research, New Zealand) has been crucial to the
analysis of the raw Illumina sequence data, and Dr Mark Fiers (bioinformatician, VIB, Belgium) has
also given much of his time to help us interpret this data. To both of these people I am gratefully
indebted. Thanks also to Dr Mat Goddard (Auckland University) for sending us the six yeast strains
that his research group has collected from New Zealand vineyards and characterised.
To my lab colleagues, thank you for your friendship and support over the past few years. It has been
a pleasure to work with you. Thanks especially to Josh Philips for his management of the laboratory.
During this work a series of earthquakes devastated Christchurch. What followed was the greatest
display of community and generosity that I have ever witnessed. To the Cantabrians who have been
resilient and made us feel at home throughout this difficult period, we will always speak well of you.
Thank you especially to the Metcalf family, who have been our family away from home in every way
possible and to David and Eriko Viviers, for their unfailing support, friendship and understanding.
Finally, I thank God for this incredible opportunity and the strength to meet these challenges. To my
wife Cathy, who has been kind, patient and selfless, even while working on her own doctoral thesis, I
Table of Contents
Abstract ... iii
Acknowledgements ... v
Table of Contents ... vi
List of Tables ... xii
List of Figures ... xiii
Acronyms ... xvii
Chapter 1 Introduction ... 1
1.1 The economic importance of viticulture ... 1
1.2 The value of cultivar identity ... 2
1.3 Limited diversity within varieties ... 2
1.4 Exploiting natural genetic variation ... 3
1.5 Tracking and increasing mutation rates ... 3
1.6 Hypotheses to be tested ... 4
1.6.1 H1: The grapevine genome reveals differences among the historical activity of transposon families ... 4
1.6.2 H2: Transposon insertion polymorphisms contribute to clonal variation in grapevines ... 4
1.6.3 H3: The insertion patterns of specific TE families can be used to track genetic variation in grapevine ... 5
1.6.4 H4: TEs in grapevines are activated under stress conditions ... 5
1.6.5 H5: An in silico analysis of TE-related sequences in the genome enables prediction of the most mutagenic element families ... 6
1.6.6 H6: Mobilisation of endogenous retrotransposons can be used to produce phenotypically varied grapevine plants... 6
Chapter 2 Literature Review... 7
2.1 Mutations in vegetative tissue result in chimeras ... 7
2.1.1 Sexual reproduction in agriculture ... 7
2.1.2 Vegetatively propagated crops ... 7
2.1.3 Somatic mutations ... 8
2.1.4 Chimerism of vegetative propagules ... 8
2.1.5 Grapevine genetic improvement strategies ... 9
2.2 Transposable Elements ... 13
2.2.1 Transposon types ... 14
2.2.2 A closer look at LTR-retrotransposons ... 16
2.2.3 Insertion site preferences ... 19
2.2.4 Epigenetic regulation of transposition ... 20
2.2.5 Transposition as a response to a changing environment ... 23
2.2.6 It’s not all bad news: How TEs pay the rent ... 25
2.2.7 Using TEs as molecular markers ... 27
2.2.8 TEs as tools for mutagenesis ... 28
2.2.9 TEs in grapevine ... 28
2.2.10 The Gret1 insertion in VvMYBA1... 30
2.3 Grapevine Somatic Embryogenesis ... 31
2.3.2 Somatic embryo tissue culture ... 31
2.4 Open questions ... 34
Chapter 3 An in silico Analysis of Grapevine LTR-Retrotransposons ... 35
3.1 Overview ... 35
3.2 Introduction ... 36
3.2.1 Retrotransposon-derived sequences in the grapevine genome ... 36
3.2.2 LTRs as promoter elements ... 36
3.3 Methods ... 38
3.3.1 Extracting retrotransposon insertions from the PN40024 genome ... 38
3.3.2 Grapevine retrotransposon phylogeny ... 38
3.3.3 Regulatory motif screening in LTR sequences ... 39
3.4 Results ... 40
3.4.1 The distribution and integrity of retrotransposon insertions in the grapevine genome ... 40
3.4.2 Phylogeny of grape retrotransposons ... 44
3.4.3 Stress-response motifs in five retrotransposon families ... 51
3.4.4 Retrotransposons in grapevine transcript databases... 53
3.5 Discussion ... 55
3.5.1 Insertion numbers ... 55
3.5.2 Retrotransposon lineages ... 55
3.5.3 Retrotransposon expression ... 57
3.6 Conclusions ... 58
Chapter 4 Retrotransposon-based Markers for Genotyping Grapevines ... 59
4.1 Overview ... 59
4.2 Introduction ... 60
4.2.1 Molecular markers for genotyping ... 60
4.2.2 Transposon profiling ... 61
4.2.3 The use of retrotransposons as markers in grapevine ... 62
4.2.4 Improved transposon-based genotyping in grapevine ... 64
4.3 Methods ... 67
4.3.1 Sample preparation ... 67
4.3.2 Primer design ... 67
4.3.3 REMAP & IRAP ... 69
4.3.4 S-SAP with fluorescent dye-labelled primers ... 69
4.3.5 Biotin S-SAP ... 71
4.3.6 Band re-amplification ... 71
4.3.7 RBIP marker design and testing ... 71
4.3.8 Methyl-sensitive transposon display ... 72
4.3.9 FTA cards ... 72
4.4 Results ... 73
4.4.1 Sample preparation ... 73
4.4.2 Direct amplification of genomic DNA with retrotransposon-specific primers ... 73
4.4.3 S-SAP optimization ... 74
4.4.4 Variation between grapevines ... 80
4.4.5 Comparison: fluorescent dye-S-SAP and biotin-S-SAP ... 81
4.4.6 Individual polymorphic bands can be converted to RBIP markers... 82
4.5 Discussion ... 89
4.5.1 The limitations of IRAP and REMAP ... 89
4.5.2 The advantages of S-SAP with fluorescent tags ... 89
4.5.3 The degree of S-SAP polymorphism between vines ... 90
4.5.4 Differences between TE families ... 91
4.5.5 RBIP markers as tools for variety identification ... 91
4.5.6 Epigenetic methylation of retrotransposon-flanking DNA ... 91
4.5.7 Increasing throughput: direct genotyping off FTA cards ... 92
4.6 Conclusions ... 93
Chapter 5 Improving Transformation Efficiency in Grapevine Tissue ... 94
5.1 Overview ... 94
5.2 Introduction ... 96
5.2.1 Agrobacterium plant transformation ... 96
5.2.2 Surface tension: the major barrier to bacterial infiltration ... 96
5.2.3 GUS / VvMYBA1 as reporters ... 96
5.3 Methods ... 98
5.3.1 Leaf tissue penetration ... 98
5.3.2 Vector construction ... 98
5.3.3 Transient transformation at ambient temperature ... 98
5.3.4 VvMYBA1 efficiency scoring ... 99
5.4 Results ... 100
5.4.1 The addition of Pulse increases in vivo infiltration at atmospheric pressure. ... 100
5.4.2 VvMYBA1 is a more precise transformation marker than GUS in grapevine leaves. .... 100
5.4.3 Improved transient transformation ... 101
5.5 Discussion ... 105
5.5.1 The necessity for improved transient infiltration efficiencies... 105
5.5.2 VvMYBA1 gene expression is suitable for quantifying transformation efficiency ... 105
5.5.3 Improved transient transformation ... 106
5.6 Conclusions ... 107
Chapter 6 Transcriptional Regulation of Grape Retrotransposon Activity in Response to Environmental Stress Events ...108
6.1 Overview ... 108
6.2 Introduction ... 110
6.2.1 Grapevine TE responses to stresses ... 110
6.2.2 Tissue types ... 111
6.2.3 Stress types ... 111
6.3 Methods ... 112
6.3.1 Plant material ... 112
6.3.2 Preparation of embryogenic callus samples ... 112
6.3.3 Stress treatments ... 113
6.3.4 Sample preparation ... 115
6.3.5 Retrotransposon transcript quantification ... 116
6.3.6 In vivo LTR-reporter assays ... 117
6.4 Results ... 121
6.4.1 Initiation and maintenance of embryogenic callus cultures ... 121
6.4.2 Sample processing ... 121
6.4.3 Retrotransposon transcript quantification ... 122
6.5 Discussion ... 136
6.5.1 Sample processing ... 136
6.5.2 Wild yeasts stimulate retrotransposon expression ... 136
6.5.3 The contribution of native yeasts to terroir ... 137
6.5.4 General increase of multiple TE families ... 138
6.5.5 Difference between relative and absolute expression... 138
6.5.6 LTR-reporter transformations ... 139
6.6 Conclusions ... 141
Chapter 7 The Generation of a Tagged Mutant Population of Pinot Noir Vines ...142
7.1 Overview ... 142
7.2 Introduction ... 143
7.2.1 Tagged mutant populations ... 143
7.2.2 Transposon mutagenesis approaches ... 143
7.2.3 TE activity in response to stress ... 144
7.2.4 Somatic embryos as explant material ... 144
7.3 Methods ... 146
7.3.1 Embryogenic callus initiation... 146
7.3.2 Shock treatments and vine regeneration ... 146
7.3.3 S-SAP on pooled DNA samples ... 147
7.4 Results ... 149
7.4.1 Initiation of embryogenic callus ... 149
7.4.2 Post-shock regeneration of somatic embryos ... 150
7.4.3 Phenotypic variation of regenerated vines ... 151
7.4.4 Transposon insertion profiles ... 154
7.5 Discussion ... 160
7.5.1 Somatic embryos culture ... 160
7.5.2 Phenotypic variation among regenerated vines ... 160
7.5.3 Novel transposon mutations ... 161
7.5.4 The limitations of S-SAP... 161
7.6 Conclusions ... 163
Chapter 8 The Whole-Mobilome Analysis of Grapevines Regenerated from Embryogenic Cultures ...164
8.1 Overview ... 164
8.2 Introduction ... 165
8.2.1 Using next-generation sequencing technologies to detect TE mutants ... 165
8.2.2 Identifying transposon polymorphisms in shotgun sequence data ... 166
8.2.3 General calculations for saturation mutagenesis in grapevine ... 166
8.2.4 Characterising the mobilome ... 168
8.3 Methods ... 170
8.3.1 Sample preparation and sequencing ... 170
8.3.2 Transposable element identification ... 171
8.3.3 Comparing novel insertions ... 171
8.4 Results ... 172
8.4.1 Illumina sequence data quality ... 172
8.4.2 Whole-genome sequencing (WGS) confirms transposition of four retrotransposon families ... 172
8.5 Discussion ... 182
8.5.1 Retrotransposon polymorphism among vines regenerated from stressed embryogenic callus ... 182
8.5.2 Active element types ... 183
8.5.3 Insertion site bias ... 184
8.5.4 The genomic impact of mobilome activation ... 186
8.5.5 Saturation mutagenesis using TE activity in embryogenic cultures ... 187
8.5.6 The epigenetic impact of transposition ... 189
8.6 Conclusions ... 191
Chapter 9 Overall Conclusions ...192
9.1 Summary of findings ... 192
9.1.1 Recently active LTR-retrotransposons in grapevine (Chapter 3) ... 192
9.1.2 S-SAP is a rapid and reliable tool for genotyping TE polymorphisms (Chapter 4) ... 192
9.1.3 Improved leaf tissue penetration by aqueous suspensions for enhanced Agrobacterium-mediated transformation (Chapter 5) ... 193
9.1.4 TE expression in response to stress treatments (Chapter 6) ... 194
9.1.5 A tagged mutant population of Pinot noir vines (Chapter 7) ... 194
9.1.6 A comprehensive assay of grapevine mobilome activity (Chapter 8) ... 194
9.1.7 The generation of new clonal material by transposon mutagenesis ... 195
9.2 Future research ... 196
9.2.1 Detailed analysis of TE insertion sites ... 196
9.2.2 What have we missed? ... 196
9.2.3 Functional genomics of mutant phenotypes ... 197
9.2.4 Generation of a saturation mutagenesis population for grapevine ... 197
9.3 Final comments ... 198
References ... 200
Appendix A Vector Diagrams...229
A.2 pART27: VvMYBA1 ... 230
A.3 LTR-Reporter fusion vectors ... 230
Appendix B Supplementary Data ...232
B.1 Alignments of grapevine LTR sequences ... 232
B.2 LTR phylogenetic trees ... 236
B.3 S-SAP comparison of multiple grape genotypes... 239
B.4 Tissue necrosis in transformed grapevine leaves ... 242
B.5 Abnormal phenotypes of vines regenerated from somatic embryos ... 243
B.6 Time and fiscal cost of complete S-SAP analyses ... 244
B.7 Whole-genome sequencing QC data ... 246
B.8 Characterisation of the insertion patterns of various grapevine TE families ... 247
Appendix C Primer Catalogue ...249
Appendix D Recipes for Plant Tissue Culture Media ...251
Appendix E Supplementary Protocols ...252
E.2 Chemically competent E. coli transformation ... 252
E.3 Electro-competent A. tumefaciens transformation ... 252
E.4 Colony PCR ... 253
E.5 Sanger sequencing ... 253
List of Tables
Table 2.1 Taxonomic division of retrotransposon superfamilies in plants, according to three recent
publications. ... 18
Table 3.1 Numbers of V. vinifera repeat sequences in Repbase by superfamily. ... 40
Table 3.2 Integrity of Ty1-Copia and Ty3-Gypsy fragments in the PN40024 grapevine reference genome. ... 41
Table 3.3 Cis-regulatory elements associated with stress or tissue-specific expression present in LTRs and 5’UTRs of five retrotransposon families ... 52
Table 4.1 Fluorescent dye modifications on S-SAP primers. ... 68
Table 4.2 Summary of capillary sequence data of recovered transposon-flanking fragments. ... 85
Table 4.3 Methylation sensitivity of monomorphic M-STD markers. ... 87
Table 6.1 Stress treatments tested on different tissue types. ... 113
Table 7.1 Total numbers of Pinot noir vines produced and the number of DNA samples collected from these. ... 147
Table 7.2 Efficiency of embryogenic callus induction from anther cultures of four grapevine clones.150 Table 7.3 Phenotypic variance among regenerated vines. ... 152
Table 7.4 Polymorphisms identified within the population of regenerants plants. ... 159
Table 8.1 Transposable elements not present in the 12X PN40024 reference genome. ... 174
Appendices Table B.1 LTR sequence similarity cladograms for V. vinifera retrotransposon families. ... 236
Table B.2 (Following page) Cost calculations for comprehensive S-SAP amplification. ... 244
Table B.3 TE families displaying an average activity of at least one new insertion per individual. ... 248
Table C.1 Record of oligonucleotide primers used in this study. ... 249
Table D.1 Ingredients for plant tissue culture media used in this study. ... 251
Table E.1 PCR reaction conditions for a colony PCR ... 253
Table E.2 Run parameters for ABI 3130xl capillary sequencer ... 254
List of Figures
Figure 2.1 Schematic representation of transposon mobility... 15
Figure 2.2 Arrangement of structural components of Ty1-Copia (A) and Ty3-Gypsy (B) LTR-retrotransposons within genomic DNA. ... 16
Figure 2.3 Structural arrangement of the mRNA intermediate of a Ty1-Copia retrotransposon. ... 19
Figure 3.1 Transcription is initiated within the LTR sequences of retrotransposons. ... 37
Figure 3.2 Ty1-Copia retrotransposon-derived sequences in the grapevine genome. ... 41
Figure 3.3 Ty3-Gypsy retrotransposon-derived sequences in the grapevine genome. ... 42
Figure 3.4 Number of complete copies for Ty1-Copia retrotransposon families in the grapevine genome. ... 43
Figure 3.5 Number of complete copies for Ty3-Gypsy retrotransposon families in the grapevine genome. ... 43
Figure 3.6 Integrity of retrotransposon-derived sequences in the grapevine genome. ... 44
Figure 3.7 Phylogenetic comparison of grapevine LTR-retrotransposon families using LTR sequence data... 44
Figure 3.8 Phylogenetic comparison of grapevine LTR-retrotransposon families using internal sequence data... 45
Figure 3.9 Organisation of grapevine retrotransposons according to previously reported clades (see Table 2.1)... 46
Figure 3.10 Phylogenetic relationships among the nine plant species used for retrotransposon sequence comparisons. ... 47
Figure 3.11 Sequence identity of 469 Ty1-Copia retrotransposons from nine angiosperm species. .... 48
Figure 3.12 Sequence identity of 296 Ty3-Gypsy retrotransposons from nine angiosperm species. ... 49
Figure 3.13 Neighbour-Joining trees of LTR insertions for four retrotransposon families ... 50
Figure 3.14 Distribution of stress-associated cis-regulatory elements (CREs) in five retrotransposon families. ... 53
Figure 3.15 Comparison of genomic copies and EST abundance for Ty1-Copia elements in grapevine. ... 53
Figure 3.16 Comparison of genomic number and EST abundance for Ty3-Gypsy elements in grapevine. ... 54
Figure 4.1 Molecular marker systems that make use of TE polymorphism. ... 62
Figure 4.2 Workflow of a sequence-specific amplified polymorphism (SSAP) experiment using fluorescently labelled probes. ... 66
Figure 4.3 Downstream S-SAP primer binding sites. ... 68
Figure 4.4 Visualisation of genomic DNA. ... 73
Figure 4.5 REMAP amplification products... 73
Figure 4.6 Inter-retrotransposon amplified polymorphism (IRAP) amplification products. ... 74
Figure 4.7 Restriction digest fragments from genomic DNA. ... 75
Figure 4.10 S-SAP pseudogel image. ... 77
Figure 4.11 The number of selective bases influences S-SAP profile complexity. ... 78
Figure 4.12 The influence of reaction variables on S-SAP profiles. ... 79
Figure 4.13 Transposon insertion profiles (S-SAP) of different V. vinifera clones and varieties. ... 81
Figure 4.14 Comparison between biotin-capture S-SAP PAGE and fluorescent tagged S-SAP pseudogel. ... 82
Figure 4.15 Re-amplification of individual S-SAP bands... 83
Figure 4.16 Sequence quality checking by chromatogram analysis. ... 84
Figure 4.17 Example of RBIP primer locations. ... 85
Figure 4.18 Amplification of four genomic DNA samples with a RBIP primer pair. ... 86
Figure 4.19 Methyl-sensitive transposon display comparison of V. vinifera genotypes. ... 87
Figure 4.20 S-SAP amplifications from material stored on FTA cards. ... 88
Figure 5.1 Penetration of organosilicone surfactant solution into leaves of nursery-grown Pinot noir vines. ... 100
Figure 5.2 Transient transformation of Sauvignon blanc leaves with different transgenes. ... 101
Figure 5.3 The effect of time and Pulse concentration on transformation efficiencies. ... 102
Figure 5.4 Other common laboratory surfactants were not found to be suitable for improving Agrobacterium-mediated transformation efficiency. ... 103
Figure 5.5 Transient transformation of nine Vitis varieties is improved by the addition of Pulse surfactant. ... 104
Figure 6.1 Location of qPCR primer binding sites (red arrows) on a complete retrotransposon transcript. Figure not drawn to scale... 116
Figure 6.2 Primer binding sites for amplification of retrotransposon 5’ LTR + 5’ UTR fragments. ... 118
Figure 6.3 RNA integrity following stress treatments. ... 122
Figure 6.4 Amplification products of the qPCR primer sets. ... 122
Figure 6.5 Relative stability of potential reference gene transcripts. ... 123
Figure 6.6 Reference gene standard curves. ... 123
Figure 6.7 Retrotransposon expression changes in EC from solid-medium cultures exposed to stress. ... 125
Figure 6.8 Expression levels of EF1α relative to Actin across stressed EC samples. ... 126
Figure 6.9 Morphological variation among embryogenic calli. ... 127
Figure 6.10 Retrotransposon expression changes in liquid-culture EC exposed to stress... 128
Figure 6.11 Expression of TEs after shock treatments in three different explant types... 129
Figure 6.12 Absolute transcript abundance normalised to reference genes. ... 130
Figure 6.13 Relative expression of EC from solid medium following yeast exposure. ... 131
Figure 6.14 Transient Agrobacterium infiltration of tobacco leaves with LTR-reporter constructs. ... 132
Figure 6.15 Expression patterns from retrotransposon LTRs in transgenic tobacco. ... 134
Figure 6.16 Transient transformation of young S. blanc leaves with LTR-GUS reporter constructs. .. 135
Figure 7.2 Non-embryogenic callus (A) derived from whole flowers and embryogenic callus (B)
derived from cultured anthers of Pinot noir UCD5. ... 149
Figure 7.3 Somatic embryos of Pinot noir from control treatments germinating after transfer to hormone-free medium. ... 150
Figure 7.4 Regenerating Pinot noir vines displaying morphological and developmental differences eight weeks after stress exposure. ... 151
Figure 7.5 Development of a Pinot noir grapevine plantlet displaying an abnormal leaf shape phenotype. ... 151
Figure 7.6 S-SAP profiles of 32 pools of DNA (five regenerated Pinot noir vines per pool). ... 155
Figure 8.1 The degree of mutation saturation (p) within a population is controlled by both population size (n) and the rate of mutation (m). ... 168
Figure 8.2 Unique insertions identified by WGS. ... 172
Figure 8.3 Unique insertions of four retrotransposon families identified by RetroSeq analysis of whole-genome sequence data. ... 173
Figure 8.4 Identification of a conserved element. ... 174
Figure 8.5 Mean number of new transposition events by TE family. ... 175
Figure 8.6 Novel transposon insertions in vines regenerated from embryogenic callus cultures. ... 176
Figure 8.7 Numbers of new insertions by genomic context. ... 177
Figure 8.8 Relative contribution of TE types to new insertions. ... 178
Figure 8.9 Total mobilome activity in the regenerated vines. ... 179
Figure 8.10 Location bias by sample. ... 180
Figure 8.11 Location bias of new insertions by transposon superfamily. ... 181
Figure 8.12 Mutation resolution decreases as population size increases (p = 0.95). ... 188
Figure 8.13 Population sizes required for saturation of the grapevine genic and CDS regions with transposable elements. ... 189
Appendices Figure A.1 Binary vector pART27:GUS/GFP ... 229
Figure A.2 Binary vector pART27: VvMYBA1 ... 230
Figure A.3 Binary vectors used for in vitro promoter analysis of LTR regions of grape retrotransposons. ... 231
Figure B. 1 Alignment of Cremant LTRs in the grapevine (PN40024) genome. ... 232
Figure B. 2 Alignment of Tvv1 LTRs in the grapevine (PN40024) genome. ... 232
Figure B. 3 Alignment of Gret1 LTRs in the grapevine (PN40024) genome. ... 233
Figure B.4 Alignment of Edel LTRs in the grapevine (PN40024) genome. ... 234
Figure B.5 Alignment of Noble LTRs in the grapevine (PN40024) genome. ... 235
Figure B.6 S-SAP profiles generated by selective amplification of multiple genotypes with Gret1 LTR primer and Mse(TG) primer. ... 239
Figure B.8 S-SAP profiles generated by selective amplification of multiple genotypes with Noble
LTR primer and Mse(TG) primer. ... 241
Figure B.9 Tissue necrosis in leaves treated with Pulse surfactant for longer periods or at higher concentrations. ... 242
Figure B.10 Quality scores across all sequenced DNA fragments. ... 246
Figure B.11 Mean quality scores per sequence read. ... 246
Acronyms
ABA abscisic acid
AFLP amplified fragment length polymorphism
ANOVA analysis of variance
BAP 6-benzyl amino purine
bp base pair(s)
CaMV cauliflower mosaic virus
cDNA complementary DNA
CDS coding DNA sequence
Cq quantification cycle
CR Centromeric retrotransposon
CRE cis-regulatory element
dH2O ultrapure water (18.2MW.cm resistivity)
DNA deoxyribose nucleic acid
dsRNA double-stranded RNA
EC embryogenic callus
EDTA ethylenediaminetetraacetic acid
EMS ethyl methanesulfonate
EST expressed sequence tag
gDNA genomic DNA
GFP green fluorescent protein
GM genetically modified
GUS ß-glucuronidase
HRM high-resolution melt
IRAP inter-retrotransposon amplified polymorphism
kb kilobase pairs
LTR long terminal repeat
LINE long interspersed repetitive element
MCS multiple cloning site
MITE miniature inverted-repeat transposable element
mRNA messenger RNA
NGS next-generation sequencing
NOA β-naphtoxyacetic acid
NTC no template control
ORF open reading frame
PAGE polyacrylamide gel electrophoresis
PBS primer binding site
PCR polymerase chain reaction
PPT polypurine tract
PR pathogenesis-related
qPCR quantitative PCR
RAPD rapid amplification of polymorphic DNA
RdDM RNA-dependant DNA methylation
rfu relative fluorescent units
RISC RNA-induced silencing complex
RITS RNA induced transcriptional gene-silencing
RNA ribose nucleic acid
RNAi RNA interference
S-SAP sequence-specific amplified polymorphism
SCAR sequenced characterized amplified region
SD standard deviation
SE somatic embryo or standard error
siRNA small interfering RNA
SNP single nucleotide polymorphism
SSLP simple sequence length polymorphism
SSR simple sequence repeat / microsatellite
ssRNA single-stranded RNA
T-DNA transfer DNA
TBE buffer tris(100mM)-borate(90mM)-EDTA(1mM) buffer
TE transposable element
TE buffer tris(10mM)-EDTA(1mM) buffer
TIR terminal inverted repeat
Tm melting temperature
tRNA transfer RNA
TSS transcription start site
UTR untranslated region
UV ultraviolet
Chapter 1
Introduction
1.1
The economic importance of viticulture
“Quickly, bring me a beaker of wine, so that I may wet my mind and say something clever.”
- Aristophanes, circa 400 BC
Fossilised seeds found in Oregon, USA and genetic evidence of polyploidisation events date the
appearance of grapevines to approximately 50-60 million yeas ago (CHEN AND MANCHESTER 2007;
MALACARNE et al. 2012). Today, the wild grapevine, V. vinifera ssp. sylvestris, is rare and sparsely
distributed from the Atlantic coast of Europe to the Western Himalayas (GRASSI et al. 2008). Habitat
disruption and susceptibility to New World pathogens such as Phylloxera have led to a severe
reduction in distribution. In 2000 wild grapevine was recognised as critically endangered and as a
result is now protected in several European states (GRASSI et al. 2006).
In contrast, through a particularly successful history of agriculture and trade spanning the past six
millennia, the modern Eurasian grapevine (Vitis vinifera ssp. sativa) has risen to become the world’s
most abundant and economically important fruit crop (www.fao.org). The separation of these two
lineages is believed to be the earliest example of the domestication of a fruit-bearing plant.
Genetic analysis of modern grape varieties indicates that domestication occurred on at least two
occasions (ARROYO-GARCÍA et al. 2002; GRASSI et al. 2003), at a similar time and place to the invention
of wine (MCGOVERN 2003). The earliest evidence of viniculture was revealed by the chemical analysis
of Neolithic pottery uncovered at Hajji Firuz in the northern Zagros Mountains of Iran. Fragments of
jars were found to have traces of tartaric acid, a compound only naturally abundant in grapes. Also
present on the shards was Pistacia tree resin, which is soluble in ethanol and would have been added
as a preservative, precluding that the remains are from accidentally fermented grape juice. The jars
were dated to approximately 5400 BC (MCGOVERN et al. 1996).
With time, grapevine cultivation spread across the Middle East and to nearby Egypt (MCGOVERN et al.
2009; BARNARD et al. 2011). Ancient civilizations including the Assyrians, Phoenicians, Greeks and
Romans planted vineyards first around the temperate Mediterranean and then across Europe,
following the major trade routes (THIS et al. 2006). Trade between Europe and Asia via the Silk Road
grapevine seeds to the Americas in the 16th century and immigrants took cuttings to South Africa and
Australia in the 19th century, accomplishing the grapevine’s spread to all six inhabited continents
(THIS et al. 2006).
At the end of the nineteenth century Italian-born viticulturist Romeo Bregato was commissioned by
the New Zealand Department of Agriculture to assess the potential for domestic wine production
(BRAGATO 1895). The recommendations of his report were used to build an industry that now spans
the country, with a current annual production of 178.9 million litres, valued at USD 950 million (2012
data; www.nzwine.com). Although current industry trends show a decrease in European production,
New World production continues to show rapid growth, with the 2012 national yield a record in both
New Zealand and China (www.oiv.int).
1.2
The value of cultivar identity
At the point of sale, consumers are not usually able to directly determine the quality of a wine
before purchase (i.e. by tasting). Therefore, purchase decisions are based on indirect indicators
of wine quality. In European markets, the region of origin is typically found to be among the
most significant indicators of wine quality, while in New World markets grape variety frequently
scores highly (ARIAS-BOLZMANN et al. 2003; SCHAMEL AND ANDERSON 2003; MCCUTCHEON et al.
2009). The distinction is supposed to be a legacy of European appellations known for
production of wines of a certain style. In contrast, the marketing strategies of emerging wine
industries have primarily focused on variety and brand.
The grape variety used to produce a given wine is therefore one of the premier labels by which
wine producers communicate product quality to potential buyers. In addition to maintain the
market value of familiar varieties, clonal propagation of vine material ensures predictability and
consistency in plant growth and development. It is unsurprising therefore that the vast majority
of currently cultured grapevines represent only a few of the approximately eight thousand
varieties known to exist (ALLEWELDT AND POSSINGHAM 1988). The value of clonal propagation of
vines has been so established for so long that the crosses that produced the popular Cabernet
Sauvignon and Chardonnay varieties are believed to have occurred during the medieval period
(BOWERS AND MEREDITH 1997; BOWERS et al. 1999).
1.3
Limited diversity within varieties
As an entire species, modern grapevine is comparable in diversity to crops such as maize (MYLES
et al. 2011). However, due to a uniquely long history of vegetative propagation, the genetic diversity within the relatively few varieties utilised for commercial wine production is very
with interesting and desirable characteristics, any progeny will lack the historical pedigree, and
therefore the brand recognition, of the famous varieties. Despite the thousands of registered
grapevine varieties that currently exist, only a select few are grown for wine production,
evidence that the wine industry is not lacking for new varieties. Any genetic improvement must
therefore come from within the established popular varieties to be considered for industry
acceptance.
1.4
Exploiting natural genetic variation
After a visit to the Sancerre region of France in 2008, New Zealand-based viticulturists Rod Bonfiglioli
& Nick Hoskins commented on the advantages that continuous evaluation of new clonal material
provides to the French wine industry (BONFIGLIOLI AND HOSKINS 2008). They went on to point out the
noticeable absence of such strategies in New Zealand.
The Bonfiglioli & Hoskins report draws attention to a history of successful genetic improvement
by certain members of the international wine industry in the form of novel clones of existing
varieties. Such clones are the result of DNA mutations occurring in the growth apices of a vine.
As the plant grows, portions of the vine containing the new mutation may appear atypical to be
of the parental clone. When identified, this material can be collected and propagated by shoot
cuttings. With very few exceptions, identification of these ‘bud sports’ in vineyards and
nurseries has been the sole source of new clones for the wine industry. The extensive use of
bud sport-derived clones in commercial settings is evidence of the value of this source of
genetic variation.
Centuries ago, a mutant form of a single grapevine gene produced a sport incapable of
producing anthocyanin, the purple-red pigment typical of ripe wild grape berries (KOBAYASHI et
al. 2004). Consequently, the ripe berries of such a vine can be used to make white wine. This
specific mutation has to date been found in all white grape varieties tested (WALKER et al. 2007).
The proliferation of this ancestral allele is an example of the profound effect that selective
bud-sport propagation has had on our modern conceptions of wine styles.
1.5
Tracking and increasing mutation rates
In contrast with breeding crosses, which shuffle the hereditary material of two parent
organisms, bud sport mutations entail a specific change, generally leaving the remainder of the
genome unaltered. A vine produced from a cross between Pinot noir and Sauvignon blanc, for
example, will exhibit an amalgam of traits inherited from both parental types. A bud sport,
offers the potential for genetic improvement while maintaining varietal identity, such as a
Sauvignon blanc vine with reduced growth vigour.
Unfortunately, natural rates of somatic mutation are difficult to track and identify, particularly
when the resulting changes are subtle or not apparent. Vegetative material that acquires a
mutation conferring resistance to a pathogen or abiotic stress to which the vine is not exposed
in the same season will likely be pruned off and lost.
Therefore, techniques to accelerate and track the rate of bud sport mutations in grapevine are
essential for the production of a resource of new clonal material. A collection of clonally
propagated grapevine plants possessing a variety of new somatic mutations would provide a
valuable resource to fast-track genetic improvement initiatives and addresses the shortage of
genetic variation available to New Zealand winegrowers.
1.6
Hypotheses to be tested
The ideas pursued in the course of this research project can be expressed as the following distinct
hypotheses:
1.6.1
H1: The grapevine genome reveals differences among the historical
activity of transposon families
Large proportions of eukaryotic genomes have been found to be comprised of repetitive DNA, the
majority of which is derived from endogenous mobile DNA sequences known as transposable
elements (discussed in section 2.2). This is true of the grapevine sequence published in 2007 (JAILLON
et al. 2007; VELASCO et al. 2007). The public availability of whole-genome draft sequence assemblies
and computational tools for searching these data enables in silico approach to characterise the
integrity and sequence similarity of elements from defined TE families.
The corresponding null hypothesis is:
H0-1: No evidence can be found for differences in the historical activity of transposon families within
the grapevine genome sequence data.
1.6.2
H2: Transposon insertion polymorphisms contribute to clonal
variation in grapevines
Anecdotal accounts of high phenotypic variance within clonal vineyards are common among
winegrowers, particularly within certain varieties. While some phenotypic changes have been
mutations caused by TEs (KOBAYASHI et al. 2004; FUJINO et al. 2005; MOON et al. 2006; FERNANDEZ et al.
2010; FERNANDEZ et al. 2013).
The testable null hypothesis is:
H0-2: Phenotypically different vines grown from vegetative material have identical TE insertion
patterns.
1.6.3
H3: The insertion patterns of specific TE families can be used to
track genetic variation in grapevine
Known transposon sequences can be used as tags for insertion mutations. Such a tagged
mutagenesis approach simplifies genotyping and genomic characterisation of mutants. In order to
demonstrate this, it is necessary to determine the genomic loci of individual TE polymorphisms.
The null hypothesis is:
H0-3: Differences between TE insertion profiles cannot be associated with the presence or absence of a
single TE insertion at a specific locus in the genome.
1.6.4
H4: TEs in grapevines are activated under stress conditions
Most transposable elements contain nucleotide sequences that are common to the regulatory
regions of stress response genes. The hypothesis is therefore put forward that exposing plant
tissue to certain stress conditions will increase the relative abundance of transcripts from these
elements. The null hypothesis to be tested in this case can be stated as:
H0-4a: Transcript levels of grapevine LTR-retrotransposons are not altered by environmental
stress events.
As the nucleotide sequences, and therefore the cis-regulatory elements present, differ between
the various retrotransposon families, the response to the stress events may not be identical
among families.
Transcription of TE insertions may trigger epigenetic changes to the genome. However, reverse
transcription of the RNA and successful insertion at a new locus is necessary for novel genetic
mutations to occur. Confirmation that this complete process has occurred would involve
disproving the following null hypothesis:
H0-4b: Multiple grapevine plants regenerated from the same stressed tissue have identical TE
1.6.5
H5: An in silico analysis of TE-related sequences in the genome
enables prediction of the most mutagenic element families
Computational approaches are used to determine retrotransposon targets for marker and transcript
analysis, based on evidence of recent mobilisation. However, whole-genome sequencing allows an
unbiased analysis of TE mobilisation in mutant plants, allowing verification of whether those TE
families for which evidence of recent activity is found are in fact accountable for the highest number
of novel mutations.
The null hypothesis is:
H0-5: The current mutagenicity of grapevine TE families cannot be linked to predictors of recent
historical TE activity within the grapevine genome sequence data.
1.6.6
H6: Mobilisation of endogenous retrotransposons can be used to
produce phenotypically varied grapevine plants.
Genetic variation introduced by transposon mobilisation can be detected using molecular techniques
at the earliest stages of plant development. Mutations of economic interest to the grape industry,
however, are those that contribute to altered plant growth and development. These can only be
confirmed as the plants mature.
The applicable null hypothesis in this case can be stated as:
H0-6: It is not possible to identify distinct phenotypic abnormalities in a population of grapevines
Chapter 2
Literature Review
2.1
Mutations in vegetative tissue result in chimeras
2.1.1
Sexual reproduction in agriculture
The production of gamete cells involves a special type of cell division (meiosis) in which the genetic
material is shuffled and reduced by half. The full genetic complement is then restored by the
conjugation of gametes from two parents. Due to the scope of possible permutations during meiotic
division of the genome, offspring produced in this way are genetically distinct from one another and
both parents. The vast majority of genetic variation between individuals within most populations is
therefore a direct result of sexual reproduction.
In agriculture, propagation via sexual recombination is frequently used for grain, vegetable and
oriental crops. Thousands of seeds can be collected from the best plants and stored for future
plantings. This allows a rapid increase in crop size within a few generations. Seed is an ideal tissue
type for plant propagation as it is specifically adapted to protect hereditary material for long periods
of time, and germinate when conditions are suitable.
Sexually propagated crops may have undergone thousands of rounds of reproduction in the history
of their domestication (ZOHARY 2004). At each stage, the population is subject to what Charles Darwin
termed the “unconscious selection” of the environment (DARWIN 1870) as well as a conscious
selection by the collector of the seed. Consequently, such crops have continuously evolved since
their initial domestication and usually appear very different to their wild relatives.
2.1.2
Vegetatively propagated crops
Sexual propagation has, however, multiple disadvantages for agriculture. Although recombination
events improve the efficiency of selection by removing negative correlations between favourable
alleles (BARTON AND CHARLESWORTH 1998), they also break down linkage between co-adapted genes
(RICE 2002). In addition, the genomes of certain crops, such as fruit trees, are highly heterozygous
(SCALABRIN et al. 2010). Seeds collected from crosses of such crops will mostly produce progeny that have no economical value.
Many plant species, such as grapevine, are capable of the asexual reproduction of whole new
continuous collection and planting of cuttings, farmers can fill their lands with genetically identical
plants. Without the variation introduced by sexual crosses, the genetic material remains far more
consistent between individuals and generations. The stability of plant growth and development is
desirable for the optimisation of farming practices and for predictable crop yield and quality. It has
been argued that the adoption of vegetative propagation techniques was an essential step in the
development of successful fruit tree agriculture (ZOHARY AND SPIEGEL-ROY 1975).
2.1.3
Somatic mutations
During the lifetime of an organism, a precise copy of the full genome needs to be made at every cell
division. Despite the high fidelity of the DNA polymerase enzymes responsible for this task – single
base error rates are just 10-5 to 10-6 (B
RITT 1999) – errors are nevertheless inevitable at the scale of
whole genomes. Additionally, DNA suffers damage from environmental and chemical factors such as
ultraviolet (UV) radiation and free radicals produced by cellular metabolism.
Due to their sessile nature and to facilitate photosynthetic production of organic compounds,
autotrophic plants endure a particularly high exposure to solar radiation. The ozone and oxygen in
the Earth’s atmosphere prevents penetration of high-energy UV-C radiation. However, UV-B
radiation reaches the biosphere and is able to penetrate organic tissue. Absorption of UV-B by DNA
results in lesions and dimer production between adjacent pyrimidine residues, the most common of
which are cyclobutane pyrimidine dimers (CPDs) (JORDAN 2002).
Incorrect DNA repair can result in a variety of different mutation types. Base mismatches produce
single nucleotide polymorphisms (SNPs) which can alter the sequence of genes, cause polypeptide
strands to stop prematurely and interrupt sequence-specific DNA-protein interactions. Large scale
genome rearrangements can arise from sequence insertions, deletions, and cross-linking between
strands (BRAY AND WEST 2005). Without correction, mutations will be propagated through subsequent
cellular replication cycles, becoming stable.
Since the germ-line tissue comprises a relatively small proportion of an organism, most mutations
will occur in somatic tissue. For this reason somatic mutations do not generally affect sexually
propagated offspring, and therefore do not normally contribute to the gene pool. However, the
propagation of plants by cuttings stabilises somatic mutations in future generations. Somatic
mutations therefore have significant impact in vegetatively propagated plant populations.
2.1.4
Chimerism of vegetative propagules
The meristem of most dicotyledonous plants is divided into 2-3 layers, which are separately
internal tissues from L2 and L3. Grapevine meristem consists of two layers, which can be genetically
different (THOMPSON AND OLMO 1963). Mutations that occur in one cell layer of the meristem
therefore only persist in tissue produced from this layer (FERNANDEZ et al. 2006). Seed are produced
exclusively from the L2 layer, whereas vegetative propagation preserves the separation of the cell
layers (BERTSCH et al. 2005). As somatic mutations accumulate over time, the two layers of the
vegetative tissue become more diverse (FRANKS et al. 2002; RIAZ et al. 2002; HOCQUIGNY et al. 2004).
The stable existence of two genetically different cell layers in a plant is known as periclinal
chimerism, a state which appears to be common among elite grapevine varieties (RIAZ et al. 2002;
PELSY et al. 2010). Periclinal chimerism is important to the phenotype of several important varieties. The red-grey colour of the berries of Pinot gris, for example, is the result of a mutation preventing
pigmentation in only the inner cell layer of the berry skin, produced from L2 meristem. The mutation
is not present in the L1 meristem, which forms the pigmented outer layer of the berry skin. All
progeny of self-crossed Pinot gris plants produce only white fruit, while plants regenerated from the
L1 cell layer produced black fruit (PELSY 2010).
Chimeric genotypes have been separated by passage of the clone through somatic embryogenesis.
Franks and colleagues (2002) regenerated vines from somatic embryos of the Champagne variety
Pinot Meunier, a chimeric bud sport of Pinot noir. Regenerants were genotyped using a
microsatellite marker for which the chimeric Pinot Meunier produces three alleles. All regenerated
plants could be separated into two distinct genotypes, each with only two alleles at the tested locus.
Plants of one group were both genetically and phenotypically indistinguishable from Pinot noir, while
those of the other genotype displayed a novel dwarf phenotype with short internode lengths and
hairy leaves.
2.1.5
Grapevine genetic improvement strategies
As the wine industry continues to grow and be challenged by the demands of new markets, major
goals for genetic improvement remain (VIVIER AND PRETORIUS 2002). Viticulture has a long history of
the use of somatic mutations for the step-wise development of elite clones within important
varieties. Nevertheless, this approach also has serious disadvantages. Selecting plants based purely
on phenotype means that subtle and invisible changes are likely to never be identified. Mutants are
likely to appear as chimeras, affecting only a fraction the plant tissue. Additionally, the low natural
rates of somatic mutation mean that interesting sports are usually chance identifications by
Breeding strategies
Breeding programs are a staple of crop improvement strategies (for review see (VARSHNEY et al. 2005;
MOOSE AND MUMM 2008; TESTER AND LANGRIDGE 2010) and can be used to exploit the diversity between
grapevine cultivars. However, they require large populations and multiple generations to overcome
the random linkage disequilibrium between loci in the genome (FELSENSTEIN 1974). Grapevine
breeding programs are particularly slow and expensive, due the long generation times, annual
reproductive cycle and vineyard management and space requirements of the crop (CHAÏB et al. 2010).
Finally, as mentioned (see 2.1.2) progeny produced from crosses between varieties lose the value of
varietal identity, and show very high variation due to the heterozygosity of the parents.
Transgenesis
The value of introducing or silencing specific genes in an otherwise stable genetic background has led
transgenesis to become an essential tool in the field of functional genomics. Successful use of
transgenesis for the improvement of various crop species has resulted in sustained optimism towards
the genetic improvement of grapevine (ALLEWELDT AND POSSINGHAM 1988; VIVIER AND PRETORIUS 2002;
VIDAL et al. 2010).
Although simple and elegant as a theoretical technique, grapevine transformation has multiple
technological limitations. No technique has yet been reported for the initiation and maintenance of
appropriate explant cultures from all grapevine varieties. Additionally, transformation experiments
generally report low efficiencies and can be complicated by chimerism of regenerated plants. These
factors, together with the long generation times required for full characterisation of transgenic vine
phenotypes, have made the technique slow and problematic in practice.
Furthermore, environmental and ethical concerns have restricted the uptake of genetically modified
(GM) crops for agriculture. The first field trials of transgenic vines were set up in 1996 in the
Champagne vineyards of Moêt & Chandon by the French Institut National de la Recherche
Agronomique (INRA). The project showed that certain transgenic rootstock lines expressing the
grapevine fanleaf virus (GFLV) coat protein gene proved resistant to GFLV infection (VIGNE et al.
2004). However, increased public antagonism towards GM crops, and opposition to this study in
particular, resulted in the early termination of the field trials.
Nevertheless, INRA decided to proceed with further expanded field trials of transgenic rootstocks.
Prior to initiation, a local monitoring committee comprised of representatives of the research team,
local public councils and the winegrowing profession assessed the trial protocol. Since the local
winegrowing profession region refused to allow GM plants to be trialled within the perimeter of
Alsace vineyards, the project had to be conducted at the INRA centre in Colmar. Two hundred public
eventually initiated, the vines were destroyed by activists on two occasions, and INRA was finally
forced to abandon the research (LEMAIRE et al. 2010).
Despite widespread public and industry controversy regarding GM vines, the technology has had
some traction. In the period up until 2010, 66 transgenic grapevine field trials were conducted
worldwide, but only seven of these were performed in Europe (www.gmo-compass.org).
Saturation Mutagenesis
While transgenesis involves the production of a few plant lines with very specific genomic changes,
an alternative approach is to create large plant populations with random mutations. With the
production of sufficiently large populations, an individual harbouring a mutation in almost any gene
can expect to be found. This technique, known as saturation mutagenesis, has been used been used
with great success both in functional genomics studies and for crop improvement. Chemical
mutagens, most commonly ethyl methanesulfonate (EMS) (KOORNNEEFF et al. 1982), and fast neutron
irradiation (LI et al. 2001) have both been successfully used in plant systems. Radiation mutagenesis
experiments were particularly popular in the 1950s as part of the “Atoms for Peace” program in the
United States, which sought to establish peaceful uses for atomic energy. But as the political
incentive to use radiation has decreased EMS mutagenesis has become more common. However, the
random nature of these types of mutagenesis means that the identification of mutation alleles is not
a trivial task.
The successful use of EMS and radiation mutagenesis has been well-established, contributing to the
understanding of such crucial plant systems as flowering (MICHAELS AND AMASINO 1999), herbicide
resistance (JANDER et al. 2003) and UV-B response (FAVORY et al. 2009). The advantages of SNP
mutagenesis lie in the broad applicability of the techniques to any species, the improved
identification of mutant loci by the addition of the TILLING technique (MCCALLUM et al. 2000) and an
abundance of genotyping approaches (KWOK 2001).
Since the mid 1980s, the pathogenic bacterium Agrobacteriumtumefaciens has been co-opted for
the transformation of a variety of cultivated plant species (HORSCH et al. 1985; GELVIN 2003). During
infection of plant host cells, A. tumefaciens transfers a small section of DNA, known as transfer DNA
(T-DNA) into the host nucleus to be incorporated into the host genome. Insertion of the T-DNA
causes disruption of the sequence at random sites in the host genome. The process of T-DNA
insertion can therefore be used as a mutagenic tool. While large sequence insertions are more likely
to have an impact on the genome than SNPs caused by radiation, the real advantage of this
technique is that the foreign T-DNA sequence introduces a unique tag by which mutation sites can be
large-scale saturation mutagenic studies, most notably in Arabidopsis thaliana (ALONSO et al. 2003) and rice (JEON et al. 2000).
Recently, transposable elements (TEs) have been used for saturation mutagenesis. These repetitive
genetic sequences are defined by their capacity to mobilise and produce mutations within a genome.
Although most of TEs are silent within their host genome, their activity is often not supressed when
they are transplanted into the genome of a different species. Moreover, the mobility of certain
non-autonomous elements depends on the expression of genes from non-autonomous TEs. Co-transformation
with a non-autonomous TE and the auxiliary genes of an autonomous element can be used generate
mutations in a target genome. The auxiliary genes can then back-crossed out to halt the transposon’s
mobility, while preserving any novel mutations (LISCH 2002). TEs have recently been used to develop
2.2
Transposable Elements
“Only a decade ago, most scientists thought humans had about 100,000 genes”
- Francis S. Collins, Oct 2004 (Director, National Human Genome Research Institute)
With over 180 eukaryotic genomes now fully sequenced, the sparseness of genes found per genome
has come as a surprise to the scientific community. Before the human genome was fully sequenced,
most professional estimates were that there existed in the order of 100,000 to 150,000 genes. The
current count of known protein-coding genes stands at 20,769 (www.ensembl.org/Homo_sapiens,
retrieved 18th Oct 2013), the exons of which represent approximately 1% of the total genome
sequence (COFFEY et al. 2011). However, since having been famously labelled “Junk DNA” four
decades ago (OHNO 1972), an appreciation for the importance of non-coding regions of the genome
has progressively increased.
In 1948, Barbara McClintock described the activities of two unusual loci in the maize genome.
Following a series of breeding experiments, she reported the instability of genes that produce
pigmentation in the aleurone layer of kernels. She noted that frequent chromosome breaks at the
Dissociation (Ds) locus on the short arm of chromosome 9 were responsible for chimeric patches of
colour loss in maize kernels. Furthermore, she showed that sequence changes at the Ds locus were
not only heritable, but reversible, and under the control of a second ‘controlling element’, which she
named Activator (Ac) (MCCLINTOCK 1948; MCCLINTOCK 1951). Though she had been the first to produce
a genetic map of maize, she realised when trying to map the location of these new loci that they
could not consistently be located on the same chromosome (MCCLINTOCK 1950). Despite having
received recognition for her previous cytogenetic research, McClintock struggled to convince her
peers of the activity of controlling elements and consequently stopped publishing her data.
As recent technologies have rapidly accelerated the mapping and sequencing of whole genomes,
McClintock’s unstable genetic sequences have been proved ubiquitous, accounting for large
proportions of non-coding DNA in eukaryotes. They are now known as transposable elements (TEs)
or transposons, for their characteristic ability to change location within the genome, a process called
transposition. A strong correlation exists between the proportion of transposable elements within a
genome and the size of that genome (r=0.99; (TENAILLON et al. 2010). Arabidopsis thaliana cv.
Columbia, with a genome of approximately 125Mb, for example, consists of approximately 10% TEs (ARABIDOPSIS GENOME INITIATIVE 2000), whereas over 85% of the 2.3Gb maize genome is made up of
In 1983, McClintock’s work regarding the discovery of TEs was finally recognised with the
presentation of that year’s Nobel Prize for medicine, the only occasion that a woman has won the
prize unshared.
2.2.1
Transposon types
Transposable elements are classified according to the presence and arrangement of their functional
sequences (WICKER et al. 2007).
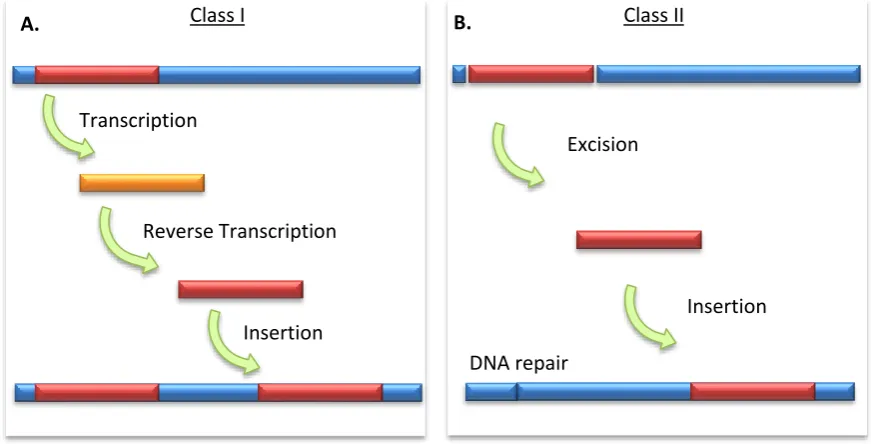
Class I: Retrotransposons
The class I elements (retrotransposons) consist of those elements whose mobilisation involves the
production of an RNA intermediate, which is then reverse-transcribed to produce a new DNA copy
(Figure 2.1 A). This “copy-and-paste” process results in an increase in the size of the host genome.
The class includes elements that are flanked by identical long terminal repeats (LTR
retrotransposons) as well as non-LTR retrotransposons. The non-LTR retrotransposons are further
classed as either long interspersed repetitive elements (LINEs) or short interspersed repetitive
elements (SINEs).
The LINEs are similar in structure to the internal portion of LTR-retrotransposons, with the same
basic gene arrangement, but lacking flanking repeat sequences. Their sequence diversity suggests
that LINEs may have been ancestral to the LTR-retrotransposons (XIONG AND EICKBUSH 1990). The
much smaller SINEs are descendant of RNA polymerase II products, such as transfer RNA (tRNA),
which have acquired the ability to be reverse transcribed and re-integrated into the genome by the
Figure 2.1 Schematic representation of transposon mobility. (A) Transposition of a class I element via an RNA intermediate. (B) Transposition of a class II element via a DNA intermediate.
Class II: DNA transposons
The characteristic structure of a DNA transposon includes a single open reading frame, flanked by
terminal inverted repeats (TIRs). Unlike retrotransposons, DNA transposon mobility generally
involves the complete excision of the element, followed by reinsertion elsewhere in the genome
(Figure 2.1 B). A single transposase gene controls the autonomous mobility of class II TEs. No RNA
intermediate is produced and this “cut-and-paste” mobilisation does not generally increase the
genome size (KUNZE et al. 1997). The exceptions to this rule are the Helitron and Maverick
superfamilies of Class II TEs, whose unusual mobilisation does result in a copy number increase
(KAPITONOV AND JURKA 2007; PRITHAM et al. 2007).
The class number of a given element type is therefore indicative of the number of DNA strands that
are cut at the donor site during transposition. Ten to seventeen defined superfamilies of class II
transposon have been described, of which five (CACTA, hAT, Mutator, PIF/Harbinger, and
Tc1/Mariner) have been found in plant genomes (FESCHOTTE AND PRITHAM 2007; YUAN AND WESSLER 2011).
Apart from full-length DNA transposons, miniature inverted-repeat transposable elements (MITEs)
are also present in eukaryotic genomes. These short, highly repetitive sequences are characterised
by TIRs without internal gene-coding sequences. They are believed to derive from class II elements
that have suffered internal deletions, and are therefore incapable of autonomous transposition
(FESCHOTTE AND MOUCHES 2000).
Transcription
Reverse Transcription
Insertion
A. Class I
Excision
Insertion
B.
DNA repair