Uniform grain-size distribution in the active layer of a
shallow, gravel-bedded, braided river (the Urumqi River,
China) and implications for paleo-hydrology
Laure Guerit1, Laurie Barrier2, Youcun Liu3, Clément Narteau2, Eric Lajeunesse2, Eric Gayer2, and François Métivier2
1GET, Université de Toulouse, CNRS, IRD, UPS, Toulouse, France
2Institut de Physique du Globe de Paris – Sorbonne Paris Cité, Université Paris Diderot, CNRS, UMR 7154, Paris, France
3School of Resources and Environmental Engineering, Jiangxi University of Science and Technology, Ganzhou 341000, China
Correspondence:Laure Guerit (laure.guerit@get.omp.eu) Received: 22 May 2018 – Discussion started: 13 June 2018
Revised: 17 September 2018 – Accepted: 21 October 2018 – Published: 7 November 2018
Abstract. The grain-size distribution of ancient alluvial systems is commonly determined from surface samples of vertically exposed sections of gravel deposits. This method relies on the hypothesis that the grain-size distri-bution obtained from a vertical cross section is equivalent to that of the riverbed. Such an hypothesis implies first that the sediments are uniform in size in the river bed, and second that the sampling method implemented on a vertical section leads to a grain-size distribution equivalent to the bulk one. Here, we report a field test of this hypothesis on granulometric samples collected in an active, gravel-bedded, braided stream: the Urumqi River in China. We compare data from volumetric samples of a trench excavated in an active thread and from surface counts performed on the trench vertical faces. Based on this data set, we show that the grain-size distributions obtained from all the samples are similar and that the deposit is uniform at the scale of the river active layer, a layer extending from the surface to a depth of approximately 10 times the size of the largest clasts. As a con-sequence, the grid-by-number method implemented vertically leads to a grain-size distribution equivalent to the one obtained by a bulk volumetric sampling. This study thus brings support to the hypothesis that vertical surface counts provide an accurate characterization of the grain-size distribution of paleo-braided rivers.
1 Introduction
The size of the river-bed sediment and its spatial distribution result from transport and deposition mechanisms in alluvial systems. These mechanisms have been intensively studied to model fluvial behavior and landscape evolution (Wilcock and McArdell, 1993; Paola and Seal, 1995; Vericat et al., 2008; Piedra et al., 2012; Sun et al., 2015), and the tempo-ral variations in grain-size distributions can be used to re-construct paleo-environments or changes in tectonic and cli-matic conditions (Duller et al., 2010; Whittaker et al., 2011; Michael et al., 2014; Schlunegger and Norton, 2015; D’Arcy and Whittaker, 2016; Chen et al., 2018). For such
Figure 1.Example of a shallow, gravel-bedded, braided river dur-ing the dry season (Urumqi River, China). Spatial variations in grain size can be observed at the surface of the riverbed with finer- and coarser-grained areas.
In alluvial gravel systems, sediments can experience strong spatial variations in size. Downstream fining, which results from abrasion and preferential deposition of coarse particles, dominates the large-scale evolution of granulome-try along a river path (Parker, 1991; Paola and Seal, 1995; Singer, 2008; Rice and Church, 2010). This preferential de-position of the coarse grains, together with the removal of fine grains by winnowing during low flows, can be responsi-ble for the formation of a coarse layer, or armor, at the sur-face of the bed (Parker and Klingeman, 1982; Church et al., 1987; Wilcock and McArdell, 1993; Mao et al., 2011). This layer generally forms at the reach scale (i.e., at the scale of the whole riverbed, from several dozens to several hun-dreds of meters), although it is not always observed (Laronne et al., 1994; Laronne and Shlomi, 2007; Storz-Peretz and Laronne, 2013b, 2018). In addition, local (from a meter to a few tens of meters) trends in grain size are observed at the scale of the morpho-sedimentary elements (e.g., the bars, anabranches, and chutes for braided rivers) that built the riverbed with coarser or finer grained patches (Fig. 1; Bluck, 1971; Smith, 1974; Milne, 1982; Lisle and Madej, 1992; Ashworth et al., 1992; Laronne et al., 1994; Laronne and Shlomi, 2007; Guerit et al., 2014; Storz-Peretz et al., 2016). As a consequence, two different features of granulometric sorting can occur at a given location along a stream: (1) a ver-tical evolution at the reach scale with a surface layer (the first centimeters of the bed deposits, often scaled with the larger grains) coarser than what is below (the subsurface layer), and (2) local lateral variations associated with the morpho-sedimentary elements.
However, recent experimental findings suggest that the granulometry of gravel-bedded, braided streams might be uniform above a given scale. Indeed, over a hydrological season, grains actively involved in transport and deposition
are contained within the active layer of a riverbed. Using a physical model of braided streams, Leduc et al. (2015) show that this layer extends laterally over the whole riverbed and that its thickness corresponds to the maximum difference in bed elevation measured in the cross section on the surveyed reach. They also observe that the active layer scales with the largest clast of the bed and extends over a thickness closed to 10D90(the 90th percentile of the grain-size distribution). Based on the spatial organization of deposits with different calibers, a few experimental studies show that the sediments are well mixed in the active layer, and thus suggest that the grain-size distribution of gravel-bedded, braided rivers is uni-form at the scale of the active layer (Gardner and Ashmore, 2011; Leduc et al., 2015; Gardner et al., 2018). However, such an analysis has not yet been performed on natural rivers. The first aim of this study is therefore to investigate the gran-ulometric uniformity of this active layer of a gravel-bedded, braided river, which is a prerequisite for a relevant paleo-grain-size sampling.
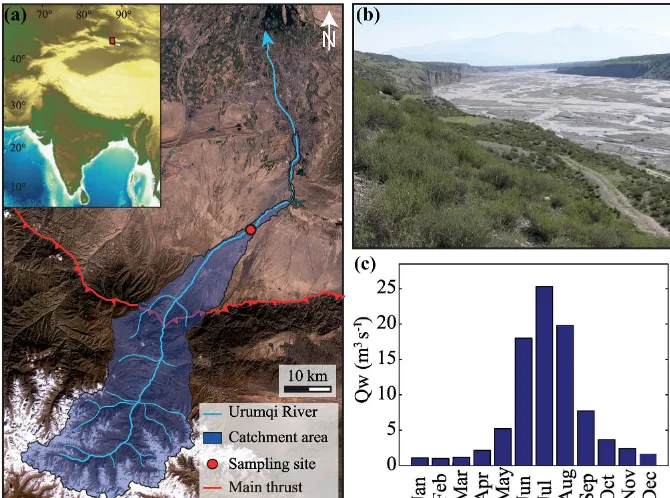
Figure 2.(a)Location, drainage network, and catchment area of the Urumqi River system,(b)picture of the river at the sampling site during the high flow season (the channel is∼300 m wide), and(c)annual hydrograph of the river (after Zhou et al., 1999).
Accordingly, we present a granulometric study on the Urumqi River, an active braided river in China. First, we describe the methodology implemented to sample the grain-size distributions by volumetric sieving and vertical surface counts. Then, based on a large data set, we show that despite local heterogeneities probably associated with the morpho-sedimentary elements of the riverbed, the grain-size distri-bution of the sediments is uniform at the scale of the active layer. In addition, we observe that the distribution obtained by vertical surface counts is similar to the bulk granulome-try of the riverbed. This study thus shows that quantitative information about the granulometry of paleo-rivers can be accurately derived from surface counts along vertical con-glomeratic outcrops.
2 Sampling site
The Urumqi River is a shallow (<1 m deep), gravel-bedded, braided river draining the northern side of the Tian Shan range in China (Figs. 1 and 2a–b). This river initiates at the front of a glacier in the high range at 3600 m and runs north-wards to the Junggar Basin, where it dies out into the desert at an elevation of 1100 m. The sediments sampled in this study are located about 10 km downstream of the mountain topo-graphic front. There, the Urumqi River braids within an allu-vial valley cut into the deposits of a Pleistocene alluallu-vial fan (Zhou et al., 2002; Guerit et al., 2016; Fig. 2a–b). At this lo-cation, the catchment area of the river is close to 1000 km2,
Figure 3. Transverse topographic profiles acquired along the Urumqi River bed. Elevation (z) is given as the deviation from the mean bed elevation at each cross section.
(a) (b)
(c) (d)
Figure 4. View(a)from the north and(b) from the west of the 7.2 m long and 1.2 m wide trench. In this second view, the sampling nomenclature is indicated. Layers are colored from red to yellow and labeled from 1 to 5, whereas columns are colored from light to dark blue and labeled from A to F. Panels(c)and(d)show an implementation of the vertical surface counts along the trench walls with a node every 20 cm.
To estimate the thickness of the active layer of the Urumqi River, we acquired five transverse topographic profiles across the riverbed with a Trimble S6 DR300+total station with a point every meter on average. Differences in elevation be-tween the highs and the lows of the riverbed are on the or-der of 1 m (Fig. 3). We thus estimate the active layer of the Urumqi River to be ∼1 m. This morphological estimate is in good agreement with the one based on the D90 of the grain-size distribution at the same location. Indeed, theD90 is∼10 cm at the sampling site (Guerit et al., 2014) and ac-cording to this value, the active layer should also extend from the surface down to 1 m (i.e., 10D90; Leduc et al., 2015).
3 Methodology
We combined two methods to characterize the grain-size dis-tribution of the Urumqi River at the scale of its active layer: the volumetric and the surface count methods.
To characterize the surface-layer and subsurface granu-lometries of the river bed, we dug a 7.2 m×1.2 m×1 m trench perpendicular to the flow direction of one thread into its deposits (Fig. 4a–b). The sediments were excavated step by step from this trench as individual volumetric samples. We set the thickness of these samples to 2D90to ensure that the largest grains were contained within one sample, and we determined the volume to be large enough to accurately
Figure 5.Cumulative density function (CDF) of the grain-size distributions of(a)the 30 individual volumetric samples excavated from the trench (1.2×1.2×0.2 m, black lines) with correspondingQ–Qplots inset (φscale),(b)the five 20 cm thick layers of the trench from the surface to 1 m deep (red to yellow), and(c)the six 1.2 m wide columns of the trench from the west to the east (dark to light blue). In each figure, the grain-size distribution sampled by vertical surface counts (VSC) on the trench wall is indicated (green), together with itsD50and D90and their associated uncertainties (green dots).(d)Grain-size distributions of the two bulk samples obtained by vertical surface counts on the walls of the trench and volumetric sieving of the trench (Bulk, black) with correspondingQ–Qplots inset (φscale). The gray shading corresponds to the uncertainties in the volumetric sample quantiles. These four graphs suggest that the sediments of the Urumqi River active layer follow a similar distribution and are thus uniform at the scale of this active layer in terms of grain-size distribution.
in different ways. (i) They can be used individually to char-acterize the grain-size distribution at the local scale. (ii) They can be merged according to their depth (layers 1 to 5) or to their lateral position (columns A to F) to document poten-tial granulometric variability associated with the location of a sample within the riverbed. (iii) These individual volumet-ric samples can also be merged altogether to characterize the bulk granulometry of the Urumqi riverbed at the scale of the active layer. (iv) Finally, they can be merged randomly and analyzed to document the granulometric evolution with re-spect to the weight of a sample.
In order to test whether the bulk granulometry of the riverbed can be characterized from the sampling of a cross section, we determined the grain-size distribution of the sed-iments outcropping on the walls of the trench by a vertical surface count. We implemented the surface count methodol-ogy on the vertical sections of the river deposits (Fig. 4c–d), using a square grid of 20 cm (∼2D90in order to avoid sam-pling the same grain twice). We extracted the grains located directly under each node and measured theirbaxis (Wolman, 1954). However, grains smaller than 4 mm (19 % of the total sample) were not considered in order to reduce the measure-ment uncertainties (Kellerhalls and Bray, 1971; Church et al.,
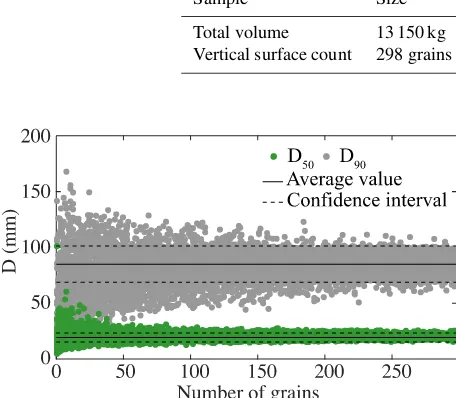
1987; Bunte and Abt, 2001). The resulting sample is thus composed of 298 grains withD >4 mm. We evaluated the confidence interval by a bootstrap method (Rice and Church, 1996; Bunte and Abt, 2001) for two characteristic diameters: theD50 (the diameter associated with the 50th percentile of the distribution) and theD90. We estimated theD50and the D90of 10 000 distributions built by randomly sampling with replacement 1 to 298 grains from the vertical surface sam-ple. For both diameters, the range of values decreases with increasing bootstrap resample size. Above a given bootstrap sample size, values stabilize around theD50 (orD90) of the initial sample and the confidence intervals correspond to the observed scatter.
Table 1.Main characteristics of the local-scale samples excavated from the trench.P andC are the proportions of pebbles and cobbles, respectively, within the sediments defined after Wentworth (1922).D50is the median diameter andD90the 90th quantile of the grain-size distributions. Confidence intervals are calculated from the Church et al. (1987) criteria (see the Methodology section for details).
Sample Size (kg) P(%) C(%) D50(mm) D90(mm) Sample Size (kg) P (%) C(%) D50(mm) D90(mm)
A1 649 96 4 23±1 66±3 D1 372 97 3 17±1 52±3
A2 300 100 0 21±1 56±3 D2 309 92 8 22±1 74±4
A3 506 96 4 20±1 62±3 D3 273 95 5 23±1 70±4
A4 475 93 7 20±1 70±4 D4 314 86 14 26±1 126±6
A5 338 89 11 22±1 66±3 D5 241 97 3 20±1 60±3
B1 607 85 15 32±2 97±5 E1 618 97 3 25±1 65±3
B2 615 95 5 24±1 65±3 E2 465 97 3 21±1 60±3
B3 599 88 12 29±1 94±5 E3 504 88 12 25±1 78±4
B4 510 88 12 22±1 74±4 E4 441 97 3 21±1 64±3
B5 343 83 17 27±1 104±5 E5 484 96 4 20±1 60±3
C1 363 97 3 20±1 61±3 F1 537 88 12 24±1 88±4
C2 368 88 12 24±1 78±4 F2 554 91 9 27±1 77±4
C3 271 90 10 27±1 77±4 F3 399 91 9 23±1 70±4
C4 386 90 10 25±1 76±4 F4 525 87 13 25±1 89±4
C5 271 98 2 20±1 60±3 F5 509 91 9 23±1 73±4
cumulative density function (CDF), whereas for the vertical surface sample we can compare theQ10toQ90quantiles. If the distributions are similar, points align on the x=y line. Regardless of the nature of the grain-size distributions, we can not statistically compare the individual distributions to each other because we do not have access to the number of grains in each sieve, a data value required for most statistical tests of comparison (the volumetric method provides only the frequency distribution of the grain sizes). Accordingly, the similarities and differences between the 30 volumetric sam-ples are discussed below based on the visual comparison of the distributions, together with the comparison of the charac-teristic diameters,D50andD90. However, when the samples are merged with respect to their position in the trench, they can be considered as several samples coming from the same group. For example, the five layers correspond to five groups, each group being characterized by six samples. In this case, ANOVA tests can be performed to compare the median di-ameters of the five layers (1 to 5) and of the six columns (A to F). ANOVA tests determine whether at least two groups come from the same population, based on the analysis of their variance. The ratioF of the variability within and be-tween the different groups is calculated and compared to the-oreticalF values. The tests are based on the null hypothesis that all the samples come from the same population of grains. This hypothesis is rejected ifF is higher than the acceptable values F95 andF99 at a level of significance of 95 % and 99 %, respectively.
Table 2.Main characteristics of the five layers issued from the trench.PandCare the proportions of pebbles and cobbles, respec-tively, within the sediments defined after Wentworth (1922).D50 is the median diameter andD90the 90th quantile of the grain-size distributions. Confidence intervals are calculated from the Church et al. (1987) criteria (see the Methodology section for details).
Sample Size (kg) P(%) C(%) D50(mm) D90(mm)
Layer 1 3226 95 5 24±1 69±3
Layer 2 2523 95 5 22±1 65±3
Layer 3 2657 91 9 25±1 76±4
Layer 4 2566 92 8 22±1 72±4
Layer 5 2161 93 7 21±1 66±3
Average 2626 93 7 23±1 70±4
4 Results
4.1 Granulometry of the riverbed at different spatial scales
4.1.1 Local variability in grain-size distribution
The five layers, as well as the six columns, are indistinguishable (F < F95).
Group Variation source df SS MS
Inter 4 0.03 0.01
Intra 25 0.50 0.02
Layers 1–5 Total 29 0.53 0.02
F F95 F99 P
0.42 2.76 4.18 0.80
Inter 5 0.18 0.04
Intra 24 0.35 0.01
Columns A–F Total 29 0.53 0.02
F F95 F99 P
2.39 2.62 3.90 0.07
quantile, diameters can vary within a range of±25 %–30 % around the mean value. For example, theD50vary between 17±1 mm and 32±2 mm with an average value of 23 mm, while theirD90are comprised between 52±3 and 126±6 mm with an average of 73 mm (Table 1).
4.1.2 Vertical sorting
Second, we merge the individual volumetric samples accord-ing to their depth (layers 1 to 5) and analyze the grain-size sorting with respect to depth (Fig. 5b, Table 2). On average, the different layers weigh 2600 kg and they are composed by 93 % of pebbles. The five distributions are similar in shape and for any quantile, diameters vary within a limited range of±10 % around the mean value (Fig. 5b). This is illustrated by the limited variability of the characteristic diameters: their D50range between 21±1 and 25±1 mm, while theirD90are comprised between 65±1 and 76±2 mm, with mean values of 23 and 70 mm, respectively (Table 2). The grain-size dis-tributions of these larger samples are thus less variable than the individual ones. In addition, we observe that the grain-size distribution of the surface layer (between 0 and 0.2 m, i.e., layer 1) is similar to the grain-size distribution of the sub-surface layer (between 0.2 and 1 m, i.e., merged layers 2 to 5) (Fig. S2), and in particular that the ratio between theD50 of the two layers is 1.07. Moreover, the ANOVA tests con-firm that the five layers are statistically indistinguishable (Ta-ble 3). Our data set thus indicates that at the scale of the active layer, there is no vertical sorting in the Urumqi riverbed.
Sample Size (kg) P(%) C(%) D50(mm) D90(mm)
Column A 2268 95 5 21±1 64±3
Column B 2674 88 12 26±1 77±4
Column C 1659 92 8 23±1 73±4
Column D 1509 93 7 21±1 71±4
Column E 2512 95 5 22±1 67±3
Column F 2524 90 10 24±1 76±4
Average 2191 92 8 23±1 71±4
4.1.3 Horizontal sorting
Third, we merge the individual volumes according to their lateral position (columns A to F) and analyze the horizontal grain-size sorting (Fig. 5c, Table 4). On average, the differ-ent columns weigh 2200 kg and they are composed by 92 % of pebbles. Here again, we observe that the samples exhibit a similar grain-size distribution, and for all the quantiles the scatter between these six samples is quite limited (Fig. 5c). For example, theD50range between 21±1 and 26±1 mm, while theirD90vary between 64±1 and 76±2 mm (Table 4). This corresponds to a range of±13 % and ±10 % around the means of the samples (23 and 71 mm, respectively). Here again, the ANOVA tests confirm that the six columns are in-distinguishable in terms of grain size (Table 3). Thus, at the scale of the active layer, the Urumqi riverbed has no hori-zontal granulometric sorting. In consequence, grain-size dis-tributions issued from vertical pits are equivalent to distribu-tions measured from horizontal layers.
4.2 Granulometry of the riverbed according to sampling methods
Finally, we merge all the volumetric samples together to de-termine the bulk granulometry of the riverbed (Fig. 5d, Ta-ble 5). Based on 13 150 kg of sediments, this large volumet-ric distribution is composed of 92 % pebbles, and theQ–Q plot indicates that the normalized sample also follows a nor-mal distribution (inset Fig. 5d). It is characterized by aD50 of 23±1 mm and aD90of 73±1 (Fig. 5d, Table 5).
Table 5. Main characteristics of the large-scale samples. P and C are the proportions of pebbles and cobbles, respectively, within the sediments defined after Wentworth (1922).D50is the median diameter andD90the 90th quantile of the grain-size distributions. Confidence intervals are calculated by bootstrapping for the surface counts and from the Church et al. (1987) criteria for the volumetric sample (see the Methodology section for details).
Sample Size P (%) C(%) D50(mm) D90(mm)
Total volume 13 150 kg 92 8 23±1 73±4
Vertical surface count 298 grains 85 15 20±4 82±16
Figure 6.Estimation of the confidence interval by a bootstrap ap-proach of theD50(green dots) andD90(gray dots) of the surface counts performed along the walls of the trench (see text for details on the method). Diameters are defined within a range of±15 %– 20 %.
is 82±16 mm (Table 5). Accordingly, the shape of the ver-tical surface grain-size distribution compares well with the bulk volumetric distribution of the trench, but also with the 30 individual volumetric samples as well as with the five layers and the six columns (Fig. 5). Except for the small-est grain sizes, the diameters associated with each quantile are very similar (Fig. 5). AQ–Qplot also confirms that the distribution obtained by the vertical surface count is similar to the bulk volumetric one (Fig. S3). This comparison indi-cates that the characterization in cross section of the Urumqi active layer is equivalent to the more traditional volumetric method, and thus shows for the first time that surface counts implemented on vertical outcrops can be used as proxies for a bulk volumetric sampling.
5 Discussion
5.1 Grain-size uniformity in an active, gravel-bedded, braided river
At the local scale (<1 m to tens of meters), features of grain-size sorting are commonly observed and documented on the bed of braided gravel-bed streams (Leopold et al., 1964; Bluck, 1971, 1976; Smith, 1974; Ashworth, 1996; Ashmore, 2013; Guerit et al., 2014). In these rivers, this surface sorting is associated with the morpho-sedimentary elements (bars,
anabranches, and chutes) that shape the riverbed. In the Urumqi River, we also observe local variations in grain sizes in the vertical section of the active layer with small areas enriched in fine or coarse grains (Fig. S4) and this variabil-ity could be the expression in cross section of the small-scale sorting associated with the morpho-sedimentary ele-ments observed on the bed (Guerit et al., 2014). We propose that this sorting may be responsible for the scatter observed between the granulometric distributions of the 30 individual volumetric samples (Fig. 5a), as the volumetric samples scale in size with the morpho-sedimentary elements correspond-ing to meter-wide and centimeter-to-decimeter-deep grain-size patches. This suggestion is supported by the fact that scatter around the mean values seems to be dependent on the sample size (Fig. 5).
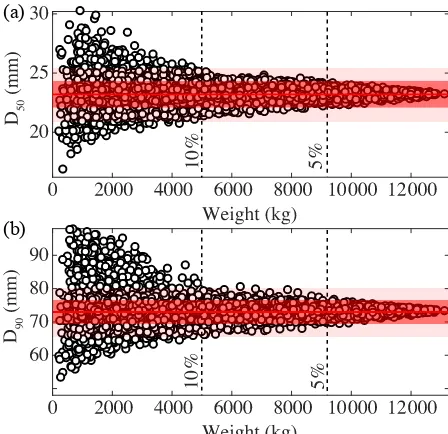
To assess the minimum weight required for a sample to go over the local variability and to be equivalent to the bulk one, we randomly merge, without replacement, the individ-ual volumetric samples to obtain 600 composite volumetric samples of 241 to 13 150 kg. We then determine theD50and D90 as a function of the sample weight (Fig. 7). Variabil-ity around the mean decreases with increasing weight and at first order, the sample weight must increase by a factor of 2 for the variability around the mean value to decrease by 5 % (Fig. 7). We observe that∼5000 kg of sediments larger than 4 mm (about 11 individual volumetric samples) are re-quired to estimate aD50and aD90within a range of±10 % around the mean values (Fig. 7). To reach a level of accu-racy equivalent to the bulk sample (±5 %), we observe that 9000 kg (about 20 individual volumetric samples) are neces-sary (Fig. 7). This analysis confirms that small-scale grain-size sorting exists in the active layer of the Urumqi River, but this sorting becomes negligible as the sample size in-creases. The active layer of the Urumqi River thus appears as the superposition of small-scale structures (the morpho-sedimentary elements), whose variability vanishes above a given scale. Accordingly, at the scale of the active layer, the grain-size distribution of the Urumqi River deposits can be considered as uniform.
(b)
Figure 7.Evolution of(a)theD50 and(b)theD90with respect to the sample weight. These diameters are issued from grain-size distributions built by random merging without replacement of the individual volumetric samples. The red line is for the mean value, the dark red area for the mean±5 %, and the light red area for the mean±10 %. The black dashed lines indicate the visually estimated threshold for a sample to be within±10 % and 5 %.
layer of the bed, the deposits are representative of the sedi-ments transported as bed load in direct contact with the flow, providing that the sample is large enough to integrate at least a dozen morpho-sedimentary elements. Our results therefore accord with the experimental findings of Gardner and Ash-more (2011), Leduc et al. (2015), and Gardner et al. (2018). The agreement between field and physical experiments leads us to propose that the absence of vertical and lateral sort-ing may be typical of non-armored, gravel-bedded, braided rivers.
5.2 Grain-size sampling in ancient systems
We show that the broadly used Wolman grid-by-number method can be implemented on vertical sections to character-ize grain-scharacter-ize distributions with a good level of confidence. In addition, the granulometric uniformity at the scale of the Urumqi active layer implies that the grain-size distribution of paleo-rivers can be adequately determined from conglom-eratic outcrops. Our study thus legitimates this kind of sam-pling (Duller et al., 2010; Whittaker et al., 2011; Michael et al., 2014; Chen et al., 2018), at least for unarmored braided rivers, for stratigraphical or paleo-hydrological reconstruc-tions .
However, three limitations must be considered to general-ize our results to any field work in ancient systems. First, this study is based on grains removed from trench walls so that it
In such a situation, a correction factor should be applied to determine thebaxis (Storz-Peretz and Laronne, 2013a). On the contrary, in a section parallel to the main flow, theb (in-termediate) andc(short) axes are expected to be visible, and thebaxis will then appear to be the longest one (e.g., Bunte and Abt, 2001). Indications of paleo-flows can thus help to identify the actualbaxis.
Second, the grain-size distribution of the deposits can be altered after deposition or after surface abandonment by sev-eral factors. Aeolian processes can either bring fine material that can infiltrate the gravels and decrease the global gran-ulometry of the deposits, or lead to the formation of desert pavements (McFadden et al., 1987, 1998). Soil development on the top of a surface can also induce the formation of secondary particles that will contaminate the initial gravel deposits (e.g., Pimentel, 2002). However, the gravel frac-tion should not be affected by such secondary processes that generally affect the fine-grain content, and truncation of the grain-size distribution below a given diameter (4 mm here) should ensure the removal of these secondary signals. More-over, as these processes might mostly affect the upper part of gravel deposits (Wooster et al., 2008; Cui et al., 2008), sam-ples should be acquired as much as possible where evidence for such modifications are not observed. With time, chemical alteration can also modify the size of the initial gravels, but this process might be difficult to quantify. Accordingly, we suggest that outcrops showing evidence of gravel alteration should not be sampled.
Finally, the third limitation is related to the limited thick-ness of the active layer, which extends in depth over several D90only for an active system (Laronne et al., 1994; Gardner and Ashmore, 2011; Leduc et al., 2015). Moreover, the thick-ness of this layer is not fixed though time as it could evolve with potential changes in the river characteristics. The sed-iments deposited during a hydrological season can also be remobilized afterwards if the river incises, leading to a par-tial or total destruction of the former active layer(s). In strati-graphic successions, deposits are stacked vertically through time and consequently, to compensate for this limited exten-sion in depth of the active layer and for its potential preserva-tion changes through time, the grids used for vertical surface counts should extend laterally rather than vertically to stay as much as possible within the same sedimentary layer.
6 Conclusions
China. Based on a large data set collected by volumetric and vertical surface count samplings, we show that the grain-size distribution of the riverbed is uniform at the scale of its ac-tive layer. Despite some local variabilities related to small-scale grain-size features, there is no vertical or lateral granu-lometric trend within this layer. Because our findings confirm earlier physical models (Gardner and Ashmore, 2011; Leduc et al., 2015; Gardner et al., 2018), we propose that, beyond the Urumqi River, this uniformity can be the case for all the non-armored, gravel-bedded, braided streams.
This uniformity implies that it is possible to determine the grain-size distribution of gravel-bedded, braided alluvial systems from vertical outcrops. We show that the grid-by-number method, initially developed and tested on the hori-zontal surface of riverbeds, can be implemented on vertical outcrops to obtain samples equivalent to a volumetric investi-gation in non-armored, gravel-bedded rivers. This study thus supports the hypothesis that vertical surface counts can be implemented on conglomeratic outcrops to provide an accu-rate characterization of the grain-size distribution of paleo-braided rivers.
Data availability. The dataset is available in the attached Supple-ment.
Supplement. The supplement related to this article is available online at: https://doi.org/10.5194/esurf-6-1011-2018-supplement.
Author contributions. All authors contributed to data acquisition and analysis, and were actively involved in writing the manuscript.
Competing interests. The authors declare that they have no con-flict of interest.
Acknowledgements. We are thankful to two anonymous review-ers and to the associate editor for their comments that strongly improved the quality of the paper. The study presented in this manuscript was conducted with research grants from the CNRS-INSU RELIEF program and the French–Chinese CNRS-CAS international associated laboratory SALADYN, as well as from the IPGP BQR and Potamology programs. Laure Guerit benefitted from a PhD grant from the French Ministry of Research and Higher Education (MESR). This work is partially supported by the National Natural Science Foundation of China (no. 41471001).
Edited by: Rebecca Hodge
Reviewed by: two anonymous referees
References
Ashmore, P.: Treatise on Geomorphology, vol. 9, chap. Morphology and Dynamics of Braided Rivers, San Diego, Academic Press, 289–312, 2013.
Ashworth, P. J.: Mid-channel bar growth and its relationship to local flow strength and direction, Earth Surf. Proc. Land., 21, 103–123, 1996.
Ashworth, P. J., Ferguson, R. I., and Powell, M. D.: Dynamics of gravel-bed rivers, Bedload transport and sorting in braided chan-nels, John Wiley & Sons Ltd., 497–515, 1992.
Bluck, B. J.: Sedimentation in the meandering River Endrick, Scot. J. Geol., 7, 93–138, 1971.
Bluck, B. J.: Sedimentation in some Scottish rivers of low sinuosity, Transactions Royal Society of Edinburgh, 69, 425–455, 1976. Bunte, K. and Abt, S.: Sampling surface and subsurface
particle-size distributions in wadable gravel-and cobble-bed streams for analyses in sediment transport, hydraulics, and streambed moni-toring, Gen. Tech. Rep. RMRS-GTR-74, 2001.
Buscombe, D.: Transferable wavelet method for grain-size distri-bution from images of sediment surfaces and thin sections, and other natural granular patterns, Sedimentology, 60, 1709–1732, 2013.
Chen, C., Guerit, L., Foreman, B. Z., Hassenruck-Gudipati, H. J., Adatte, T., Honegger, L., Perret, M., Sluijs, A., and Castelltort, S.: Estimating regional flood discharge dur-ing Palaeocene-Eocene global warmdur-ing, Sci. Rep., 8, 13391, https://doi.org/10.1038/s41598-018-31076-3, 2018.
Church, M. A., McLean, D. G., and Wolcott, J. F.: Sediments trans-port in Gravel Bed Rivers, chap. River Bed Gravels : Sampling and Analysis, John Wiley and Sons, New York, 43–88, 1987. Cui, Y., Wooster, J. K., Baker, P. F., Dusterhoff, S. R., Sklar, L. S.,
and Dietrich, W. E.: Theory of fine sediment infiltration into im-mobile gravel bed, J. Hydraul. Eng., 134, 1421–1429, 2008. D’Arcy, M. and Whittaker, A., and Roda-Boluda, D.: Measuring
alluvial fan sensitivity to past climate changes using a self-similarity approach to grain-size fining, Death Valley, California, Sedimentology, 64, 388–424, 2016.
Diplas, P. and Fripp, J. B.: Properties of Various Sediment Sampling Procedures, J. Hydraul. Eng.-ASCE, 118, 955–970, 1992. Duller, R., Whittaker, A., Fedele, J., Whitchurch, A., Springett,
J., Smithells, R., Fordyce, S., and Allen, P.: From grain size to tectonics, J. Geophys. Res., 115, F03022, https://doi.org/10.1029/2009JF001495, 2010.
Gardner, T. and Ashmore, P.: Geometry and grain-size characteris-tics of the basal surface of a braided river deposit, Geology, 39, 247–250, 2011.
Gardner, T., Ashmore, P., and Leduc, P.: Morpho-sedimentary char-acteristics of proximal gravel braided river deposits in a Froude-scaled physical model, Sedimentology, 65, 877–896, 2018. Guerit, L., Barrier, L., Narteau, C., Métivier, F., Liu, Y., Lajeunesse,
E., Gayer, E., Meunier, P., Malverti, L., and Ye, B.: The Grain-size Patchiness of Braided Gravel-Bed Streams–example of the Urumqi River (northeast Tian Shan, China), Adv. Geosci., 37, 27–39, 2014.
vation potential of coarse-grained sediments deposited by flood events in hyper-arid braided channels in the Rift Valley, Arava, Israel, Sediment. Geol., 195, 21–37, 2007.
Laronne, J. B., Reid, I., Yitshak, Y., and Frostick, L. E.: The non-layering of gravel streambeds under ephemeral flood regimes, J. Hydrol., 159, 353–363, 1994.
Leduc, P., Ashmore, P., and Gardner, J.: Grain sorting in the mor-phological active layer of a braided river physical model, Earth Surf. Dynam., 3, 577–585, 2015.
Leopold, L. B., Wolman, M. G., and Miller, J. P.: Fluvial processes in geomorphology, Freeman, 1964.
Lisle, T. E. and Madej, M. A.: Dynamics of gravel-bed rivers, chap. Spatial variation in armouring in a channel with high sediment supply, John Willey & Sons, 277–293, 1992.
Liu, Y., Métivier, F., Lajeunesse, E., Lancien, P., Narteau, C., and Meunier, P.: Measuring bed load in gravel bed mountain rivers: averaging methods and sampling strategies, Geodynamica Acta, 21, 81–92, 2008.
Liu, Y., Métivier, F., Gaillardet, J., Ye, B., Meunier, P., Narteau, C., Lajeunesse, E., Han, T., and Malverti, L.: Erosion rates deduced from seasonal mass balance along the upper Urumqi River in Tianshan, Solid Earth, 2, 283–301, https://doi.org/10.5194/se-2-283-2011, 2011.
Mao, L., Cooper, J. R., and Frostick, L. E.: Grain size and topo-graphical differences between static and mobile armour layers, Earth Surf. Proc. Land., 36, 1321–1334, 2011.
McFadden, L. D., Wells, S. G., and Jercinovich, M. J.: Influences of eolian and pedogenic processes on the origin and evolution of desert pavements, Geology, 15, 504–508, 1987.
McFadden, L. D., McDonald, E. V., Wells, S. G., Anderson, K., Quade, J., and Forman, S. L.: The vesicular layer and carbonate collars of desert soils and pavements: formation, age and relation to climate change, Geomorphology, 24, 101–145, 1998. Michael, N. A., Whittaker, A. C., Carter, A., and Allen, P. A.:
Vol-umetric budget and grain-size fractionation of a geological sedi-ment routing system: Eocene Escanilla Formation, south-central Pyrenees, Geol. Soc. Am. Bull., 126, 585–599, 2014.
Milne, J. A.: Bed-material size and the riffle-pool sequence, Sedi-mentology, 29, 267–278, 1982.
Paola, C. and Seal, R.: Grain-size patchiness as a cause of selective deposition and downstream fining, Water Resour. Res., 31, 1395– 1407, 1995.
Parker, G.: Selective sorting and abrasion of river gravel. I: Theory, J. Hydraul. Eng., 117, 131–147, 1991.
Parker, G. and Klingeman, P.: On why gravel bed streams are paved, Water Resour. Res., 18, 1409–1423, 1982.
Piedra, M. M., Haynes, H., and Hoey, T. B.: The spatial distribution of coarse surface grains and the stability of gravel river beds, Sedimentology, 59, 1014–1029, 2012.
Pimentel, N.: Pedogenic and early diagenetic processes in Palaeo-gene alluvial fan and lacustrine deposits from the Sado Basin (S Portugal), Sediment. Geol., 148, 123–138, 2002.
Schlunegger, F. and Norton, K.: Climate vs. tectonics: the com-peting roles of Late Oligocene warming and Alpine orogenesis in constructing alluvial megafan sequences in the North Alpine foreland basin, Basin Research, 27, 230–245, 2015.
Singer, M.: Downstream patterns of bed material grain size in a large, lowland alluvial river subject to low sediment supply, Water Resour. Res., 44, W12202, https://doi.org/10.1029/2008WR007183, 2008.
Smith, N. D.: Sedimentology and bar formation in Upper-Kicking-Horse-River, a braided outwash stream, J. Geol., 82, 205–223, 1974.
Storz-Peretz, Y. and Laronne, J. B.: Automatic Grain Sizing of verti-cal exposures of gravelly deposits, Sediment. Geol., 294, 13–26, 2013a.
Storz-Peretz, Y. and Laronne, J. B.: Morphotextural characteriza-tion of dryland braided channels, Geol. Soc. Am. Bull., 125, 1599–1617, 2013b.
Storz-Peretz, Y. and Laronne, J. B.: The morpho-textural signature of large bedforms in ephemeral gravel-bed channels of various planforms, Hydrol. Process., 32, 617–635, 2018.
Storz-Peretz, Y., Laronne, J. B., Surian, N., and Lucía, A.: Flow recession as a driver of the morpho-texture of braided streams, Earth Surf. Proc. Land., 41, 754–770, 2016.
Sun, J., Lin, B., and Yang, H.: Development and application of a braided river model with non-uniform sediment transport, Adv. Water Res., 81, 62–74, 2015.
Vericat, D., Batalla, R. J., and Gibbins, C. N.: Sediment entrainment and depletion from patches of fine material in a gravel-bed river, Water Resour. Res., 44, W11415, https://doi.org/10.1029/2008WR007028, 2008.
Wentworth, C. K.: A scale of grade and class terms for clastic sedi-ments, J. Geol., 30, 377–392, 1922.
Whittaker, A., Duller, R., Springett, J., Smithells, R., Whitchurch, A., and Allen, P.: Decoding downstream trends in stratigraphic grain size as a function of tectonic subsidence and sediment sup-ply, Geol. Soc. Am. Bull., 123, 1363–1382, 2011.
Wilcock, P. and McArdell, B.: Surface-based fractional transport rates: Mobilization thresholds and partial transport of a sand-gravel sediment, Water Resour. Res., 29, 1297–1312, 1993. Wolman, M.: A method for sampling coarse river-bed material,
American Geophysical Union Transactions, 35, 951–956, 1954. Wooster, J. K., Dusterhoff, S. R., Cui, Y., Sklar, L. S.,
Di-etrich, W. E., and Malko, M.: Sediment supply and rel-ative size distribution effects on fine sediment infiltration into immobile gravels, Water Resour. Res., 44, W03424, https://doi.org/10.1029/2006WR005815, 2008.
Zhou, L., Yang, F., and Shao, X.: River hydrology and water re-sources in Xinjiang, Urumqi (in chinese), Xinjiang Science and Technology Press, 1999.