Comparative Analysis of Fast Wavelet
Transform for Image Compression for
optimal Image Quality and Higher
Compression Ratio
BALURAM NAGARIA1, MHD. FARUKH HASHMI2, PRADEEP DHAKAD3
Mandsaur Institute of Technology, Mandsaur (MP)
Abstract:
There are several types of lossy image compressions available; to achieve higher degree of compression without any significant loss in the diagnostability of the image we choose different type of wavelet function to compress different types of images. A typical still image contains a large amount of spatial redundancy in plain areas where adjacent picture elements (pixels) have almost the same values. It means that the pixel values are highly correlated. However we have several types images with us and there pixel correlativity might not be in same fashion therefore any specific wavelet function cannot give optimum result for each type of images. This Paper is focused on selecting the most appropriate wavelet function for a given type of image compression. In this paper we studied the behavior of different type of wavelet function with different type of images and suggested the most appropriate wavelet function that can perform optimum compression for a given type of images. To analyze the performance of the wavelet function with the images we fixed the loss amount of the data in the compressed image (Quality of the compressed image will be same for each wavelet function) and calculated their respective compression ratio. The wavelet function that gives the maximum compression for a specific type of image will be the most appropriate wavelet for that type of image compression. Image quality is measured objectively, using peak signal-to-noise ratio or picture quality scale, and subjectively, using perceived image quality. The effects of different wavelet functions, image contents and compression ratios are assessed. Our results provide a good reference for application developers to choose a good wavelet compression system for their application.
Keywords: wavelet transforms, mean square error, maximum error (MSE), peak signal to noise ratio (PSNR), compression ratio (CR), Thresholding.
I. Introduction
Image compression is the process of encoding information using fewer bits (or other information-bearing units) than an un-encoded representation would use through use of specific encoding schemes. Compression is useful because it helps to reduce the consumption of expensive resources, such as hard disk space or transmission bandwidth (computing) [2]. On the downside, compressed data must be decompressed, and this extra processing may be detrimental to some applications. For instance, a compression scheme for image may require expensive hardware for the image to be decompressed fast enough to be viewed as its being decompressed (the option of decompressing the image in full before watching it may be inconvenient, and requires storage space for the decompressed image). The design of data compression schemes therefore involves trade-offs among various factors, including the degree of compression, the amount of distortion introduced (if using a lossy compression scheme), and the computational resources required to compress and uncompress the data. Image compression is the application of Data compression on digital images. Image compression is minimizing the size in bytes of a graphics file without degrading the quality of the image to an unacceptable level. The reduction in file size allows more images to be stored in a given amount of disk or memory space. It also reduces the time required for images to be sent over the Internet or downloaded from Web pages [1, 3].
analysis is capable of revealing aspects of data that other signal analysis techniques miss aspects like trends, breakdown points, discontinuities in higher derivatives, and self-similarity [4, 7, and 15].
II. Wavelet Transforms
Wavelet compression involves a way analyzing an uncompressed image in a recursive fashion, resulting in a series of higher resolution images, each “adding to” the information content in lower resolution images. The primary steps in wavelet compression are performing a discrete wavelet Transformation (DWT), quantization of the wavelet-space image sub bands, and then encoding these sub bands. Wavelet images by and of themselves are not compressed images; rather it is quantization and encoding stages that do the image compression. Image decompression, or reconstruction, is achieved by carrying out the above steps in reverse and inverse order [5, 6]. Thus, to restore the original image, the compressed image is decoded, dequantized, and then an inverse- DWT is performed. Because wavelet compression inherently results in a set of multi-resolution images, it is well suited to working with large imagery which needs to be selectively viewed at different resolution, as only the levels containing the required level of detail need to be decompressed. Wavelet mathematics embrace an entire range of methods each offering different properties and advantages. For example, it is possible to compress 3 or more dimensional imagery using wavelets. Wavelet compression has not been widely used because DWT operation takes a lot of compute power, and because historical techniques perform the DWT operation in memory or by storing intermediate results on hard disk.
This limits either the size of the image that can be compressed, or the speed at which it can be compressed. The following diagram shows wavelet based compression & decompression method [12].
Wavelets are generated from one single function (basis function) called the mother wavelet. Mother Wavelet is a prototype for generating the other window functions [7, 14].
The mother wavelet is scaled (or dilated) by a factor of a and translated (or shifted) by a factor of b to give (under Morlet's original formulation):
( )
− × = a b t a t b aψ
ψ
1, (2.1)
Where a and b are two arbitrary real numbers. ‘a’ and ‘b’ represent the dilations and translations parameters respectively in the time axis.
The parameter ‘a’ contracts
ψ
(t) in the time axis when a < 1 and expands or stretches when a > 1. Hence ‘a’ is called the dilation (scaling) parameter. For a < 0, the function ψa,b(t) results in time reversal with dilation. Mathematically, when‘t’ is replaced in equation by (t – b) it causes a translation or shift in the time axis resulting in the wavelet function.It is a transform that provides the time -frequency representation simultaneously.
III. Wavelet Families
Meyer, Morlet and Mexican Hat wavelets are symmetric in shape. The wavelets are chosen based on their shape and their ability to analyze the signal in a particular application [9, 12].
A. Haar- This wavelet is discontinuous, and resembles a step function.
B. Coiflets- The wavelet function has 2N moments equal to 0 and the scaling function has 2N-1 moments
equal to 0. The two functions have a support of length 6N-1.
C. Symlets- The symlets are nearly symmetrical wavelets. The properties of the two wavelet families are
similar
D. Meyer - The Meyer wavelet and scaling function are defined in the frequency domain.
E. Biorthogonal- This family of wavelets exhibits the property of linear phase, which is needed for signal
and image reconstruction. By using two wavelets, one for decomposition (on the left side) and the other for reconstruction (on the right side) instead of the same single one, interesting properties are derived.
F. Daubechies- Daubechies are compactly supported orthonormal wavelets and found application in
DWT. Its family has got nine members in it [16].
Fig 2.3 Different types of Wavelet families
IV. Proposed Methodology
The usual steps involved in compressing and decompressing of image are
• Load original Image.
• Generate Compressed Image.
• Use Thresholding (‘wdencmp’) command for denoising.
• Calculate compression ratio
• Calculate MSE & PSNR for original and output image.
• Obtained Reconstructed image
• Plot the histogram for original, compressed and reconstructed image.
Compression ratio: It also known as compression power is a computer-science term used to quantify the
reduction in data-representation size produced by a data compression algorithm [13]. The data compression ratio is analogous to the physical compression ratio used to measure physical compression of substances, and is defined in the same way, as the ratio between the uncompressed size and the compressed size:
Compression Ratio = Uncompressed Size/Compressed Size (4.1)
In measuring the quality of the reconstructed image, two mathematical metrics are used. One of them is MSE, which measures the cumulative square error between the original and the compressed image [10]. The other is the peak signal-to reconstructed image measure known as PSNR.
The formula for MSE is giving as
(4.2)
While these two measurements may not be the best approach to measure an image, they do provide a guide to the quality of the reconstructed image. In general, a good reconstructed image is one with low MSE and high PSNR. That means that the image has low error and high image fidelity [11].
V. Results And Discussions
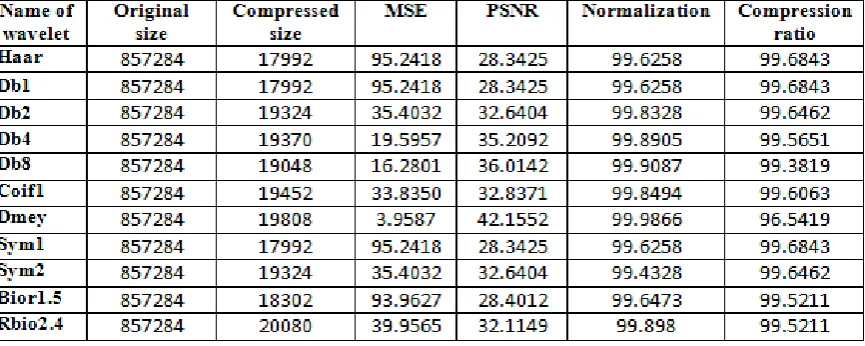
For the above mentioned Wavelet methods, image compression is performed using wavelets from the first level to seventh level decomposition and calculates the compression ratio with different wavelet families. Results of compression ratio for different wavelet families are shown in table 5.1. Optimum Results for with low MSE and optimum PSNR for different wavelet families also shown in table 5.2. It was found that fifth level decomposition gave optimum results. For this particular case it is evident that the proposed method based on wavelets performs better compression ratio is obtained using haar wavelet and image quality is obtained using dmey wavelet. The quality of the reconstructed images is measured by the peak signal noise ratio, which is obtained by maximum discrete Meyer wavelet
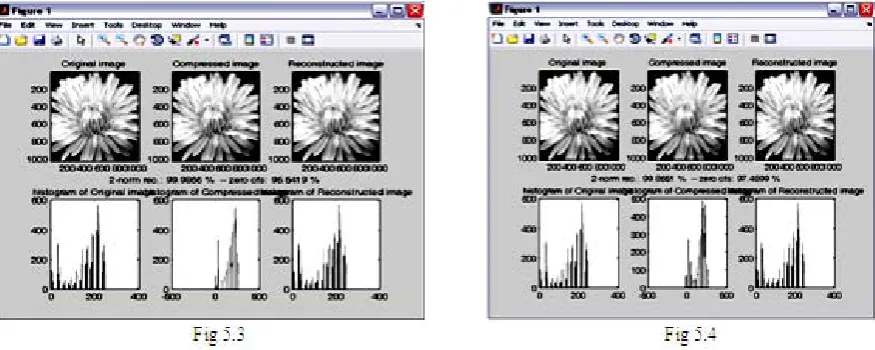
We have taken the test image flower shown in fig. 5.1. to 5.4. We have used mother wavelet Haar Wavelet (HW), Daubechies (db1, db2, db4, and db8), Symlets (sym1, sym2), Coiflets (coif1), Biorthogonal (bior 1.5), Reverse Biorthogonal (rbior2.4) & Discrete Meyer (dmey). Results are observed in terms of Compression ratio, MSE and PSNR achieved for original & compressed image with different decomposition level. The best results are presented in this paper (Table 5.1 & 5.2). We have concluded that we got the optimum MSE and PSNR for Discrete Meyer Wavelet. We have also calculated the maximum compression ratio for Haar wavelet with 5 Decomposition level e found that above presented Results Discrete wavelet is suitable for better image quality and Haar wavelet is suitable for higher compression ratio. The original, compressed and reconstructed images results and their histograms using Haar wavelet is shown in fig.5.1 & fig 5.2 .The original, compressed and reconstructed images results and their histograms using Discrete Meyer Wavelet is shown in fig. 5.3 & 5.4.
Table 5.1 Compression ratio for wavelet families with different decomposition level
Figure 5.1: (a) Decomposition level-5 Original Image, Compressed Image, Reconstructed Image, using Haar Wavelet
(b) Histogram of Decomposition level-5 Original Image, Compressed Image, Reconstructed Image using Haar Wavelet
Figure 5.2: (a) Decomposition level-7 Original Image, Compressed Image, Reconstructed Image, using Haar Wavelet
(b) Histogram of Decomposition level-7 Original Image, Compressed Image, Reconstructed Image using Haar Wavelet
Figure 5.3: (a) Decomposition level-5 Original Image, Compressed Image, Reconstructed Image, using Discrete Meyer Wavelet
(b) Histogram of Decomposition level-5 Original Image, Compressed Image, Reconstructed Image using Discrete Meyer Wavelet
Figure 5.4: (a) Decomposition level-7 Original Image, Compressed Image, Reconstructed Image, using Discrete Meyer Wavelet
(b) Histogram of Decomposition level-7 Original Image, Compressed Image, Reconstructed Image using Discrete Meyer Wavelet
VI. Conclusion
of optimal wavelet in image compression application depends on image quality and computational complexity. We found that wavelet-based image compression prefers smooth functions of relatively short length. A suitable number of decompositions should be determined by means of image quality and less computational operation.
References:
[1] Mislav GrgiC, Mario Ravnjak, Branka Zovko-Cihlar, “Filter Comparison in Wavelet Transform of Still Images”, Industrial Electronics, 1999. Proceedings of the IEEE International Symposium on Volume 1, 12-16 July 1999 Page(s):105 - 110 vol.1.
[2] Robert W. Buccigrossi and Eero P. Simoncelli.“Image Compression via Joint Statistical Characterization in the Wavelet Domain”, IEEE transactions on image processing, vol. 8, no. 12, pp 1688-1691, December 1999.
[3] Karthik Krishnan, Michael W. Marcellin, Ali Bilgin, and Mariappan S. Nadar, “Efficient Transmission of Compressed Data for Remote Volume Visualization”, IEEE transactions on medical imaging, vol. 25, no. 9, pp1189-1199, September 2006.
[4] Adrian Munteanu, Jan Cornelis, and Paul Cristea, “Wavelet-Based Lossless Compression of Coronary Angiographic Images”, IEEE transactions on medical imaging, vol. 18, no. 3, pp 272-281, March 1999.
[5] Menegaz, G., L. Grewe and J.P. Thiran, 2000. Multirate Coding of 3D Medical Data. In proceedings 2000 International Conference on Image Processing, IEEE, 3: 656-659.
[6] Galli, A.W., G.T. Heydt and P.F. Ribeiro, 1996.Exploring the Power of Wavelet Analysis. IEEE Computer Application in Power, pp: 37-41.
[7] Sarah Betz, Nirav Bhagat, Paul Murhy & Maureen Stengler, “Wavelet Based Image Compression –Analysis of Results”, ELEC 301 Final Project.
[8] Aleks Jakulin “Base Line JPEG and JPEG2000 Aircrafts Illustrated”, Visicron, 2002.
[9] Paul Watta, Brijesh Desaie, Norman Dannug, Mohamad Hassoun, “ Image Compression using Backprop”, IEEE, 1996.
[10] Sergio D. Servetto, Kannan Ramchandran, Michael T. Orchard, “Image Coding Based on a Morphological Representation of Wavelet Data,” IEEE Transaction on Image Processing, 8, No.9, pp.1161-1174, 1999.
[11] Crosswinds,” An Introduction to Image Compression„, http://www.crosswinds.net/~sskr/imagecmp/index.htm (current May 10, 2001) [12] “Comparative study of Wavelet Families for Biomedical Image Compression” by Saurav Goyal Master of Engineering in Electronics
Instrumentation and Control Engineering at Thapar University, Patiala.
[13] ”Still Image Compression Using Wavelet Transform” by Choo Li Tan School of information Technology and Electrical Engineering for the degree of Bachelor of Engineering (Honours) 19th October 2001
[14] DeVore RA, Jawerth BD, Lucier BJ. Image compression through wavelet transforms coding. IEEE Trans. Inf. Theory 1992; 2:719-746.