Lincoln
University
Digital
Thesis
Copyright
Statement
The
digital
copy
of
this
thesis
is
protected
by
the
Copyright
Act
1994
(New
Zealand).
This
thesis
may
be
consulted
by
you,
provided
you
comply
with
the
provisions
of
the
Act
and
the
following
conditions
of
use:
you
will
use
the
copy
only
for
the
purposes
of
research
or
private
study
you
will
recognise
the
author's
right
to
be
identified
as
the
author
of
the
thesis
and
due
acknowledgement
will
be
made
to
the
author
where
appropriate
you
will
obtain
the
author's
permission
before
publishing
any
material
from
the
thesis.
The release of nitrogen and carbohydrate from herbage during
comminution.
A thesis
submitted in partial fulfilment
of the requirements for the Degree of
Doctor of Philosophy
at
Lincoln University
by
Elena Marie Katherine Minnée
iii
Abstract of a thesis submitted in partial fulfilment of the
requirements for the Degree of Doctor of Philosophy.
Abstract
The release of nitrogen and carbohydrate from herbage during comminution.
by
Elena Marie Katherine Minnée
In forage-based livestock production systems, dietary N is often in excess supply. In addition, the
efficiency with which ruminants utilise dietary N utilisation is low, leading to substantial losses of N to
the environment, particularly in urine. There are considerable political and societal pressures for farmers
to reduce N losses, yet still maintain productivity. To enable reductions in N excretion and improve N
utilisation, the flow of N through ruminants needs to be understood. While much is known about the
ruminal degradation of dietary N, less is known about the release of N from herbage during ingestion.
As herbage N is readily fermentable, the extent of release of N during ingestion has implications for
ruminal ammonia concentration and concomitantly, N excretion. The aims of this PhD research
programme were to quantify the variation between forages in N release during comminution of herbage,
explore the characteristics of herbage that influence N release, and consider implications for N excretion.
Two laboratory based experiments were conducted to examine the release of N during mechanical
maceration of herbage, as a proxy for the effect of ingestive mastication on herbage by dairy cows. The
first compared N release from herbage of five commonly used forages: perennial ryegrass (Lolium
perenne L.), white clover (Trifolium repens L.), lucerne (Medicago sativa L.), chicory (Cichorium
intybus L.), and plantain (Plantago lanceolata L.), collected in February, May, August, and November
of 2015. The amount of N (as crude protein, CP) released during maceration of herbage varied 15-fold,
with lucerne releasing the most (11.5 g/100 g DM) and plantain the least (0.8 g/100 g DM). Crude
protein release from forages ranked as follows: lucerne > ryegrass = clover > chicory > plantain.
Investigations revealed that no single characteristic (i.e. herbage physical properties or chemical
iv
However, forages that tended to have greater herbage CP and non-protein N (NPN) concentrations
tended to release more N during maceration. This finding led to the second laboratory experiment that
explored the effect of increasing rates of N fertiliser application (0, 100, 200 and 350 kg N/ha/y) on
herbage characteristics and release of N. Herbage was collected from swards of perennial ryegrass,
lucerne, chicory and plantain in May (autumn) and November (spring) 2015. Increasing N fertiliser rate
applied increased leaf length (up to 140%), herbage mass (up to 320%), and CP and NPN concentration
in perennial ryegrass, chicory and plantain. Increasing N fertiliser rate doubled the amount of CP
released from ryegrass herbage across both seasons, and chicory in autumn, but increased CP release
from plantain 6-fold in autumn. Increasing N fertiliser rate applied to ryegrass, chicory and plantain
swards also reduced the ratio of fermentable carbohydrate to CP in herbage, which is thought to increase
loss of N in urine. The greatest increase in the amount of CP released and greatest decline in the ratio
was observed at N rates exceeding 200 kg N/ha/y, coinciding with reductions in herbage mass and leaf
growth response to increased rates N fertiliser application. This study suggests rates equivalent to 200
kg N/ha/y ought to be the upper limit of N fertiliser applied to swards of ryegrass, chicory and plantain.
The third experiment conducted sought to determine the effect of ingestive mastication by mature dairy
cows on fresh cut herbage from three forages (perennial ryegrass, lucerne and chicory). The ranking of
herbages for CP release was similar to that determined in the first two laboratory based experiments,
where 7.5, 5 and 3 g CP/100 g DM was released from lucerne, perennial ryegrass and chicory,
respectively, during ingestive mastication. Release of CP was associated with the concentration of CP
in herbage (R2 = 0.53) supporting the findings of the previous laboratory experiments. When N intake
rate was calculated, delivery of N to the rumen was greatest in cows fed ryegrass (0.79 g N/min)
compared with lucerne and chicory (0.54 and 0.22 g N/min), which would have implications for
microbial utilisation in the rumen. Despite the slower intake rate of chicory compared to lucerne and
ryegrass (46.5 vs. 64.7 and 70.7 g DM/min) the extent of comminution was less in chicory compared to
the other forages (36 vs 44 and 41% of particles reduced to < 4 mm), but the difference was not
associated with any of the herbage characteristics measured in this study, nor was comminution shown
v
This research programme concluded with a simulation study exploring milk-solids (MS) production and
urinary N excretion from cows grazing swards of perennial ryegrass, lucerne, chicory and plantain
grown under increasing rates of N fertiliser (0, 100, 200, 350 and 500 kg N/ha/y) using the data collected
in the second experiment. Predictions of MS production and N excretion by the MINDY model for cows
grazing chicory, ryegrass or plantain, suggests that rates of N fertiliser of 200 kg/ha/y could be the
optimal point for MS production before total daily N excretion increases substantially. As at this
application rate, DMI and MS production predicted for cows grazing chicory was near maximum (15.9
kg DM/cow/d; 1.24 kg MS/cow/d) with little gain achieved through additional N fertiliser but a 100 g
N/cow/d increase in urine N excretion (42% increase) was predicted as N applied increased from 200 –
500 kg N/ha/y. In the case of plantain and ryegrass, while MS production was predicted to increase
beyond the 200 kg N/ha/y fertiliser rate, the amount of N excreted also increased by 65 and 103 g
N/cow/d, respectively (50 and 64%). The simulations also suggest that the addition of N fertiliser to
lucerne swards has little effect on MS but increases urine N excretion, and is thus not recommended.
Overall, the findings of this research program confirm the hypothesis that the release of N from herbage
during comminution differs between forages. This finding can aid explanation of literature that has
demonstrated differences in the N excretion by cows fed diets of different forages, and can help
understanding of N flow in ruminants. The study also suggests that in autumn, there is potential to
manipulate N release from perennial ryegrass, chicory and plantain herbage during maceration and to
reduce N excretion from cows grazing diets of these forages through altering the amount of N applied
to these swards. This information could be used to inform fertiliser management practices, and
development of diets for dairy cows to reduce urinary N loss.
Keywords: biomechanical, cell rupture, chemical composition, chicory, comminution, dairy cow, digestion, forage, ingestive mastication, lucerne, maceration, modelling, nitrogen excretion, nitrogen
vi
Acknowledgements
I wish to thank all my supervisors, Dr. Racheal Bryant, Dr. Garry Waghorn, Dr. Pablo Gregorini and
Dr. David Chapman. Each supervisor had different skills to offer, making this a well rounded
experience. Racheal, your turnaround for reviewing of manuscripts would set records, and I apprecaited
your constructive feedback in shaping arguments. Pablo, thank you for introducing me to modelling and
encouraging me to look at things from a different view. David, thank you for your input and helping me
put findings into context. Last but not least, Garry, your knowledge about things science related and not
is vast. I cannot sufficiently thank you for the time you have given, your support, and encouragement. I
have learnt a lot from being your student (question everything!), and importantly, it has been fun.
I would like to thank DairyNZ. In particular, thank you to Ina Pinxterhuis and David Chapman who
supported my wish to undertake PhD studies and continued that support throughout. Also, thank you to
the DairyNZ academic committee, both for their support academically but also their consideration for
student wellbeing, this is important.
I gratefully acknowledge that this work was completed as part of the Forages for Reduced Nitrate
Leaching programme, that has priniple funding from the New Zealand Ministry of Business, Innovation
and Employment.
I appreciate the eager assistance of the DairyNZ technical team with colleting boli from cattle, and am
even more appreciative of their assistance with the less exciting tasks of chopping, sieving and grinding
several hundred herbage samples. I am very thankful to Barbara Dow and Barbara Kuhn-Sherlock for
their time and statistical expertise.
I gratefully acknowledge my village, that is my family and friends. I started this journey two months
after my beloved husband, Christiaan, passed away unexpectedly. And while the PhD has helped me
through this difficult time, as something to focus on, I could not have done this without your support.
It’s a big village …. I cannot adequately express my gratitude.
I dedicate this PhD to Christiaan. Your belief in me, I carry with me still. My goal is to instil this in our
vii
Table of Contents
Abstract ... iii
Acknowledgements ... vi
Table of Contents ... vii
List of Tables ... x
List of Figures ... xii
List of Plates ... xv
List of Equations ... xvi
List of Abbreviations ... xvii
1 Introduction ...1
1.1 Research objectives ...4
1.2 Hypotheses ...4
1.3 Thesis structure ...4
2 Review of the literature ...7
2.1 Pastoral grazing and the environment ...7
2.2 The nitrogen cycle ...9
2.3 Digestion of forage by dairy cows ...10
2.3.1 Ingestive mastication ... 10
2.3.2 Ruminal degradation and digestion ... 12
2.4 Nitrogen metabolism in the ruminant ...13
2.5 Nitrogen use efficiency ...15
2.5.1 N intake ... 16
2.5.2 Feed chemical composition ... 19
2.5.3 Balancing N and energy supply ... 20
2.6 Factors that influence herbage digestion ...21
2.6.1 Chemical composition of the cell walls ... 22
2.6.2 Herbage biomechanical properties ... 24
2.6.3 Herbage stem : leaf ratio ... 26
2.6.4 The animal... 27
2.7 The potential to manipulate herbage degradation through nitrogen fertiliser management....29
2.8 Conclusion ...29
3 Source of herbage material and techniques for assessing the physical strength of herbage ...31
3.1 Introduction ...31
3.2 Source of herbage ...32
3.2.1 Experimental design ... 32
3.2.2 Climatic conditions ... 35
3.2.3 Management of swards ... 37
3.2.4 Herbage sampling ... 38
3.3 Herbage biomechanical properties ...40
3.3.1 Punch force ... 41
viii
4 The physical and chemical characteristics of forage species, and the comminution of
herbage and release of nutrients during maceration. ... 55
4.1 Introduction ... 55
4.2 Materials and Methods ... 56
4.2.1 Herbage sampling ... 56
4.2.2 Herbage physical characterisation ... 57
4.2.3 Herbage chemical characterisation ... 58
4.2.4 Herbage comminution and cell content release ... 58
4.2.5 Statistical analyses ... 59
4.3 Results ... 60
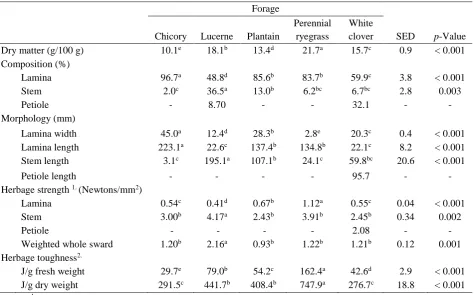
4.3.1 Herbage chemical and physical characteristics ... 60
4.3.2 Characteristics influencing forage biomechanical properties ... 62
4.3.3 Herbage comminution ... 65
4.3.4 Crude protein and water-soluble carbohydrate release ... 66
4.3.5 Predicting crude protein release and herbage toughness ... 71
4.4 Discussion ... 71
4.4.1 Crude protein and water-soluble carbohydrate release ... 72
4.4.2 The biomechanical properties of herbage and the characteristics affecting them. .... 74
4.4.3 Comminution ... 77
4.5 Conclusion ... 78
5 The effect of nitrogen fertiliser rate on herbage characteristics, nitrogen release and degradation of four forages. ... 80
5.1 Introduction ... 80
5.2 Materials and Methods ... 83
5.2.1 Experimental design and harvest dates ... 83
5.2.2 Herbage physical and chemical characterisation ... 84
5.2.3 Herbage comminution and CP and WSC release ... 84
5.2.4 In sacco degradation of herbage ... 84
5.2.5 Statistical analyses ... 85
5.3 Results ... 86
5.3.1 Herbage mass and characteristics ... 86
5.3.2 Crude protein and WSC release with mechanical maceration ... 96
5.3.3 Particle size distribution of macerated herbage ... 98
5.3.4 DM and CP degradation kinetics ... 99
5.4 Discussion ... 104
5.4.1 Herbage physical characteristics ... 104
5.4.2 Herbage chemical composition ... 105
5.4.3 Herbage comminution and release of nutrients ... 109
5.4.4 Dry matter and crude protein degradation ... 110
5.5 Conclusions ... 111
6 Characteristics of ryegrass, lucerne or chicory boli swallowed by dairy cows ... 113
6.1 Introduction ... 113
6.2 Material and methods ... 114
6.2.1 Experimental treatments and animals ... 114
6.2.2 Sward management and animal feeding ... 115
6.2.3 Sampling and measurements on the ingested boli ... 115
6.2.4 Sward characterisation ... 120
6.2.5 Chemical analyses ... 121
6.2.6 Statistical analyses ... 121
6.3 Results ... 122
ix
6.3.2 Characteristics of ingested boli ... 124
6.3.3 Herbage comminution and release of nutrients ... 125
6.3.4 Degradation of dry matter and crude protein in boli ... 128
6.4 Discussion ...129
6.4.1 Effect of species on boli characteristics ... 129
6.4.2 Effect of forage species on comminution of herbage ... 130
6.4.3 Effect of forage species on herbage nutrient release ... 131
6.4.4 Implications for digestion in the rumen ... 133
6.5 Conclusion ...135
7 Simulating ingestive behaviour, N metabolism and N excretion of cows grazing swards fertilised with increasing rates of nitrogen...136
7.1 Introduction ...136
7.2 Materials and Methods ...137
7.2.1 Model ... 137
7.2.2 Model inputs ... 138
7.2.3 Simulation methods ... 140
7.3 Results ...141
7.3.1 Simulated effect of N fertilisation rate on dairy cow ingestive behaviour ... 141
7.3.2 Simulated effect of N fertilisation on N metabolism and partitioning in the dairy cow ... 145
7.4 Discussion ...153
7.4.1 Intake and feeding behaviour ... 154
7.4.2 Nitrogen excretion ... 156
7.4.3 Milk production and NUE ... 157
7.5 Conclusions ...158
8 General Discussion ...159
8.1 Introduction ...159
8.2 Between-species variation in nutrient release during comminution ...161
8.3 The potential to improve nitrogen use efficiency and reduce N excretion ...163
8.4 Future research ...166
Appendix A Detailed methodologies ...168
A.1 Method for measuring the toughness of herbage ...168
Appendix B Supplementary data tables ...173
B.1 Table B.1 Seasonal physical and chemical data of herbage from five species. ...174
B.2 Table B.2. Absolute release (g/100 g DM) of crude protein (CP) and water soluble carbohydrates (WSC) following maceration of herbage from five species during four seasons, and the average of all seasons for each species. ...175
B.3 Table B.3 Morphological composition of herbage from four forages fertilised at four rates of nitrogen in autumn and spring. ...176
B.4 Table B.4 Correlation (R2) between force to punch, maceration energy, water soluble carbohydrate (WSC) and crude protein (CP) release and physcical and chemical characteristics of herbage. ...177
B.5 Table B.5 Distribution of particle fractions (on a DM basis) of macerated material by sieve size from five species. ...178
B.6 Table B.6 Variation in boli characteristics between cows, and effect of age on boli characteristics. ...179
x
List of Tables
Table 2.1 Nitrogen intake, urine N concentration and N partitioning of dairy cows fed diets of forage species. ... 18
Table 2.2 Crude protein (CP) concentration in the DM (g/100 g DM), and distribution between the soluble (A) and degradable insoluble (B) fractions, as well as fractional degradation rate (k, %/h) and lag time (l; hours) of in sacco incubations with fresh (frozen) forages minced to achieve a particle size to resemble rumen contents. From Burke, 2004. .... 26
Table 3.1 Forage, cultivar, sowing rate, number of harvests/annum and N application after each harvest for the 0, 100, 200 and 350 kg N/ha treatments that were used in research presented here. ... 33
Table 3.2 Results of the power analysis calculation describing the effect of measurement number on the standard deviation (SD) and coefficient of variation (CV) of force to punch (Newtons). ... 45
Table 3.3 Mean baseload for each forage minced. ... 50
Table 3.4 Logger output data, with mean current and baseload enabling calculation of net energy requirement/second. ... 51
Table 3.5 Example of calculations to determine energy used to mince fresh herbage, expressed in terms of fresh or dry weight of sample. ... 53
Table 3.6 Mean energy (amp/s) to macerate three sub-samples of herbage from four forages species. ... 54
Table 3.7 Mincing energy required to macerate herbage material (J/g WW) of five forage species. ... 54
Table 4.1 Physical characteristics of the five forages. Data are means of the four sampling dates. 61
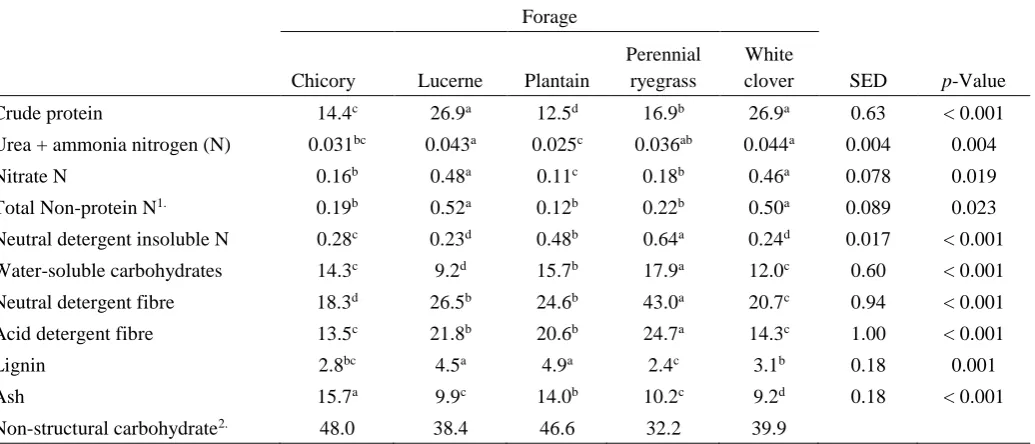
Table 4.2 Chemical concentration (g/100 g) of herbage from five forages. Data are means of the four sampling dates. ... 62
Table 4.3 Correlation coefficient (R2) between herbage strength (Newtons/mm2) and the dry matter
(DM, %) content, neutral detergent fibre (NDF) and acid detergent fibre (ADF) concentration (g/ 100 g DM) of when all five forages were included in the analysis and within individual forages. Figures in bold are significant at the 95% confidence level, and figures in italics are denote a negative relationship. ... 63
Table 4.4 Coefficients for the relationship (R2) between herbage toughness (maceration energy, J/g
fresh weight (FW)) and the dry matter (DM, %) content, neutral detergent fibre (NDF), acid detergent fibre (ADF) and lignin concentration (g/ 100 g DM) of herbage from five forages individually and the five combined. Figures in bold are significant at the 95% confidence level, and figures in italics are denote a negative relationship. ... 63
Table 4.5 Distribution of particle fractions (on a DM basis) of macerated material by sieve size from five forages. Data are means of the four sampling dates. ... 65
Table 4.6 Coefficients for the relationship (R2) between herbage physical and chemical
characteristics and crude protein release during maceration of herbage. Figures in bold are significant at the 95% confidence level. Figures in italics denote a negative relationship. ... 69
Table 4.7 Coefficients for the relationship (R2) between herbage physical and chemical
characteristics and water soluble carbohydrate release during maceration of herbage. Figures in bold are significant at the 95% confidence level. ... 71
Table 5.1. Amount of nitrogen applied after each harvest for each species and treatment. ... 83
xi
Table 5.3 Concentrations of crude protein and nitrogen fractions (g/100 g DM) in chicory, lucerne, plantain and perennial ryegrass herbage harvested in autumn and spring from swards fertilised at four rates of nitrogen fertiliser. ...94
Table 5.4 Concentration of neutral detergent fibre and water-soluble carbohydrate (g/100 g DM) in chicory, lucerne, plantain and perennial ryegrass herbage harvested in autumn and spring from swards fertilised at four rates of nitrogen fertiliser. ...95
Table 5.5 Effect of rate of nitrogen (N) fertilisation on the soluble (A) and degradable insoluble (B) fractions (%) and rate of degradation of the B fraction of dry matter in chicory, lucerne, plantain and perennial ryegrass herbage collected in autumn. ...101
Table 5.6 Effect of rate of nitrogen (N) fertilisation on the soluble (A) and degradable insoluble (B) fractions and rate of degradation of the B fraction of crude protein in chicory, lucerne, plantain, and perennial ryegrass herbage collected in autumn. ...102
Table 6.1 Physical and chemical characteristics of the chicory, lucerne and perennial ryegrass offered. ...123
Table 6.2 Characteristics of ingested boli and intake rate of dairy cows fed chicory, lucerne or perennial ryegrass indoors. ...124
Table 6.3 Differences between characteristics of ingested boli from dairy cows fed chicory, lucerne or perennial ryegrass sampled at three times during a meal. ...125
Table 6.4 Proportion of size distribution of masticated particles from cows offered chicory, lucerne or perennial ryegrass; and the distribution of particle sizes (mm) of those retained on the top sieve (4 mm). ...126
Table 6.5 Proportion of nutrient release from chicory, lucerne and perennial ryegrass during mastication by dairy cows indoors during three sampling times during one meal and the mean of all times. ...127
Table 6.6 Dry matter (DM) and nitrogen (N) degradation characteristics of chicory, lucerne and ryegrass herbage by in sacco digestion. Degradation characteristics are defined by soluble (A), degradable insoluble (B), potentially degradable (P), and undegraded (U) fractions, and the degradation rate of the B fraction (k, %/h). ...128
Table 7.1 Chemical composition, nutritive and physical characteristics of herbage from the four species and five rates of fertiliser N application (kg N/ha/y) used in the simulations. ...139
Table 7.2 Values used to initialise MINDY ...140
Table 7.3 Predicted daily mean and standard deviation of the number of jaw movements per bolus, bolus weight (g), bolus swallowing frequency (number of boli per minute) and herbage intake rate of cows fed herbage of four forage species fertilised at five rates of fertiliser N. ...142
xii
List of Figures
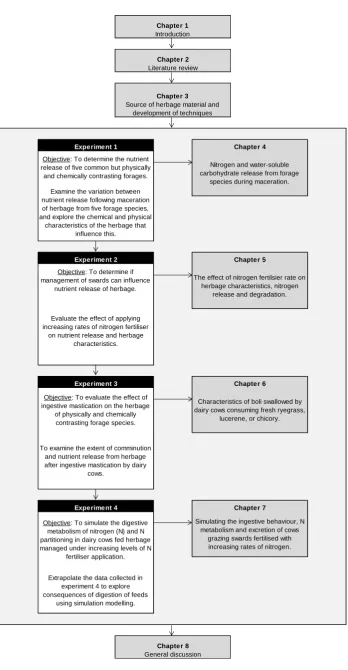
Figure 1.1. Diagrammatic representation of thesis structure. ... 6
Figure 2.1. National trends in nitrogen load excreted to land (t/y) from all stock types for the period 1990 – 2011 in New Zealand. Sourced with permission: Scarsbrook and Melland (2015). ... 8
Figure 2.2 A generalised depiction of the nitrogen cycle within livestock grazing systems. (Adapted from: Tamminga, 1992; Johnson et al., 2005). ... 10
Figure 2.3 Digestive system of the cow. Sourced with permission: Wattiaux and Howard (1999) . 12
Figure 2.4 Overview of nitrogen metabolism in the ruminant. Sourced with permission: Pacheco and Waghorn (2008). ... 15
Figure 2.5. Relationship between total N intake and faecal, urinary and milk N outputs. Sourced with permission: Kebreab et al., (2001). ... 17
Figure 2.6 Theoretical intra-ruminal rates of ammonia release from non-protein nitrogen (NPN), soluble and insoluble proteins after eating forages. Adapted from: Johnson (1976). .. 20
Figure 2.7 Neutral detergent fibre (NDF) degradation curves for eight forage types evaluated in sacco. Bars are standard errors of the mean at each time; data sourced with permission from Burke (2004). ... 22
Figure 2.8 Crude protein (CP) degradation curves for eight forage types evaluated in sacco. Bars are standard errors of the mean at each time; data sourced with permission from Burke (2004). ... 25
Figure 3.1 Example of the layout of one block of the Critical N study. Main plots (sward type) are denoted by different colours. ... 34
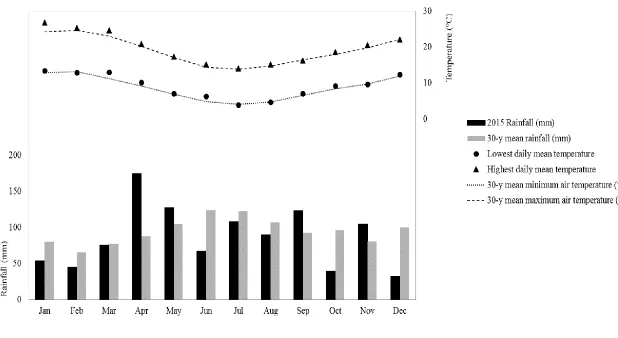
Figure 3.2 Total monthly and annual rainfall (mm) and mean maximum and minimum air temperatures (°C) each month during the experimental period (2015) and the long term 30-y average. Data recorded at the Ruakura Meteorological station, 5 km from trial site. ... 36
Figure 3.3 Diagram illustrating the configuration for measuring punch force. NB: not to scale. .... 43
Figure 3.4 Cold start test of mincer. Legend details whether the machine was started cold (time = 0) or the number of minutes lapsed between stopping the mincer and restarting to measure (i.e. Time = 1, 2, 4 …24 minutes). Bars represent standard error. ... 48
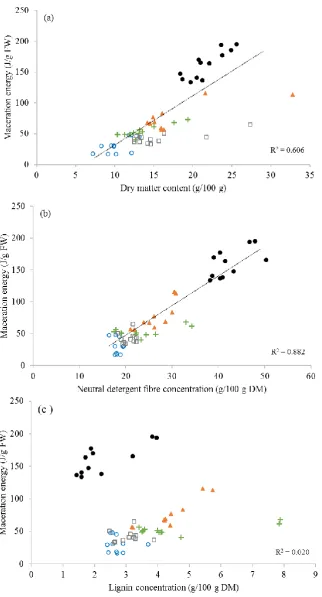
Figure 4.1 The correlation between herbage toughness (maceration energy, J/g fresh weight (FW)) and herbage dry matter content (a), neutral detergent fibre (b), and lignin concentration (c) (g/100 g) of five forages: chicory (○), lucerne (▲), plantain (+), perennial ryegrass (●) and white clover (□). ... 64
Figure 4.2 Relationship between the proportion of large particles in macerated material and herbage strength (Newtons/mm2), lignin and NDF concentration from perennial ryegrass
herbage. ... 66
xiii
Figure 4.4 The relationship between the proportion of crude protein release and herbage crude protein concentration (g/100 g) of five forages: chicory (○), lucerne (▲), plantain (+), perennial ryegrass (●) and white clover (□). ... 70
Figure 4.5 The relationship between the proportion of crude protein loss and herbage dry matter content (%) of five forages: chicory (○), lucerne (▲), plantain (+), perennial ryegrass (●) and white clover (□). ... 70
Figure 5.1 Generalised relationship between the amount of fertiliser N applied (kg N/ha) and herbage yield and nitrate leaching (Adapted from: DEFRA, 2011, © Crown copyright 2010). 82
Figure 5.2 Herbage DM content (1), and mass (2) determined in autumn (A), and spring (S) for swards of chicory (○), lucerne (▲), perennial ryegrass (●), and plantain (+). Bars indicate standard error and R2 values are given when the relationship is significant (P <
0.05). Trend lines are presented when the main effect of N fertiliser rate was statistically significant. ... 87
Figure 5.3 Leaf width (1) and length (2) of herbage collected in autumn (A) and spring (S) from swards of chicory (○), lucerne (▲), perennial ryegrass (●), and plantain (+). Bars indicate standard error, and trend lines and R2 values are given when the relationship is
significant (P < 0.05). ... 90
Figure 5.4 Strength of leaf (1) and herbage (2), and herbage toughness (3) of herbage collected in autumn (A) and spring (S) from swards of chicory (○), lucerne (▲), perennial ryegrass (●), and plantain (+). Bars indicate standard error, and trend lines R2 values are given
when the relationship is significant (P < 0.05). ... 92
Figure 5.5 Ratio of water soluble carbohydrate (WSC): crude protein (CP) (1) and Non-structural carbohydrate1 (NSC): CP (2) plotted in relation to the N fertiliser application rate from
herbage collected in autumn (A) and spring (S) from chicory (○), lucerne (▲), plantain (+) and perennial ryegrass (●). Bars indicate standard error, and trend lines R2 values
are given when the relationship is significant (P < 0.05). ... 97
Figure 5.6 Crude protein (CP) release (g/100 g DM) during maceration of herbage collected in autumn (A) and spring (B) from swards of chicory (○), lucerne (▲), plantain (+) and perennial ryegrass (●). Bars indicate standard error, and trend lines R2 values are given
when the relationship is significant (P < 0.05). ... 99
Figure 5.7 In sacco degradation of crude protein (CP) from macerated herbage of chicory (a), lucerne (b), plantain (c) and ryegrass (d) receiving nitrogen fertiliser application rates of 0 (light grey), 100 (dark grey), 200 (dashed black line) and 350 (black line) kg N/ha/y. ... 103
Figure 7.1 Predicted dry matter (a) and nitrogen (b) intake of dairy cows grazing swards of chicory (○), lucerne (▲), plantain (+) and perennial ryegrass (●) fertilised with increasing rates of nitrogen. ... 141
Figure 7.2 Predicted proportional distribution of large (>4.8 mm; ■), medium (1.2 – 4.8 mm; ■) and small (< 1.2 mm; □) particles of herbage in swallowed boli from dairy cows fed chicory (a), lucerne (b), plantain (c) and perennial ryegrass (d) herbage fertilised at five rates of N fertiliser. ... 144
Figure 7.3 Predicted daily mean rumen ammonia (a) and plasma urea nitrogen (b) concentrations of dairy cows fed diets of chicory (○), lucerne (▲), plantain (+) and perennial ryegrass (●) fertilised with increasing rates of nitrogen. ... 146
xiv
Figure 7.5 The predicted effect of increasing N fertiliser rate applied to swards of chicory(a), lucerne (b), plantain (c), and perennial ryegrass (d) on the concentration of urea in urine (open symbols) and total daily urinary N excretion (closed symbols). ... 149
Figure 7.6 Simulated relationship between N intake and rumen ammonia (a) concentration, and daily urinary N excretion (b) of dairy cows fed chicory (○), lucerne (▲), plantain (+) and perennial ryegrass (●). ... 150
Figure 7.7 The predicted effect of increasing N fertiliser rate applied to swards of chicory (○), lucerne (▲), plantain (+) and perennial ryegrass (●) on milk yield (a), milk solids yield (b) and (c) the nutrient use efficiency (NUE) of dairy cows. ... 152
Figure 7.8 The predicted relationship between milk production and dry matter (a) and nitrogen intake (b) of dairy cows grazing swards of chicory (○), lucerne (▲), plantain (+) and perennial ryegrass (●). ... 153
Figure 8.1 The correlation (R2) between the proportion of crude protein (CP) released and herbage CP concentration (g/ 100g DM) from five species. Equation: y = -0.0011x2 + 0.0656x –
xv
List of Plates
Plate 3.1 A view of one replicate of the experiment showing sward main plots (54 m long and 9 m wide)
………..………...………..35
Plate 3.2 Haldrup harvester sampling a lucerne main plot ………..………... 39
Plate 3.3. Digital force gauge with a plantain leaf in position on the die block……….…………42
Plate 3.4 Arrangement of the logger (A), laptop (B) and mincer (C). NB: mincing head not attached 46 Plate 3.5 Mincer fitted with mincing head (containing screw, cutter blades and sieve plate), surrounded by ice box, and sample tray……….. 47
Plate 3.6 Graphical output of logged current showing the initial peak of current consumption at start, then the decline in energy consumption over time. The four peaks show the four times the mincer was turned on during the logging period ……….… 49
Plate 6.1. Collected boli in tared sample trays, illustrating their intact form ……….……….……… 116
Plate 6.2. Material retained on each sieve from a chicory boli after drying ……….………….. 118
Plate 6.3. An example of wet-sieved material from the top sieve (4 mm) spread out for fragment length measurement ………..…… 119
Plate A.1.1 Configuration of connected logger ……….…………... 168
Plate A.1.2 Logger screen ………...………..…….…. 170
Plate A.1.3 Logger screen configuration of mincer attachments ………..….…. 170
Plate A.1.4 Mincer with ice box and sample tray attached ………....….…… 171
xvi
List of Equations
Equation 3.1 Punch force = MF/Area ………..………... 41
Equation 3.2 Current to mince forage (amp/s) = current energy (amp/s) – baseload current (amp/s) ……….………. 50
Equation 3.3 Amp/g WW = WW / SA ……….…… 52
Equation 3.4 Amp/ g DW = SA /((WW / 100) × DM) ………..……….. 52
Equation 3.5 Energy in watts = amps × volts ………..……….... 52
Equation 4.1 NSC = 100 – (CP + NDF + Ash + Lipid) ………61
Equation 5.1 𝑦 = 𝐴 + 𝐵 (1 − 𝑒^(−𝑘𝑡 − 𝑑√𝑡) ) ………..…...…….83
Equation 6.1 Herbage content of bolus (F) = ((b – (Y × Bw))/ X – Y) …………..….………….. 117
Equation 6.2 Saliva content of bolus = Bw – F ………..….……….. 117
xvii
List of Abbreviations
Abbreviation Description
°C Degrees Celsius
A Soluble fraction in an in sacco digestibility study
a.i. Active ingredient
ADF Acid detergent fibre
ANOVA Analysis of variance
B Degradable insoluble fraction in an in sacco digestibility study
Bw Bolus wet weight
BW Body weight
c Cow
CC Cell contents
CHO Carbohydrate
CP Crude protein
CPS Soluble crude protein
CV Coefficient of variation
d Day
DM Dry matter
DMY Dry matter yield
DW Dry weight
F Force
FV Feed value
FW Fresh weight
g Gram
h hour
ha Hectare
J Joule
k Fractional degradation rate in an in sacco digestibility study
kg Kilogram
km kilometre
L Litre
LSD Least significant difference
m Meter
m2 Meter square
ME Metabolisable energy
MF Maximum force applied (Newtons)
min Minute
mm Millimetres
MPS Microbial protein synthesis
N Nitrogen
n Number
NDF Neutral detergent fibre
NFC Non fibre carbohydrate
xviii
Abbreviation Description
NDIN Neutral detergent insoluble nitrogen
NIRS Near infrared spectroscopy
NPN Non-protein nitrogen
NSC Non-structural carbohydrate
NUE Nutrient use efficiency
NV Nutritive value
P Potentially degradable fraction in an in sacco digestibility study
PSD Particle size distribution
RDP Rumen degradable protein
s Second (time)
SA Sum of amps
SC Structural carbohydrate
SD Standard deviation
SE Standard error
SED Standard error of the difference
SEM Standard error of the mean
TMR Total mixed ration
TP True protein
U Undegraded fraction in an in sacco digestibility study
UDP Undegradable crude protein
V Volt
VFA Volatile fatty acids
WSC Water soluble carbohydrate
WW Wet weight
1
1
Introduction
Dairy farming in New Zealand is based on the rotational grazing of pasture swards, commonly
comprised of a binary mixture of perennial ryegrass (Lolium perenne L.) and white clover
(Trifolium repens L.). This is because the climate and physical environment of the main dairying
regions allow for growth of these species for most of the year (Valentine and Kemp, 2007),
providing a relatively low cost feed system (Dillon et al., 2005). Swards are typically grazed in a
vegetative state in order to maximise herbage yield and nutritive value, but this also results in
high (> 18%) herbage crude protein (CP; nitrogen × 6.25) concentration (Ulyatt, 1997), and
consumption of dietary CP in excess of livestock requirements (Kolver, 2000; NRC, 2001).
Furthermore, dairy cows poorly utilise dietary nitrogen (N). Studies investigating the amount of
dietary N used for milk production equates to only 20 – 30% of N consumed when fed ryegrass
(Van Vuuren et al., 1993; Astigarraga et al., 1994; Peyraud et al., 1997). Any dietary N not utilised
is excreted in the urine and faeces, at a metabolic cost to that animal, and is a source of
environmental pollution (Scholefield et al., 1993; Pacheco and Waghorn, 2008).
The environmental issue involves scale, as New Zealand currently has about 6.6 million dairy
cows (StatisticsNZ, 2016). One dairy cow consuming 15 kg DM per day, containing 18% CP in
mid-lactation will consume 430 g of nitrogen (N) and excrete approximately 160 g N/day in the
urine; that same cow consuming more, higher CP containing herbage (18 kg DM at 29% CP) will
excrete approximately 520 g N/day in the urine (Waghorn et al., 2007). Generally, as the amount
of N excreted increases, the concentration of N in urine increases. Then depending on the
concentration of N in urine, the volume urinated and the area the urine is spread over, the N
loading rate in a urine patch can be very high. In a review of the literature, Selbie (2014)
determined that the rate of N loading can range between 200 – 2000 kg N/ha, and the main factor
influencing this is urine N concentration, which in turn, is largely driven by dietary CP intake.
2
N not used by plants that is at risk of leaching to groundwater. Therefore, the number of animals
and the CP concentration of their diet influence N leaching risk.
Currently, there is considerable social pressure to improve the quality of New Zealand’s
freshwater resources. Regional councils are obliged to establish targets for fresh water quality
under the 2014 National Policy Statement for Freshwater Management that must be implemented
by 2025 (NZGovernment, 2014). However, the New Zealand dairy industry is worth $14
billion/year, contributing 36% to revenue from primary industries (StatisticsNZ, 2017).
Ruminants also play a vital role in global food supply by converting feed that is inedible to
humans into high value protein for human consumption, the demand for which is increasing
(Dijkstra et al., 2011; Lee et al., 2015c). A compromise is needed between maintaining or
improving productivity and profitability while minimizing environmental impact. It is for this
reason, that agricultural industry strategies implemented in the past decade have included focus
on sustainable production, and research is required to help achieve this.
Options for reducing N excretion per cow include lowering the CP content of the diet and
improving the efficiency of N use for livestock production (i.e. conversion of dietary N to N in
milk or tissue). Reducing CP content in the diet of grazing cows may be achieved through the use
of forage species that contain lower concentrations of CP in herbage compared with
ryegrass/clover mixtures, or potentially, through managing the N fertiliser applied to swards.
Increasing N fertiliser application to ryegrass swards increases ryegrass herbage CP concentration
(Goswami and Willcox, 1969), but there is less information about how N fertiliser application
affects the CP concentration, and the forms that make up that CP (i.e. NPN, CP fractions), of other
common forage species (i.e. chicory, Cichorium intybus; and plantain, Plantago lanceolata).
Similarly, NUE can theoretically be improved by feeding species that have more optimally
balanced CP and water-soluble carbohydrate (WSC) concentrations in their herbage (Phuong et
al., 2013). Parsons et al. (2011) suggested that reduction in urinary N excretion is observed when
the WSC to CP ratio exceeds 0.7. While the chemical composition of ryegrass has been widely
researched, exploration of the chemical composition of other forage species, and the potential to
3
Livestock nutrient use efficiency (NUE) may also be influenced by the rate and extent of nutrient
supply to the rumen. Several studies have described the ruminal degradation of feeds (Burke et
al., 2000; Burke, 2004; Chaves et al., 2006; Hammond et al., 2014), but less is known about
nutrient release in the preceding step, that is, during ingestion. Ingestion is the first step in feed
degradation and involves prehension of the herbage, then comminution by mastication and
manipulation of the herbage into a bolus that can be swallowed. Waghorn et al. (1989) et al.
suggested between 50 – 70% of cells are ruptured during ingestion. In grazed forages, most
nitrogenous compounds and all soluble carbohydrates are contained within the plant cell walls,
and are available to the rumen microflora once cells are ruptured. Therefore, the extent and pattern
of cell rupture influences delivery of nutrients to the rumen pool. Boudon et al. (2001, 2006)
investigated the release of nutrients from perennial ryegrass by ingestive mastication of dairy
cows and determined that different nutrients were more readily released than others. While Acosta
et al. (2007) demonstrated that the degree of comminution and the amount of nutrient released
from perennial ryegrass, tall fescue and white clover during ingestion by dairy cows, differed
between forages (P < 0.05). Expanding upon this research to include other forages would improve
our understanding of nutrient utilisation. Neither Acosta et al. (2007) or Boudon et al. (2001,
2006) were able to conclusively determine what particular characteristics of the herbage
influenced degree of communion or nutrient release. Pond et al. (1984a), when investigating the
variation in extent of comminution between Coastal bermudagrass (Cynodon dactylon) and
perennial ryegrass stated that: “There is a need for considering the animals influence as well as
the structural influence of various forages in order to achieve a more complete understanding of
the forage x livestock interaction.” In addition, there is no known researching investigating
whether N fertiliser management could influence nutrient (primarily, N) release during ingestion.
Therefore, the aim of this study was to define the physical and chemical characteristics of
common forage species, and relate these to the extent of comminution and release of nutrients.
The effect of rate of N fertiliser application to swards on herbage characteristics will be explored.
This understanding is required to determine whether efficiencies in nutrient use can be improved,
4
1.1
Research objectives
1. To quantify the variation in nutrient release from herbage of five common forage species
when macerated, and define the characteristics of herbage that influence nutrient release.
2. To quantify the effect of nitrogen fertiliser application rate on herbage characteristics,
comminution and release of nutrients.
3. To evaluate the effect of ingestive mastication on herbage from forage species which are
physically and chemically contrasting.
4. To integrate data into a mechanistic simulation model to predict feeding behaviour,
nitrogen metabolism, and partitioning of N from dairy cows fed diets of different forage
species grown under a range of N fertiliser application rates.
1.2
Hypotheses
1. H0: The extent of herbage nutrient release differs between species.
2. H0: Relationships exist between herbage characteristics and the extent of comminution
and nutrient release during maceration.
3. H0: The extent of release of nutrients from herbage during maceration can be manipulated
through N fertiliser management.
4. H0: Predictions of dairy cow N metabolism and excretion will vary when grazing species
grown under variable N fertiliser management regimes.
1.3
Thesis structure
This thesis consists of 8 Chapters. Chapter 2 reviews the literature with particular reference to the
characteristics of forage species that influence herbage degradation and N metabolism in the dairy
cow. Chapter 3 details the experimental site and management of the field plots from which
herbage material was obtained. The development of methods for assessing the biomechanical
properties is also outlined in Chapter 3. The following Chapter (Chapter 4) aims to quantify the
5
seeks to define the characteristics of herbage that influence nutrient release and comminution of
herbage during mechanical maceration in the laboratory. In Chapter 5, the relationship between
nutrient release and the application of nitrogen fertiliser management is explored. Chapter 6
investigates the effects of ingestion by dairy cows on herbage comminution and nutrient release.
The final experimental Chapter (Chapter 7) uses data collected in Chapter 4 in a modelling
simulation exercise to predict the feeding behaviour and nitrogen metabolism of dairy cows fed
herbage grown under a range of N fertiliser application rates. A diagrammatic representation of
6
Figure 1.1. Diagrammatic representation of thesis structure.
Objective: To determine if management of swards can influence
nutrient release of herbage.
The effect of nitrogen fertilsier rate on herbage characteristics, nitrogen
release and degradation.
Evaluate the effect of applying increasing rates of nitrogen fertiliser
on nutrient release and herbage characteristics. Chapter 1 Introduction Chapter 2 Literature review Chapter 3 Source of herbage material and
development of techniques
Experiment 1 Chapter 4
Objective: To determine the nutrient release of five common but physically and chemically contrasting forages.
Nitrogen and water-soluble carbohydrate release from forage
species during maceration. Examine the variation between
nutrient release following maceration of herbage from five forage species, and explore the chemical and physical
characteristics of the herbage that influence this.
Experiment 2 Chapter 5
Objective: To simulate the digestive metabolism of nitrogen (N) and N partitioning in dairy cows fed herbage managed under increasing levels of N
fertiliser application.
Simulating the ingestive behaviour, N metabolism and excretion of cows
grazing swards fertilised with increasing rates of nitrogen.
Extrapolate the data collected in experiment 4 to explore consequences of digestion of feeds
using simulation modelling.
Chapter 8 General discussion
Experiment 3 Chapter 6
Characteristics of boli swallowed by dairy cows consuming fresh ryegrass,
lucerene, or chicory.
Experiment 4 Chapter 7
Objective: To evaluate the effect of ingestive mastication on the herbage
of physically and chemically contrasting forage species.
To examine the extent of comminution and nutrient release from herbage after ingestive mastication by dairy
7
2
Review of the literature
This review is concerned with the characteristics of forage species that influence how herbage
from these is degraded during ingestion and ruminal digestion by dairy cows in a pastoral grazing
environment. Published research on forage physical characteristics and herbage chemical
composition, with relevance to digestion and utilisation of nutrients is summarised and discussed.
Of particular interest are herbage characteristics that influence degradation and nutrient release
during the initial phases of digestion (ingestion and ruminal degradation), and to what extent this
can be manipulated through sward management. Understanding these parameters may allow
greater understanding of, and improvements in nutrient use efficiencies in relation to diet and
indicate opportunities for reduction of nitrogen excretion.
2.1
Pastoral grazing and the environment
Grazed swards provide the bulk of the feed on dairy farms in New Zealand. The dominant sward
type is based on perennial ryegrass (Lolium perenne L.), commonly sown in mixture with white
clover (Trifolium repens L.). Perennial ryegrass (ryegrass)-based swards are extensively used
because they are easy to establish, can produce large amounts of good quality feed and are tolerant
of grazing (Kemp et al., 2000b). In order to maximise production (i.e. dry matter and milk-solids
yield) from ryegrass-based swards, they are grazed during the vegetative growth phase and
commonly grown with the addition of nitrogen (N) fertiliser to promote growth. These
management practices tend to produce herbage with high concentrations of N (Ulyatt, 1997;
Lambert et al., 2004). Herbage with high concentrations of N (3.2 g/100g DM; 20% CP) can mean
that dietary N supplied to the animal exceeds their physiological demand for maintenance and
production (Tamminga, 1992b). Excess dietary N is excreted. Nitrogen metabolism and the
efficiency of N utilisation by ruminants is discussed further in sections 2.4 and 2.5.
In New Zealand, N loss from agricultural systems has been identified as a main contributor of
8
(from 3.8 million cows in 1994 to 6.6 million in 2016), stocking rate (cows/ha), and by the amount
of N fertiliser used (WRC, 2015; StatisticsNZ, 2016; 2017). Trends in the N loading to land from
agricultural systems indicate that the contribution from dairy has been increasing (Figure 2.1.)
(Scarsbrook and Melland, 2015). Over a similar period, monitoring of fresh water bodies in New
Zealand has shown a trend for declining water quality (i.e. elevated nutrient loading and
eutrophication) (Verburg et al., 2010; Ballantine and Davies-Colley, 2014). Consequently, it has
become a priority for the New Zealand government to improve the management of freshwater
resources, and has done so by compiling a National Policy Statement for Freshwater Management
that requires all regional councils to develop objectives for water quality which must be
implemented by 2025 (NZGovernment, 2014). Alongside this, the dairy industry has also deemed
research into the reduction of N loss a high priority (DairyNZ, 2014b).
In order to understand how N loss may be minimised, the flow of N through agricultural systems
must be understood.
Figure 2.1. National trends in nitrogen load excreted to land (t/y) from all stock types for the period 1990 – 2011 in New Zealand. Sourced with permission: Scarsbrook and
9
2.2
The nitrogen cycle
Figure 2.2 illustrates the generalised flow of N in agricultural systems based on grazing livestock.
Briefly, N enters the N cycle in soil through decomposition of organic matter, deposits of excreta
from livestock and by the application of fertilisers. These N inputs are converted to ammonia
(NH3) then ammonium (NH4+) by the process of ammonification. Because ammonification is a
biological process, the rate will vary depending on soil temperature, moisture and aeration.
Ammonium ions may be absorbed by plants, fixed to clay or undergo nitrification by
microorganisms and converted to nitrate (NO3-). Nitrate is the most plant available form of N, but
because it is negatively charged like clay particles, it is not adsorbed by the soil. Therefore, any
nitrate that is not taken up by plants is susceptible to loss from the soil via runoff or leaching. The
rate of nitrate leaching depends on plant uptake, soil drainage and rainfall. Nitrate that is not
leached or used by plants may undergo denitrification and be released to the atmosphere as gas
which can also be a source of environmental pollution (Whitehead, 1995; Johnson et al., 2005).
Efficient N management occurs when there is adequate N available to plants during periods of
active growth (and thus N uptake), and minimising excess N that will lead to losses to the
environment. The main source of nitrate leaching under grazing systems is that from livestock
urine, and to a lesser extent directly from N fertiliser application (Ledgard et al., 1999b).
Consequently, reducing the amount of N lost via excretion has become a focus of research
10
Figure 2.2 A generalised depiction of the nitrogen cycle within livestock grazing systems. (Adapted from: Tamminga, 1992; Johnson et al., 2005).
2.3
Digestion of feed by dairy cows
For the purpose of this review, a forage plant is defined as a plant that is grown to be utilised by
grazing livestock in situ (adapted from definitions by Givens (2000) and Fageria (1997)). In New
Zealand, common forage species fall into the categories such as: grasses, herbaceous legumes and
herbs (Stewart et al., 2014).
Dairy cows are ruminants, as such, their gastrointestinal tract is characterised by a
four-compartment stomach, including the rumen (or reticulo-rumen) from which the animals
regurgitate and re-chew their food (rumination) (Figure 2.3). The degradation of feed by
ruminants involves two consecutive stages: ingestive mastication and ruminal degradation.
2.3.1
Ingestive mastication
Mastication (i.e. chewing) is the integral first step of the digestion of feed. Structural damage to
the plants outer layer (epidermis) by mastication allows microbial access to inner tissues that
would otherwise only be accessible via the stomata (Cheng et al., 1980; Wilson, 1993). While
ruminants can regurgitate and re-chew feed, ingestive mastication plays a significant role in
reducing herbage fragment size and increasing surface area of herbage material for microbial
11
fragment size also contributes to the formation of a bolus that is able to be swallowed. Waghorn
et al. (1989) showed that mastication reduced 61% of lucerne and 46% of ryegrass to a size able
to pass a 2 mm sieve; while Lee and Pearce (1984) demonstrated that up to 50% of dry feed (straw
or hay) was reduced to fragment sizes less than 1 mm during mastication. These studies indicate
that there is considerable variation in the effect of ingestive mastication on herbage between
forages or feed types (i.e. fresh vs. conserved). The characteristics of herbage contributing to this
variation and influences on subsequent degradation and utilisation of nutrients, however, are less
well understood.
A further function of mastication is the rupture of plant cells and release of nutrients that can then
be fermented by microbes. Waghorn and Clark (2004) reported that between 50 – 80% of herbage
cells are ruptured during mastication. Since a large proportion of plant readily fermentable
nutrients (i.e. N and carbohydrate, CHO) are encapsulated within the plant cell walls, the extent
and pattern of cell rupture by mastication impacts the supply of nutrients to the rumen. Which in
turn, effects rate and extent of rumen fermentation and the utilisation of nutrients (Sauvant and
Van Milgen, 1995). Published data on nutrient release from herbage by mastication ranges from
22 – 86% depending on the both the species and the nutrient (Reid et al., 1962; Waghorn and
Shelton, 1988; Boudon et al., 2002). Boudon and Peyraud (2001) showed that 60% of fermentable
carbohydrate were released during mastication, but only 30% of chlorophyll (where much of the
intracellular N is contained) was released, largely owing to the larger size of the molecule. Again,
the variation in nutrient release between plant species is large and the reasons for this not well
understood. Improving our knowledge of how different species are degraded during mastication
12
Figure 2.3 Digestive system of the cow. Sourced with permission: Wattiaux and Howard (1999)
2.3.2
Ruminal degradation and digestion
The rumen is anaerobic and inhabited by a complex and diverse population of symbiotic
microorganisms (bacteria, archaea, protozoa and fungi) that degrade plant structural fibre and
protein that the cow would otherwise be unable to digest by its own enzymes (Czerkawksi, 1986).
Feeding the cow is to feed the microorganisms, as it is the end products of microbial digestion
(volatile fatty acids (VFA) and amino acids), lipids and the microbes themselves that provide
nutrition to the cow. For example, VFA production from microbes provides 70% of the energy
absorbed by the cow (Waghorn and Clark, 2004), and bacteria are responsible for the degradation
of much of the dietary protein into forms useable by the cow (section 2.4).
Nutrients are broken down by microbes in the rumen by the combined processes of solubilisation
and degradation. Solubilisation is the release of nutrients from plant cells during ingestion and
rumination. Solubilised nutrients, including proteins and fermentable CHO, are almost
immediately degraded, with rates of 300 and 200%/hr respectively reported (Mangan, 1982;
Weisbjerg et al., 1998). Degradable proteins are also released via cell rupture but are degraded
more slowly, 4 – 47%/hr (Min et al., 2000). A rapid degradation of protein following mastication
could result in excessive amounts of ammonia accumulating in the rumen (Attwood et al., 1998)
13
The degradation phase occurs when swallowed particles enter the rumen, and are mixed with
digesta by a series of contractions, bringing the newly ingested herbage into contact with the
microbiota. The rumen microbial population consists of species of bacteria, protozoa, fungi and
archaea, and may be either free in the rumen liquid or attached to feed particles. The plant cell
wall matrix is degraded by adherent microbes secreting enzymes which reduce the carbohydrates
into monomers (by hydrolysis) which are then transported into the microbial cell for their own
metabolism, generating end products such as VFAs, that the host animal can use (Nagaraja, 2016).
Further particle size reduction occurs with rumination (Poppi et al., 1980; Noziere et al., 2010)
and to a small extent by microbial degradation (Murphy and Nicoletti, 1984; Wilson et al., 1989a;
Wilson et al., 1989b). Particles remain in the rumen for varying lengths of time depending on
their degradation rate and the passage rate of material out of the rumen (~ 20 – 48 hours for fibre
particles). To enable passage of particles out of the bovine rumen, generally particles must be
reduced to a size able to pass a sieve with a 2.0 mm aperture (Waghorn and Clark, 2004). Thus
the rate that particles are degraded influences their retention time of the particles in the rumen and
the rate of nutrient release from the herbage. This in turn, affects how much of the potentially
degradable nutrients are degraded i.e. particles may flow from the rumen before they have been
fully degraded (Gill et al., 1966).
Particles that have been reduced to a size able to pass from the rumen, flow with the liquid into
the omasum and to the fourth compartment, the abomasum. The abomasum is similar to
monogastric stomachs where acids and enzymes are secreted to continue the digestive process.
Further absorption and digestion of protein, lipids and fibre occurs in the small intestine and in
the hind gut where further fermentation and water absorption takes place, after which undigested
material is excreted.
2.4
Nitrogen metabolism in the ruminant
The pathways of N metabolism are illustrated in Figure 2.4.Dietary protein can be divided into
that which is potentially degradable in the rumen (RDP) and that which cannot be degraded
14
protein (TP) N or non-protein N (NPN). Non-protein N consists of N present in DNA and RNA,
amides, amines, free amino acids, urea and nitrate (Tamminga, 1986). Degradation of dietary N
involves catabolism of protein by microbial proteases into peptides and amino acids, some of
which are eventually deaminated into ammonia N which can be used for microbial growth
(provided there is a supply of energy) and become incorporated into microbial protein (McNabb
et al., 1996; Bach et al., 2005) i.e. the protein in rumen microflora. If the ammonia is not used for
microbial protein synthesis (MPS), it will be absorbed into the bloodstream. Consequently, the
concentration and rate of ammonia production in the rumen can reflect both the amount of soluble
and the degree of degradable N in the diet (Huntington and Archibeque, 2000). Ammonia
absorbed is processed into urea in the liver and excreted in the urine, at an energetic cost to the
animal of 30 kJ ME/g N (Tyrrell et al., 1970; Waghorn et al., 2007). If dietary N is insufficient,
however (< 1.2 g N/100 g DM; Minson (1991)), urea can be recycled via saliva back into the
rumen to support microbial growth for several weeks.
Forage species generally contain high amounts of potentially degradable protein (rumen
degradable protein, RDP) (> 70%), and degradation of N in the rumen is typically extensive
(Beever and Siddons, 1984; Van Vuuren et al., 1992). Microbial protein synthesis may contribute
40 – 90%, of the amino acids supplied to the small intestines (Storm and Orskov, 1983). Once in
the small intestine, protein is hydrolysed into small peptides and amino acids and absorbed for
use by the animal. Remaining N is excreted in the faeces, consisting mainly of microbial debris
(Mason, 1969; Nolan, 1996). Amino acids are used in the mammary gland for milk production,
tissues and the excess are degraded in the liver and N is excreted as urea in the urine (Wattiaux,
1998; Pacheco and Waghorn, 2008). Overall, rumen microbes can use any form of N, but the cow
15
Figure 2.4 Overview of nitrogen metabolism in the ruminant. Sourced with permission: Pacheco
and Waghorn (2008).
2.5
Nitrogen use efficiency
The efficiency of N utilisation (nitrogen use efficiency, NUE) is defined as the proportion of
16
Phuong et al., 2013). Generally, the efficiency of N utilisation by ruminants is low, with N
efficiencies for lactating dairy cows grazing forage species in the range of 13 - 31 % (protein in
product/protein intake) reported (Wanjaiya et al., 1993; Astigarraga et al., 1994; Peyraud et al.,
1996; Delagarde et al., 1997; Castillo et al., 2001b). The low NUE occurs because any excess
dietary N that is not used for milk production, muscle or conceptus growth cannot be stored and
is excreted in faeces and urine. While NUE is ultimately limited by the animals’ genetic potential
(Rius et al., 2012), three primary causes have been identified for influencing NUE within the
animal: (1) total dietary N intake (2) herbage chemical composition and (3) lack of balance or
synchronisation of N and energy release in the rumen (West et al., 1997; Castillo et al., 2001b;
Phuong et al., 2013).
2.5.1
N intake
The amount of CP in the diet can affect NUE and N excretion (Table 2.1) (Hoekstra et al., 2007a).
In intensive Northern Hemisphere systems, cows are fed total mixed rations (TMR; comprising
grains, silages and supplements) and the formulation is balanced to provide sufficient N and
energy to meet cow requirements. The N included in the diet (often soybean meal or fish meal) is
an expensive component, so the amount used is minimised or treated (with heat or chemicals) to
limit rumen degradation. Measurement of milk production and milk urea concentration can be
used to monitor wastage of dietary N, allowing appropriate modification to the diet to balance N
and energy and minimize waste to the environment (Jonker et al., 1998). The ability to match
protein supply with animal requirements in New Zealand is more challenging where grazed
herbage is the main feed source. Herbage CP content varies depending on climate and
management (i.e. harvest interval and N inputs), but is often in excess of dairy cow requirements.
Minimum herbage CP concentration required for lactation is ~ 18% (Kolver, 2000; Pacheco and
Waghorn, 2008), but swards are generally managed so that their CP concentration exceeds this.
When there is an excess of N eaten, NUE decreases as there is little additional milk produced
from the additional N intake, leading to greater loss of N in excreta (Tamminga, 1992b; Ordonez
et al., 2004). For example, in a grazing study comparing cows consuming herbage containing
17
when the high N content herbage was fed. Similarly, Beever et al. (1986) demonstrated that while
the N intake of cattle grazing white clover (Trifolium repens L.) diets was almost twice that of
grass diets (due to greater N in the diet and DMI), only 27% more N flowed to the small intestine
indicating substantial losses of dietary N before the small intestine. Conversely, NUE is increased
by decreasing N intake. However, there will be a point at which decreasing N intake decreases
milk production (Calsamiglia et al., 2009), or results in catabolism of tissue protein to meet
metabolic demands which is not sustainable (Oldham et al., 1997). Therefore, a balance is sought
between providing sufficient CP for production and maintenance but reducing N excretion.
While the amount of N excreted as faeces is relatively constant and increases only slightly with
N intake (Jarvis, 1993), the excretion in urine increases exponentially with increasing N intake
(Figure 2.5) (Kebreab et al., 2001). Several studies have demonstrated the greater partitioning of
dietary N to urine compared with faeces and milk (Table 2.1). Thus the potential for reducing N
loss and increasing NUE lies largely with reducing N excreted in urine.