R E S E A R C H A R T I C L E
Open Access
Relationship between age and elite marathon
race time in world single age records from 5 to
93 years
Beat Knechtle
1,2*, Hervé Assadi
3, Romuald Lepers
3, Thomas Rosemann
1and Christoph Alexander Rüst
1Abstract
Background:The aims of the study were (i) to investigate the relationship between elite marathon race times and age in 1-year intervals by using the world single age records in marathon running from 5 to 93 years and (ii) to evaluate the sex difference in elite marathon running performance with advancing age.
Methods:World single age records in marathon running in 1-year intervals for women and men were analysed regarding changes across age for both men and women using linear and non-linear regression analyses for each age for women and men.
Results:The relationship between elite marathon race time and age was non-linear (i.e.polynomial regression 4th degree) for women and men. The curve was U-shaped where performance improved from 5 to ~20 years. From 5 years to ~15 years, boys and girls performed very similar. Between ~20 and ~35 years, performance was quite linear, but started to decrease at the age of ~35 years in a curvilinear manner with increasing age in both women and men. The sex difference increased non-linearly (i.e.polynomial regression 7thdegree) from 5 to ~20 years, remained unchanged at ~20 min from ~20 to ~50 years and increased thereafter. The sex difference was lowest (7.5%, 10.5 min) at the age of 49 years.
Conclusion:Elite marathon race times improved from 5 to ~20 years, remained linear between ~20 and ~35 years, and started to increase at the age of ~35 years in a curvilinear manner with increasing age in both women and men. The sex difference in elite marathon race time increased non-linearly and was lowest at the age of ~49 years.
Keywords:Running, Sex difference, Performance, Boys, Girls, Master runner
Background
In recent years, the number of successful marathoners in-creased continuously. For example, in the USA, the num-ber of successful marathon finishers increased from 25,000 in 1976 to the all-time high in 2011 with 518,000 successful finishers [1]. Recent studies investigating par-ticipation and performance trends in a large city marathon in the USA such as the‘New York City Marathon’showed that the increase in participants was mainly due to an in-crease in master runners (i.e.finishers of > 40 years of age) and women [2,3]. In the ‘New York City Marathon’, the number of men > 40 years increased three-fold from the
1980s to the 2000-2009, whereas the number of women increased even seven-fold [3].
Although the fastest elite marathon race times were achieved at the age of ~30 years in both female and male elite runners [4,5], it has been reported for both recre-ational marathoners [6] and ultra-marathoners [7] that the fastest race times can be achieved during a consider-ably long life span. For marathoners, the age-related loss in running performance did not occur before the age of ~50 years [6]. Mean marathons race times were nearly identical for age group runners from 20 to 49 years [6]. Also for 100-km ultra-marathoners, the fastest race times were observed during the age span of 30-49 years for men and 30-54 years for women, respectively [7].
It has been shown that race times in endurance and ultra-endurance events increased in a curvilinear manner
* Correspondence:beat.knechtle@hispeed.ch
1
Institute of Primary Care, Zurich, Switzerland
2Gesundheitszentrum St. Gallen, St. Gallen, Switzerland
Full list of author information is available at the end of the article
with increasing age [3,7-11]. In these studies, data from runners older than 25 years sorted in 5-years age groups were analysed. The main findings were that running per-formance was maintained until the age of ~35 years followed by a moderate decrease until the age of ~50-60 years and with a sharp decline after the age of ~60 years. When the relationship was expressed between age and race times, the change was curvilinear with an increase into higher ages [6,7]. When elite and recreational athletes were compared, it seemed that the pattern of the age-related performance decline was very similar for both groups [12].
In a study by Lara et al. [5], the association between elite marathon race time and age in 1-year intervals from 18 to 75 years in elite women and men competing in the‘New York City Marathon’in 2010 and 2011 was investigated. In contrast to previous findings, the rela-tionship between elite marathon race time and age was U-shaped [5]. The first aim of the present study was to investigate the relationship between elite marathon race times and age in 1-year intervals by using the world sin-gle age records in marathon running for each age from 5 to 93 years. A second aim of the present study was to further investigate the relationship between sex differ-ence in elite marathon running performance and advan-cing age. Based upon the findings in Lara et al. [5], we hypothesized to confirm the U-shaped relationship be-tween elite marathon race times and age also for world single age records in marathon running.
Methods
Ethics
This study was approved by the Institutional Review Board of St. Gallen, Switzerland, with a waiver of the requirement for informed consent given that the study involved the analysis of publicly available data.
Data sampling and data analysis
The data set for this study was obtained from the web-site of the ‘Association of Road Racing Statisticians’ (ARRS) [13]. This website records the world single age records in marathon running in 1-year intervals from the age of 5 to 93 years for men and 5 to 92 years for women. Elite marathon race times achieved from 5 to 93 years were analysed regarding changes across age for both men and women using linear and non-linear regres-sion analyses since the change in endurance performance and sex difference in endurance performance is assumed to be non-linear [14]. In marathons, the lowest age to offi-cially enter the race is 18 years and we therefore started our analysis at the age of 18 years. The comparison of races times for athletes older than 80 years showed large differences in marathon race performance and we there-fore performed a second analysis with race times of
athletes aged 18-80 years. When the best-fit model was a non-linear (i.e. polynomial) regression, we compared the best-fit non-linear model to the linear model using Akaike’s Information Criteria (AICc) and F-test in order to show which model would be the most appropriate to explain the trend of the data.
Results
For men, the fastest elite marathon race time of 2:03:23 h: min:sec was achieved by Wilson Kipsang Kiprotich, Kenia, at the age of 31 years and 198 days on September 29, 2013, in Berlin, Germany. However, Geoffrey Kiprono Mutai, Kenia, ran the fastest marathon ever on April 18, 2011, at the‘Boston Marathon’in a time of 2:03:02 h:min: sec. However, this time was not recognized as an official world record in marathon running by the International Association of Athletics Federations (IAAF). The course of the ‘Boston Marathon’ does not meet the criteria to be eligible for the mark since the race is a point-to-point course. For women, Paula Radcliffe, Great Britain, achieved the fastest elite marathon race time of 2:15:24.6 h: min:sec on April 13, 2003 in London, England, at the age of 29 years and 117 days. Table 1 presents the athletes who were able to achieve more than one world single age record. In men, 14 athletes reached two or more records where Ed Whitlock, Canada, achieved the highest number with 11 records. In women, 16 runners attained two or more records where Tatyana Pozdniakova, Ukrainia, holds six records.
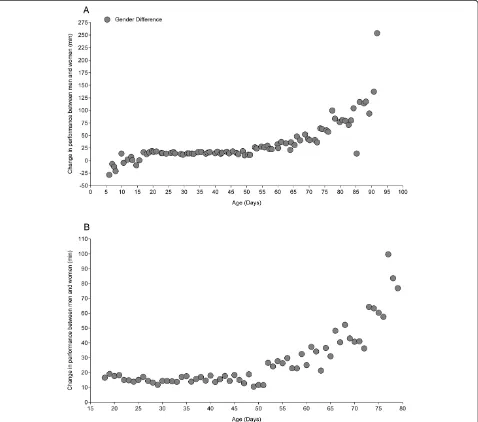
Relationship between elite marathon race time and age
Figure 1 presents the relationship between elite mara-thon race time and age for women and men from 5 to 93 years (Figure 1A) and from 18 to 80 years (Figure 1B). From 5 to 93 years, the relationship was non-linear for both women and men (i.e. polynomial regression 4th de-gree). Also for 18-80 years, the relationship was non-linear (i.e.polynomial regression 5thdegree) (Table 2). Regarding the group 5 to 93 years (Figure 1A), the curve was U-shaped where performance improved from 5 to ~20 years. From 5 years to ~15 years, boys and girls performed very similar. Between ~20 and ~35 years, performance was very linear (Figure 1A and B), but started to increase at the age of ~35 years in a curvilinear manner for both men and women with increasing age in both women and men.
Relationship between sex difference and age
from ~20 to ~50 years and increased thereafter. In 18-80 years, the sex difference remained unchanged at ~20 min from ~20 to ~50 years and increased thereafter (i.e. non-linear polynomial regression 4th degree, Figure 2B). The sex difference was lowest at the age of 49 years (i.e.7.5%, 10.5 min).
Discussion
The first aim of this investigation was to analyse the re-lationship between elite marathon race times and age when including the whole range of ages and by using an
analysis with 1-year intervals for the world single age re-cords. The second aim was to evaluate the sex difference in running performance with advancing age.
Relationship between elite marathon race time and age
The most important finding was that the association be-tween elite marathon race times and age was curvilinear for both elite women and men for 5-93 years and 18-80 years. Elite marathon race times showed a linear pro-gress from 18-35 years and started to increase in a curvi-linear manner at the age of ~35 years. We hypothesized confirming the U-shaped relationship between elite marathon race times and age based upon the findings in Lara et al. [5]. However, the relationship between elite marathon race times and age was again a curvilinear asso-ciation as has been reported for marathoners and ultra-marathoners when investigating age group ultra-marathoners and ultra-marathoners sorted in 5-year [3,7,8] or 10-year intervals [6] between 20 and 79 years.
Even in recreational marathoners, no differences in elite marathon race times of runners aged from 20 to 55 years were found [6,15]. These studies showed that marathon running times increased exponentially with in-creasing age starting at the age of ~35 years. Conse-quently, performance decreased with increasing age. Performance decreased after the age of ~50 years where the decrease became dramatic after the age of ~80 years. The decrease in endurance performance is mainly due to the decrease in maximum oxygen uptake (VO2max). VO2max decreases with age and is a factor in slower times with increasing age. The decline in VO2max with age ap-pears to be inevitable [16]. VO2max declines by ~10% per decade in both women and men regardless of the activity level [17]. However, high-intensity exercise may reduce this decrease by ~50% in young and middle-aged men, but not older men [17]. Middle-aged and older women do not appear to be able to reduce loss rates in VO2max to less than 10% per decade [17].
It has been shown by Lepers and Cattagni [3] that elite marathon race times started to increase at the age of ~35 years in both women and men. In contrast to exist-ing reports and the findexist-ings in the present study, Lara et al. [5] found an U-shaped relationship between elite marathon race times and age where the fastest race times were achieved at the age of 27 years in men and 29 years in women. A potential explanation for the dif-ferent findings could be the difdif-ferent samples of athletes and the larger sample in Laraet al.[5] including 20 par-ticipants for each age while we included only one athlete per age.
An interesting observation was that fact that from 5 years to ~15 years, boys and girls performed very simi-lar. After the age of ~15 years, male adolescents started to run faster than female adolescents. Before puberty,
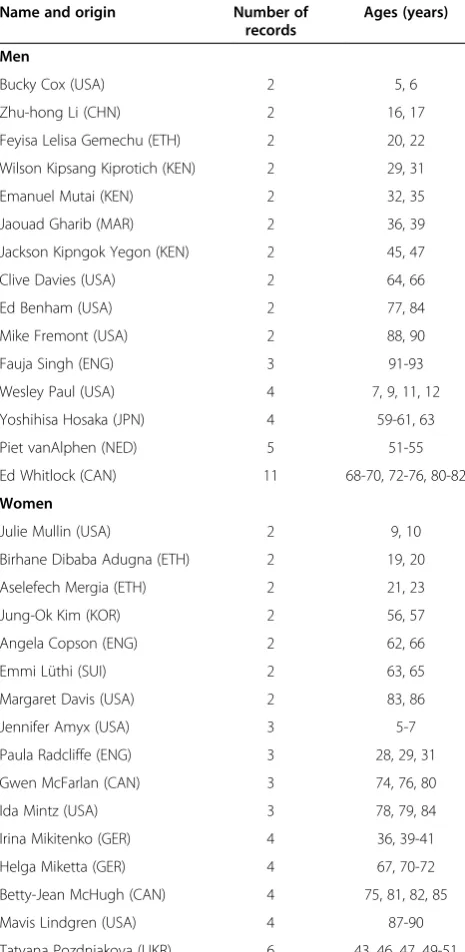
Table 1 Athletes with repeated world records
Name and origin Number of records
Ages (years)
Men
Bucky Cox (USA) 2 5, 6
Zhu-hong Li (CHN) 2 16, 17
Feyisa Lelisa Gemechu (ETH) 2 20, 22
Wilson Kipsang Kiprotich (KEN) 2 29, 31
Emanuel Mutai (KEN) 2 32, 35
Jaouad Gharib (MAR) 2 36, 39
Jackson Kipngok Yegon (KEN) 2 45, 47
Clive Davies (USA) 2 64, 66
Ed Benham (USA) 2 77, 84
Mike Fremont (USA) 2 88, 90
Fauja Singh (ENG) 3 91-93
Wesley Paul (USA) 4 7, 9, 11, 12
Yoshihisa Hosaka (JPN) 4 59-61, 63
Piet vanAlphen (NED) 5 51-55
Ed Whitlock (CAN) 11 68-70, 72-76, 80-82
Women
Julie Mullin (USA) 2 9, 10
Birhane Dibaba Adugna (ETH) 2 19, 20
Aselefech Mergia (ETH) 2 21, 23
Jung-Ok Kim (KOR) 2 56, 57
Angela Copson (ENG) 2 62, 66
Emmi Lüthi (SUI) 2 63, 65
Margaret Davis (USA) 2 83, 86
Jennifer Amyx (USA) 3 5-7
Paula Radcliffe (ENG) 3 28, 29, 31
Gwen McFarlan (CAN) 3 74, 76, 80
Ida Mintz (USA) 3 78, 79, 84
Irina Mikitenko (GER) 4 36, 39-41
Helga Miketta (GER) 4 67, 70-72
Betty-Jean McHugh (CAN) 4 75, 81, 82, 85
Mavis Lindgren (USA) 4 87-90
Figure 1Relationship between marathon race time and age for the world single age records in women and men from 5 to 93 years (Panel A) and from 18 to 80 years (Panel B).
Table 2 Equations of the non-linear regressions for running times and sex differences
Equation SE r r2
Running time Men 5-93 years y = 6.65−0.0012 · x + 0.00000 ·x2
−0.000000 · x3+ 0.00000 · x4 0.28 0.97 0.94
Women 5-92 years y = 6.41−0.0012 · x + 0.00000 ·x2
−0.000000 · x3+ 0.00000 · x4 0.26 0.98 0.97
Men 18-80 years y =−1.95 + 0.0015 · x−0.00000 ·x2+ 0.000000 · x3−0.00000 · x4+ 0.000000 · x5 0.05 0.99 0.98
Women 18-80 years y =−3.37 + 0.0022 · x−0.00000 ·x2+ 0.000000 · x3−0.00000 · x4+ 0.000000 · x5 0.12 0.98 0.97
Sex difference 5-92 years y =−183.23 + 0.12 · x−0.000032 ·x2+ 0.000000 · x3−0.00000 · x4+ 0.000000 · x5
−0.00000 · x6+ 0.000000 · x7
14.73 0.93 0.87
body dimensions are very similar in both boys and girls and boys and girls are only different in having different genitalia (sex organs). With puberty, body characteristics such as bone length, fat mass and muscle mass start to change [18]. With the start of puberty, testosterone starts to increase in boys leading to an increase in skeletal muscle mass whereas fat mass increases in girls [19]. Due to the higher muscle mass strength is higher in boys compared to girls [20,21]. Additionally, aerobic capacity will become higher in boys compared to girls [22] and endurance per-formance will be higher in body than in girls [23,24].
Relationship between sex difference and age
The second important finding was that the sex differ-ence in elite marathon race time was a U-shaped and was lowest at the age of ~49 years. In contrast, Laraet al.
[5] found a stable sex difference of ~18.7 ± 3.1% from 18 to 57 years and the lowest sex difference of 10.2 ± 5.5% was obtained at the age of 29 years. The difference be-tween the findings in Lara et al. [5] and our findings might be explained by the different performance levels of the investigated subjects and the number of investi-gated subjects. An interesting finding was that the sex difference was lowest at the age of ~49 years and was higher in younger and older ages than ~49 years al-though the elite marathon race times showed a rather linear progress from 18 to 35 years. Normal aging in humans is associated with a progressive decrease in skel-etal muscle mass [25,26] and strength [27,28]. A gradual loss of muscle fibres starts at the age of ~50 years and continues such that by the age of ~80 years, ~50% of the fibres are lost from the limb muscles [29].
There seemed to be differences between the sexes re-garding this age-related loss in skeletal muscle mass. In 68-78 years old women and men, the rate of loss in leg muscle was significantly higher in men than in women [30] and the prevalence of sarcopenia was ~31% in women and ~53% in men older than 80 years [25]. There seemed also to be differences between the sexes regarding the an-thropometric predictors of physical performance in older women and men [27] and strength of the lower limb [31,32]. In subjects at the age of ~73 years, the quality of the leg muscles was related to chair rise time and gait speed in men, but not in women [27]. In men, the muscle quality is more important to functional performance than in women and maintaining high quality skeletal muscle is particularly important for older men [27].
Limitations
This study is limited due to the lack of inclusion of physiological variables (i.e. VO2max, lactate threshold, running economy), training characteristics (i.e. running speed during training, training volume), previous experi-ence and nationality. A further limitation is that the stat-istical analysis was performed only by including the world single age records for women and men. It would be interesting to study the relationship between marathon race and age in a larger set of marathoners. The results listed in the‘Association of Road Racing Statisticians’[13] are not necessarily the best performances ever accom-plished. They list the fastest performances for each single age and for each of the standard distances. Performances are subject to the same standards as listing for national re-cords plus the additional requirement that the runner's date of birth as well as the race date must be known. These are required to be able to document the runner's exact age at the time of the performance. Single age re-cords meeting the qualifying standards may be expected to be fairly reliable. At older and younger ages, the best times known are listed. A further important limitation of the study is that the data are cross-sectional. With longitu-dinal data, different results could have been observed.
Conclusions
Elite marathon race times improved from 5 to ~20 years, remained linear between ~20 and ~35 years, and started to increase at the age of ~35 years in a curvilinear manner with increasing age in both women and men. The sex dif-ference in elite marathon race time increased non-linearly and was lowest at the age of ~49 years. Future studies need to confirm these findings in a large data set.
Competing interests
The authors declare no competing interests.
Authors’contributions
BK drafted the manuscript, RL and HA conceived the study, CR and RL performed the statistical analyses, TR helped in drafting the manuscript. All authors read and approved the final manuscript.
Author details
1Institute of Primary Care, Zurich, Switzerland.2Gesundheitszentrum St.
Gallen, St. Gallen, Switzerland.3INSERM U1093, Faculty of Sport Sciences, University of Burgundy, Dijon, France.
Received: 13 May 2014 Accepted: 17 July 2014 Published: 31 July 2014
References
1. Running USA.website http://www.runningusa.org/statistics, accessed December 10, 2013.
2. Jokl P, Sethi PM, Cooper AJ:Master's performance in the New York City Marathon 1983-1999.Br J Sports Med2004,38:408–412.
3. Lepers R, Cattagni T:Do older athletes reach limits in their performance during marathon running?Age (Dordr)2012,34:773–781.
4. Hunter SK, Stevens AA, Magennis K, Skelton KW, Fauth M:Is there a sex difference in the age of elite marathon runners?Med Sci Sports Exerc
2011,43:656–664.
5. Lara B, Salinero JJ, Del Coso J:The relationship between age and running time in elite marathoners is U-shaped.Age (Dordr)2014,36:1003–1008 [Epub ahead of print].
6. Leyk D, Erley O, Ridder D, Leurs M, Rüther T, Wunderlich M, Sievert A, Baum K, Essfeld D:Age-related changes in marathon and half-marathon performances.Int J Sports Med2007,28:513–517.
7. Knechtle B, Rüst CA, Rosemann T, Lepers R:Age-related changes in 100-km ultra-marathon running performance.Age (Dordr)2012,34:1033–1045. 8. Hunter SK, Stevens AA:Sex differences in marathon running with
advanced age: physiology or participation?Med Sci Sports Exerc2013,
45:148–156.
9. March DS, Vanderburgh PM, Titlebaum PJ, Hoops ML:Age, sex, and finish time as determinants of pacing in the marathon.J Strength Cond Res
2011,25:386–391.
10. Trappe S:Marathon runners: how do they age?Sports Med2007,
37:302–305.
11. Tanaka H, Seals DR:Endurance exercise performance in masters athletes: age-associated changes and underlying physiological mechanisms.
J Physiol2008,586:55–63.
12. Joyner MJ:Physiological limiting factors and distance running: influence of gender and age on record performances.Exerc Sport Sci Rev1993,
21:103–133.
13. Association of Road Racing Statisticians (ARRS).website http://www.arrs.net/ SA_Mara.htm, accessed January 14, 2014.
14. Reinboud W:Linear models can't keep up with sport gender gap.Nature
2004,432:147.
15. Leyk D, Erley O, Gorges W, Ridder D, Ruther T, Wunderlich M, Sievert A, Essfeld D, Piekarski C, Erren T:Performance, training and lifestyle parameters of marathon runners aged 20-80 years: results of the PACE-study.Int J Sports Med2009,30:360–365.
16. Stamford BA:Exercise and the elderly.Exerc Sport Sci Rev1988,16:341–379. 17. Hawkins S, Wiswell R:Rate and mechanism of maximal oxygen
consumption decline with aging: implications for exercise training.Sports Med2003,33:877–888.
18. PavićR, KatićR, Cular D:Quantitative sex differentiation of morphological characteristics in children aged 11 to 14 years.Coll Antropol2013,
37:147–151.
19. Wells JC:Sexual dimorphism of body composition.Best Pract Res Clin Endocrinol Metab2007,21:415–30.
20. Doré E, Baker JS, Jammes A, Graham M, New K, Van Praagh E:Upper body contribution during leg cycling peak power in teenage boys and girls.
Res Sports Med2006,14:245–257.
21. Doré E, Martin R, Ratel S, Duché P, Bedu M, Van Praagh E:Gender differences in peak muscle performance during growth.Int J Sports Med
2005,26:274–280.
23. Bitar A, Vernet J, Coudert J, Vermorel M:Longitudinal changes in body composition, physical capacities and energy expenditure in boys and girls during the onset of puberty.Eur J Nutr2000,39:157–163. 24. Drabik J:The general endurance of children aged 8-12 years in the
12 min run test.J Sports Med Phys Fitness1989,29:379–383.
25. Iannuzzi-Sucich M, Prestwood KM, Kenny AM:Prevalence of sarcopenia and predictors of skeletal muscle mass in healthy, older men and women.J Gerontol A Biol Sci Med Sci2002,57:M772–777. 26. NikolićM, Bajek S, Bobinac D, VranićTS, JerkovićR:Aging of human
skeletal muscles.Coll Antropol2005,29:67–70.
27. Fragala MS, Clark MH, Walsh SJ, Kleppinger A, Judge JO, Kuchel GA, Kenny AM:Gender differences in anthropometric predictors of physical performance in older adults.Gend Med2012,9:445–456.
28. Visser M, Deeg DJ, Lips P, Harris TB, Bouter LM:Skeletal muscle mass and muscle strength in relation to lower-extremity performance in older men and women.J Am Geriatr Soc2000,48:381–386.
29. Faulkner JA, Larkin LM, Claflin DR, Brooks SV:Age-related changes in the structure and function of skeletal muscles.Clin Exp Pharmacol Physiol
2007,34:1091–1096.
30. Zamboni M, Zoico E, Scartezzini T, Mazzali G, Tosoni P, Zivelonghi A, Gallagher D, De Pergola G, Di Francesco V, Bosello O:Body composition changes in stable-weight elderly subjects: the effect of sex.Aging Clin Exp Res2003,15:321–327.
31. Bouchard DR, Héroux M, Janssen I:Association between muscle mass, leg strength, and fat mass with physical function in older adults: influence of age and sex.J Aging Health2011,23:313–328.
32. Scott D, Blizzard L, Fell J, Jones G:Ambulatory activity, body composition, and lower-limb muscle strength in older adults.Med Sci Sports Exerc2009,
41:383–389.
doi:10.1186/2052-1847-6-31
Cite this article as:Knechtleet al.:Relationship between age and elite marathon race time in world single age records from 5 to 93 years.BMC Sports Science, Medicine, and Rehabilitation20146:31.
Submit your next manuscript to BioMed Central and take full advantage of:
• Convenient online submission
• Thorough peer review
• No space constraints or color figure charges
• Immediate publication on acceptance
• Inclusion in PubMed, CAS, Scopus and Google Scholar
• Research which is freely available for redistribution