Open Access
R E S E A R C H A R T I C L E
© 2010 Grubinger et al; licensee BioMed Central Ltd. This is an Open Access article distributed under the terms of the Creative Commons Attribution License (http://creativecommons.org/licenses/by/2.0), which permits unrestricted use, distribution, and reproduction in any medium, provided the original work is properly cited.
Research article
Regression tree construction by bootstrap: Model
search for DRG-systems applied to Austrian
health-data
Thomas Grubinger*, Conrad Kobel and Karl-Peter Pfeiffer
Abstract
Background: DRG-systems are used to allocate resources fairly to hospitals based on their performance. Statistically, this allocation is based on simple rules that can be modeled with regression trees. However, the resulting models often have to be adjusted manually to be medically reasonable and ethical.
Methods: Despite the possibility of manual, performance degenerating adaptations of the original model, alternative trees are systematically searched. The bootstrap-based method bumping is used to build diverse and accurate regression tree models for DRG-systems. A two-step model selection approach is proposed. First, a reasonable model complexity is chosen, based on statistical, medical and economical considerations. Second, a medically meaningful and accurate model is selected. An analysis of 8 data-sets from Austrian DRG-data is conducted and evaluated based on the possibility to produce diverse and accurate models for predefined tree complexities.
Results: The best bootstrap-based trees offer increased predictive accuracy compared to the trees built by the CART algorithm. The analysis demonstrates that even for very small tree sizes, diverse models can be constructed being equally or even more accurate than the single model built by the standard CART algorithm.
Conclusions: Bumping is a powerful tool to construct diverse and accurate regression trees, to be used as candidate models for DRG-systems. Furthermore, Bumping and the proposed model selection approach are also applicable to other medical decision and prognosis tasks.
Background
The aim of diagnosis related group (DRG) systems is to classify hospital patients into clinically meaningful and comprehensible groups that consume similar hospital resources, usually measured by their length of stay (LOS). These homogeneous patient groups are described by sim-ple rules, often including the patients' diagnoses, proce-dures, sex and age. The aim of DRG is to use these parameters as an estimate for the resource consumption of the hospital's individual patients. Among other pur-poses, e.g. to monitor quality of care and utilization of services, one of their most important applications is a fair, performance-based allocation of available resources among hospitals.
Similar to the British Healthcare Resource Groups
(HRG) [1] system and the Canadian Case Mix groups (CMG) [2] system, the Austrian DRG-system [3] is based on conjunctive rules only and no disjunctions are used, as is the case in other DRG-systems like the Australian AR-DRG [[4], Chapter H.3] and the German G-DRG [5] sys-tem. A major advantage of only using conjunctive rules is the possibility to interpret them as a tree structure, which gives a compact intuitively interpretable representation of the statistical model. Basically, these rules can be created by regression tree methods which, however, often have to be readjusted according to medical knowledge. Unfortu-nately, this manual adjustment usually yields a decrease of predictive accuracy.
Despite the possibility of manually adapting the original tree alternative models can be searched more systemati-cally. One possibility for such and approach arises from an important characteristic of regression trees, i.e., their * Correspondence: [email protected]
1 Department of Medical Statistics, Informatics and Health Economics,
solutions are unstable. Thus minor changes in the data can result in completely different trees. Nevertheless, all of these trees can be statistically accurate. Through sys-tematic resampling of the data by bootstrapping, a wider range of trees can be constructed. In this work, bumping [6] a bootstrap-based method proposed by Tibshirani and Knight is used.
In this article, we show that bumping allows us to build diverse and more accurate trees compared to the tree
constructed by the currently used Classification and
Regression Trees (CART) algorithm [7], while being equally or less complex. As it is shown in the results sec-tion, the statistically most accurate trees are too complex for the DRG-application. We propose to select the final models in a two-step approach from preprocessed mod-els. In a first step the tree size is chosen based on the models' accuracies as well as economical and medical considerations. These considerations require a lot of domain knowledge and are very difficult to express numerically. Therefore, the final tree size can not be selected based on statistics alone, but has to be chosen manually. In a second step, given the pre-specified tree size, an accurate and medically reasonable model can be selected. In this way, statistically suboptimal, manual alterations of models are minimized.
The Austrian DRG-System
Sine 1997 the Austrian hospital financing system is based on an activity-based hospital financing system called Leistungsorientierte Krankenhausfinanzierung (LKF). The aim was to replace the beforehand used per diem-based payment scheme by a case-based one with following main objectives [8]:
• Consolidate rapidly increasing costs by reducing the LOS
• Reduce costs by substituting inpatient care through ambulatory care
• Make the hospital system more efficient • Increase the transparency of costs and services • Improve data quality
• Maintain the quality of medical services
• Ensure modern scientific methods in medical care In the Austrian DRG-system in-hospital admissions are classified into homogeneous groups called Leistungsori-entierte Diagnosefallgruppen (LDF). The current model of 2009 is formed by a catalog of 979 patient groups resulting from a three-step classification procedure, sum-marized in Figure 1. First, the hospital patients are divided into two groups. In case a patient consumes a predefined individual medical service a procedure-ori-ented LDF, Medizinische Einzelleistung (MEL), applies. Otherwise a LDF group related to the patient's main diag-nosis, Hautdiagnosegruppe (HDG), is selected. In the next step these two groups are clustered, based on their
clinical similarity as well as on economical and statistical criteria, resulting in 204 MEL groups and 219 HDG groups. In the last step, patients corresponding to the MEL or HDG groups are further divided into 979 LDF, with the intention of finding groups with more homoge-neous LOS. In this step, the patients' specific main diag-nosis, secondary diagnoses, procedures, age and gender serve as possible split variables. The aim of using the LOS as the dependent variable is its good relationship with the total costs and its availability [8]. This final step of finding models to classify patients into the LDF groups is subject of this work and is displayed as Step 3 in Figure 1.
For the construction of the current LDF model the CART algorithm, a predictive tree model for regression and classification problems, was used. A main advantage of regression tree models is that they can be interpreted as simple rules without requiring any knowledge about the algorithm itself. This is particularly important as the final model is not only based on statistics, but its medical suitability also has to be evaluated by domain experts. For hospital management and budgeting these simple rules provide transparent information.
Methods
Regression Trees
The aim of regression tree analysis can be stated by explaining a continuous response variable Y by a vector of n predictor variables X = X1, X2,...,Xn, which can be an arbitrary mix of continuous, ordinal and nominal vari-ables. The CART algorithm recursively splits the data into two groups based on a splitting rule. The partition-ing intends to increase the homogeneity of the two result-ing subsets or nodes, based on the response variable. The partitioning stops when no splitting rule can improve the homogeneity of the nodes significantly.
Splitting points are termed internal nodes and nodes without successors are called terminal nodes. A binary
Overview of the three-step classification procedure of the Austrian DRG-system.
Figure 1 Overview of the three-step classification procedure of the Austrian DRG-system.
Ğ
^ƚĞ^ƚĞ
^ƚĞ
^ƚĞ^ƚĞ
Ž
ŽƉƐ
!"
#$!ϭϬ$Ž
% &!ŽƉƐ
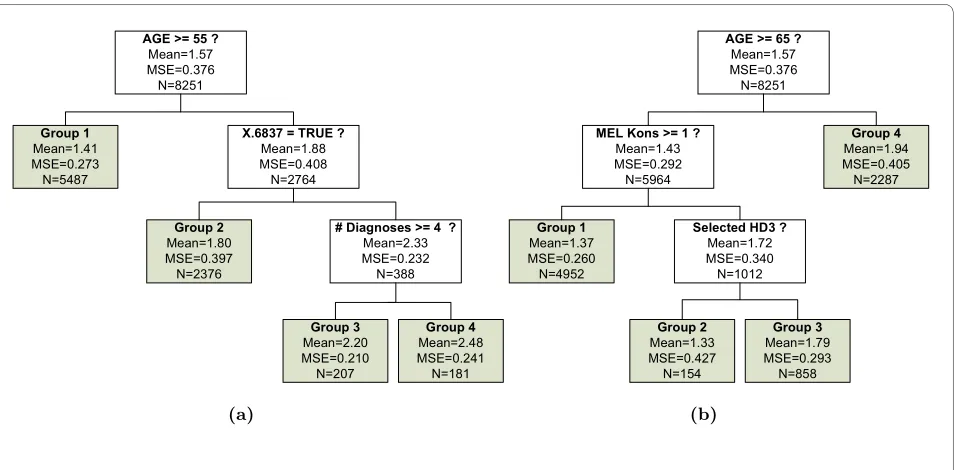
tree with m terminal nodes has m - 1 internal nodes. While the number of terminal nodes represents the num-ber of patient groups in the model, the numnum-ber of internal nodes can easily be interpreted as the required number of rules for classifying patients. In this paper the number of internal nodes is used as an measure of tree size or com-plexity, as for our application it is a more interesting interpretation than the total number of nodes. For regres-sion problems the terminal nodes are formed by the aver-ages of the response variables. The result can be represented by a tree structure, where nodes are con-nected via lines indicating the chain of recursive parti-tioning. Depending on the context, the terms split and rule are used throughout the manuscript, which, however both refer to what we have defined as a splitting rule. Two examples of a regression tree that determines the LDF group of the main diagnoses group HDG0502 are dis-played in Figure 2.
The CART algorithm can be summarized by the follow-ing three steps [[7], Chapter 2]:
1. Examine every allowable split on each predictor variable. Commonly the binary splits are defined as Xi <c for continuous variables and as Xi ? C for categori-cal variables, where C is a finite number of categories b1, b2,...,bm.
2. Select and execute the split that minimizes the impurity measure in the nodes. Samples that fulfill the criterion of the binary split propagate down into the descendant left node and the other variables into
the right node. In our analysis we used the least
square cost function, which is computationally effi-cient and the standard implementation of the CART algorithm.
3. Recursively continue step 1 and 2 on the descen-dant nodes until the homogeneity of the nodes cannot be improved significantly. Additionally, often addi-tional stopping criteria are defined, e.g. minimum sample sizes in the terminal nodes.
Trees constructed in the described fashion tend to grow too big and have too few observations in the termi-nal nodes. In order to overcome this problem the trees are recursively pruned back to smaller size. In the DRG application we iteratively pruned back the internal node which led to the smallest degeneration in accuracy, until only one internal node remained. From there all tree sizes are evaluated separately.
Besides financial issues and medical preferences to split one HDG or MEL group further up than another, statisti-cally the accuracy-complexity tradeoff of selecting the right sized tree can be assessed by the cost-complexity criterion defined as [[7], Chapter 3]:
where R(T) is the Mean Squared Error (MSE) and | | is the number of terminal nodes, or the number of inter-nal nodes minus one, of model T. α is a non-negative con-stant which regulates the additional cost for more complex trees.
Rα( )T =R T( )+α|T|
T
Two different trees constructed by bumping from the HDG0502 data. The two trees have different split points and variables, but have very similar predictive accuracy.
Figure 2 Two different trees constructed by bumping from the HDG0502 data. The two trees have different split points and variables, but have very similar predictive accuracy.
!
"#$%&&
(a)
'()*+#
,-&
Requirements and Review of Alternative Tree Methods
There are many alternative regression tree algorithms, mainly differing by their tree structure, splitting criteria, pruning method and handling of missing values. In addi-tion quite a lot of hybrid algorithms have been proposed, e.g. Quinlan's M5 algorithm [9] fits a linear regression model in each of the leaves to improve accuracy. Ensem-bles of trees [10] have become commonly used which are, on the other hand, less easy to interpret as the resulting model consists of more than one tree. Moreover, regres-sion trees with soft splits [11] and methods to combine multiple trees into a single tree [12] were introduced. Both methods provide more accurate trees which, how-ever, do not offer a distinct split point. Although, apart from the models accuracy, its low complexity, interpret-ability as well as its simple tree structure are most desir-able properties for the DRG application.
The CART algorithm is a greedy algorithm which builds trees in a forward stepwise search. Therefore, its results are only locally optimal, as splits are chosen to maximize homogeneity at the next step only. By perturb-ing the data bumpperturb-ing identifies different trees in a greedy manner, while some of these models may be close to a global or local maximum. Besides the used bumping method, there are two other common groups of algo-rithms to find more globally optimal trees that fulfill our requirements of simplicity and interpretability, which are discussed in the following.
The first approach is to build trees in a globally more optimal way. This can be done by calculating the effects of the choice of the attribute deeper down in the tree, which in principle can be accomplished by an exhaustive search [13]. However, this is computationally intractable for larger data-sets. As a consequence, the search space is usually limited by heuristics. According to previous stud-ies, look-ahead procedures are not always beneficial over greedy strategies and have been criticized [14,15]. On the contrary several authors [16-18] reported a significant improvement in tree quality. Murthy and Salzberg [14] conclude that limited look-ahead search on average pro-duces shallower trees with the same classification accu-racy. In some cases the trees from the look-ahead procedures are even both, less accurate and bigger than the trees produced by a greedy strategy. Quinlan and Cameron-Jones [15] argue that these rather unpromising results are due to oversearching the hypothesis space, resulting in an overfit of the training data.
Shi and Lyons-Weiler [19] presented the Clinical Deci-sion Modeling System (CDMS), which allows searching for random classification trees that fulfill user specified constraints about model complexity and accuracy. Simi-lar to our approach they follow the idea of constructing a set of models first and leave the selection of a clinically meaningful tree to the user of their software.
The second group of algorithms built the tree in a greedy manner first and improve the tree structure later by the use of optimization methods, e.g. evolutionary algorithms [20], Bayesian CART [21,22], simulated annealing [23] and tabu search [24].
Evolutionary algorithms are a family of algorithms that use stochastic optimization based on concepts of natural Darwinian evolution. For tree algorithms genetic opera-tions can be applied to modify the tree structure and the tests that are applied in the internal nodes. Based on these operations new populations of trees are explored iteratively. The newly generated population is then assessed by a fitness function, which evaluates the quality of an individual within one population. Individual trees that are assessed to have a high fitness are more likely to be used in the next round, whereas the other models are rejected.
Kalles [25] classification tree algorithm uses a fitness function that takes the two quality attributes of misclassi-fication rate and tree size into account. A survey of fitness approximations is given in [26]. An evolutionary approach that is applicable for classification and regres-sion trees is presented in [20].
Bayesian CART [21,22] algorithms aim to stochastically optimize pre-specified CART trees in an approximated Bayesian way. The space of all possible trees is explored by Monte Carlo methods, which give an approximation to a probability distribution over the space of all possible trees. Modification of the tree structure is conducted by
employing different move types, including grow and
prune steps, as well as a change step which changes the split at an internal node. In contrast to evolutionary algo-rithms Bayesian CART is not population oriented, but only modifies one tree at a time.
forbidden. Tabu search allows searching for solutions beyond local optimum while still making the best possi-ble move at each iteration.
Model Search by Bootstrap
Bootstrap methods are most commonly based on the idea of combining and averaging models to reduce prediction error. Examples of such methods include Bagging [27], Boosting [28] and Random Forests [10]. The basic idea behind Bagging and Random Forests is to reduce variance by averaging a number of B models, created on the basis of B different data-sets. In contrast, Boosting reduces the overall training error by recursively fitting models to the residuals of the previously constructed regression tree. Although these methods can improve the accuracy and the variability of the results significantly, the final model itself loses its interpretability and the influence of the pre-dictor variables becomes unclear.
In contrast to other bootstrap methods the result of bumping is not an ensemble of trees but only single trees, which are built on different bootstrap samples. The boot-strap samples themselves are formed by random sam-pling with replacement from the original training data, while each bootstrap sample has the same size as the original training data-set. This procedure is repeated B times, producing B bootstrap data-sets, from which, in turn B models can be built.
Bumping was successfully applied in combination with several learning algorithms including Classification Trees, Linear Regression, Splines and parametric density estimation [6], Linear Discriminant Analyis (LDA) [29], Neural Networks [30] and Self Organizing Maps (SOM) [31].
Tibshirani and Knight [6] selected the best tree regard-ing accuracy on the original trainregard-ing-set. In our applica-tion the best j trees for each tree complexity, measured by the number of internal nodes, are of interest. This is because we want to construct different models first and leave the decision about the final model to medical domain experts. The bumping procedure can be summa-rized as follows:
1. A set of bootstrap samples z*1, z*2,...,z*B are drawn from the training-set z
2. Models are fit to each bootstrap sample giving
pre-diction (x) for each bootstrap b = 1, 2,...,B at input point x. As a convention the original training-set z is included among the B bootstrap samples as well. 3. For each tree complexity, the best trees are selected based on their average prediction error on the origi-nal training-set z.
In the following section the evaluation of the selected trees on independent data is further discussed.
Addition-ally, the evaluation criteria to assess the number of statis-tically accurate model choices are defined.
From the presented methods that allow searching for alternative tree models, only bumping and evolutionary algorithms offer a diverse set of model choices. However, in principle the other methods could be modified to store an arbitrary amount of accurate candidate trees that are created during the search process.
A particular advantage of bumping compared to other non-greedy regression tree methods is the possibility to computationally effective construct and select the best models for each tree size. By the use of bumping all candi-date trees can simply be grown to full size first and sec-ondly be pruned back iteratively by one node. As a result, for each tree size the best model can be selected from the B bootstrap trees. Other algorithms that search for glob-ally optimal candidate models would tend towards trees that are optimal for some tree complexity. These trees would either be very complex, or would at least have sim-ilar complexity for all candidate trees if the models' qual-ity is measured by accuracy and the complexqual-ity of the tree. However, iterative pruning of these models does not necessarily result in optimal models with smaller tree size. Therefore, in order to build optimal trees for each tree size, each model complexity, determined by the number of internal nodes, would have to be handled sep-arately.
For look-ahead algorithms this computational require-ments would be very high as binary trees with a given number of nodes can have different forms. That is, there are many possible arrangements, called topologies, for a given number of internal nodes. Therefore, for each tree complexity a number of topologies Cn would have to be considered. Where Cn grows exponentially with the num-ber of nodes n and is given by the Catalan number [32]:
where Cn is the number of topologies for trees with n internal nodes. The number of binary trees with n = 1 to n = 6 internal nodes are 1, 2, 5, 14, 42, 132.
Evaluation Criteria
The performance of bumping compared to the standard CART algorithm is evaluated based on its ability of find-ing homogeneous patient groups with similar LOS. That is modeling and predicting the LOS of hospital patients, as it is described in the third step of the three-step classi-fication procedure, summarized in Figure 1.
Tree size has a big influence on the accuracy of models. Since bumping compares different models on the training data, the models must have similar complexity [[7],
Chap-ˆ*
f b
C n
n n
n= +
⎛ ⎝ ⎜ ⎞
⎠ ⎟
1 1
ter 8], given by the number of internal nodes. Therefore, only models with the same number of nodes are com-pared in our analysis. We limited model sizes to a maxi-mum number of 16 internal nodes resulting in a maximum of 17 patient groups and a tree depth of 5 cor-responding to a maximum of 5 rules to classify patients. As it can be seen in Figure 3 more complex models only gave relatively small improvements in predictive error and were considered as too complex for our application. As a comparison, in the LKF model 2009 the most com-plex tree has 11 internal nodes and few trees have more than 4 internal nodes. For each comparison B = 200 boot-strap samples were drawn from the training-set. We used the R package rpart [33] to build regression trees. The suitability of the bootstrap method is evaluated in two ways, which are described in the following.
Accuracy of the Best Bootstrapped Tree
In this first evaluation step we want to show that the best bootstrapped tree offers increased predictive accuracy compared to the CART algorithm. The difference in accuracy is assessed by the use of 10-fold cross-validation [[34], Chapter 7]. In 10-fold cross-validation the data is first partitioned into complementary subsets called folds. The model is then built on 9 folds and the remaining fold is used as a test-set. This analysis is repeated 10 times, where each of the folds is used as the test-set once. Finally, the estimate of predictive accuracy is calculated from the average performance of the 10 models on their
associated test-sets. The evaluation on independent data is especially important as a wider search of the hypothesis space can lead to overfitting of data [15].
To avoid overfitting, each terminal node should have a minimal amount of observations mmin. However, in our comparison, we did not restrict the minimum number of mmin. The reason is, that we want to avoid the effect of trees stopping to split with mmin - k observations, where k is a small number of instances, while similar trees with mmin observations further split up. To give an example where this is important imagine that the standard CART tree stops splitting at node j with mmin - 1 nodes. One of the 200 bootstrap trees is very similar to the standard CART tree but has mmin observations in node j. As a result the bootstrap tree splits at j while the CART tree stops splitting. Thus, this marginal difference of one more observation in j results in two different tree-topologies which can have significantly different predictive accuracy.
Number of Accurate Model Choices
In the second step of our evaluation the possibility to construct diverse choices of accurate trees by the use of bootstrap sampling is presented. The estimation of accu-racy takes the whole data-set into account. In this part of the evaluation, where we assess the number of diverse choices of accurate trees, we limited the minimum num-ber of observations to 30, which we thought of to be large
Reduction of the MSE obtained by the best bootstrapped tree for different tree sizes. Figure 3 Reduction of the MSE obtained by the best bootstrapped tree for different tree sizes.
0 5 10 15 20
0.0
0.2
0.4
0.6
0.8
1.0
Number of Rules
MSE [%]
0 1 2 3 4 5 6 7 8 9 10 11 12 13 14 15 16 17 18 19 20
0 5 10 15 20
0.0
0.2
0.4
0.6
0.8
1.0
Number of Rules
MSE [%]
0 1 2 3 4 5 6 7 8 9 10 11 12 13 14 15 16 17 18 19 20
0 5 10 15 20
0.0
0.2
0.4
0.6
0.8
1.0
Number of Rules
MSE [%]
0 1 2 3 4 5 6 7 8 9 10 11 12 13 14 15 16 17 18 19 20
0 5 10 15 20
0.0
0.2
0.4
0.6
0.8
1.0
Number of Rules
MSE [%]
0 1 2 3 4 5 6 7 8 9 10 11 12 13 14 15 16 17 18 19 20
0 5 10 15 20
0.0
0.2
0.4
0.6
0.8
1.0
Number of Rules
MSE [%]
0 5 10 15 20
0.0
0.2
0.4
0.6
0.8
1.0
Number of Rules
MSE [%]
0 5 10 15 20
0.0
0.2
0.4
0.6
0.8
1.0
Number of Rules
MSE [%]
0 5 10 15 20
0.0
0.2
0.4
0.6
0.8
1.0
Number of Rules
MSE [%]
enough to avoid overfitting as well as to be a minimum requirement to form a patient group in the LKF model.
The DRG-Data
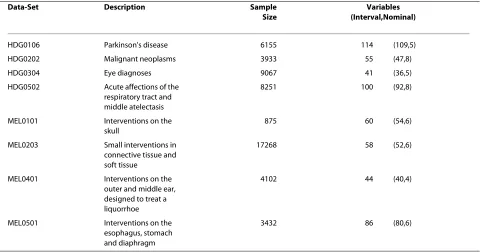
The basis for our analysis are 8 data-sets, 4 MEL and 4 HDG groups of the Austrian DRG-system 2006. The data-sets consist of information about the patients' main diagnosis, secondary diagnoses, procedures, number of diagnoses, number of procedures, sex and age, as well as the patients' length of stay. The characteristics and a short description of the medical meaning of the evaluated data-sets are summarized in Table 1. Permission to use the data was granted by the Bundesministerium für Gesund-heit, Familie und Jugend (BMG) [35].
Results
Accuracy of the Best Bootstrapped Tree
Results of the relative predictive accuracy of the best bootstrapped tree compared to the CART tree are dis-played in Figure 4. The individual Boxplots refer to one
data-set and one possible tree complexity each and result from the 10 test-sets from the cross-validation procedure. Although the bootstrap based trees are not always better than the standard CART trees, it can be observed that on average they offer increased accuracy for most data-sets and tree complexities. The high variability of the relative performance is also due to a relative small portion of test-data (10%) of each fold. However, as each observation serves as a test-sample in one of the folds, the average of the results gives a good estimate of the predictive accu-racy. No obvious relationship between the variability of the relative performance and the complexity of the trees can be observed.
Table 2 summarizes the results in less detail by display-ing the average change in relative accuracy for each data-set and tree size. It can be observed that for 5 of the 8 data-sets the average accuracy improved for all evaluated tree sizes. The HDG0106 main diagnosis data-set is the only one where the best bootstrap trees performed worse than the standard CART trees. The bootstrap method
Comparison of the best bootstrap based tree with the standard CART tree. Figure 4 Comparison of the best bootstrap based tree with the standard CART tree.
−20 −10 0 10 20 30
Number of Rules
Improve MSE[%]
2 3 4 5 6
−20 −10 0 10 20 30
Number of Rules
Improve MSE[%]
2 3 4 5 6
−20 −10 0 10 20 30
Number of Rules
Improve MSE[%]
2 3 4 5 6
−20 −10 0 10 20 30
Number of Rules
Improve MSE[%]
2 3 4 5 6
−20 −10 0 10 20 30
Number of Rules
Improve MSE[%]
2 3 4 5 6
−20 −10 0 10 20 30
Number of Rules
Improve MSE[%]
2 3 4 5 6
−20 −10 0 10 20 30
Number of Rules
Improve MSE[%]
2 3 4 5 6
−20 −10 0 10 20 30
Number of Rules
Improve MSE[%]
2 3 4 5 6
HDG0106 HDG0202 HDG0304 HDG0502 MEL0101 MEL0203 MEL0401 MEL0501
(a)small tree sizes
−20 −10 0 10 20 30
Number of Rules
Improve MSE[%]
8 10 12 14 16
−20 −10 0 10 20 30
Number of Rules
Improve MSE[%]
8 10 12 14 16
−20 −10 0 10 20 30
Number of Rules
Improve MSE[%]
8 10 12 14 16
−20 −10 0 10 20 30
Number of Rules
Improve MSE[%]
8 10 12 14 16
−20 −10 0 10 20 30
Number of Rules
Improve MSE[%]
8 10 12 14 16
−20 −10 0 10 20 30
Number of Rules
Improve MSE[%]
8 10 12 14 16
−20 −10 0 10 20 30
Number of Rules
Improve MSE[%]
8 10 12 14 16
−20 −10 0 10 20 30
Number of Rules
Improve MSE[%] HDG0106 HDG0202 HDG0304 HDG0502 MEL0101 MEL0203 MEL0401 MEL0501
also performed worse for models with small tree sizes (2-4 internal nodes) for the MEL0501 data-set as well as for trees with 10 and 14 internal nodes for the MEL0101 data-set. However, the majority of the bootstrap trees outperformed the standard CART trees. Averaged over all data-sets an improvement of 1.06-4.90% for the differ-ent tree sizes could be achieved. No specific reason for
the worse performance, of the bumping methodon the two data-sets HDG0106 and MEL0501 could be found.
Figure 3 illustrates the reduction of the total MSE by models with different tree complexities estimated by 10-fold cross validation. It can be observed that the predic-tive error is already reduced with a small number of splits and the improvements obtained by additional splits become progressively smaller with increasing tree com-Table 1: Description of the evaluated data-sets.
Data-Set Description Sample
Size
Variables (Interval,Nominal)
HDG0106 Parkinson's disease 6155 114 (109,5)
HDG0202 Malignant neoplasms 3933 55 (47,8)
HDG0304 Eye diagnoses 9067 41 (36,5)
HDG0502 Acute affections of the respiratory tract and middle atelectasis
8251 100 (92,8)
MEL0101 Interventions on the skull
875 60 (54,6)
MEL0203 Small interventions in connective tissue and soft tissue
17268 58 (52,6)
MEL0401 Interventions on the outer and middle ear, designed to treat a liquorrhoe
4102 44 (40,4)
MEL0501 Interventions on the esophagus, stomach and diaphragm
3432 86 (80,6)
Table 2: Relative average improvement.
Tree Size HDG0106 HDG0202 HDG0304 HDG0502 MEL0101 MEL0203 MEL0401 MEL0501 Average
2 0.00 1.12 2.55 0.71 1.20 3.74 3.34 -1.52 1.39
3 0.00 2.78 3.33 1.65 5.96 1.88 3.92 -1.97 2.19
4 -0.36 5.57 3.52 1.23 5.77 3.30 4.28 -1.05 2.78
5 0.42 3.18 3.85 2.30 7.43 0.26 3.81 -0.84 2.55
6 -0.24 4.38 5.47 1.13 9.65 12.03 2.33 4.41 4.90
8 -0.11 6.05 1.75 1.15 1.06 12.91 2.67 3.63 3.64
10 -0.06 3.99 3.16 0.69 -2.93 5.09 1.94 2.83 1.84
12 -0.42 4.14 3.24 1.75 2.89 1.61 1.24 4.95 2.43
14 -1.87 3.35 1.82 1.20 -0.36 0.00 2.15 2.17 1.06
16 -0.76 2.11 2.52 1.27 1.38 1.18 1.89 0.65 1.28
plexity. Although very large trees often give the best pre-dictive performance, these complex trees are difficult to interpret and hard to work with.
The average improvement in relative accuracy by the bootstrap method often offers models with the same accuracy but less complex rules. For example, models with 3 internal nodes compared to models with 2 internal nodes offer an average increase in accuracy of 1.60%, while the accuracy of the bootstrap method achieved an average improvement of 1.39%. For the data-sets HDG0304, MEL0203 and MEL0401 the best boot-strapped tree with 2 internal nodes even outperforms the CART tree with 3 internal nodes. This effect becomes even more significant for larger tree sizes where one or even several rules can be omitted without degeneration in performance.
Number of Accurate Model Choices
In the second step the number of trees constructed by bumping that are at least as accurate or better than the standard tree is evaluated. Models are considered dissim-ilar when at least one split variable differed between the trees. For groups of trees where all the split variables are the same, but the split points differ the most accurate tree is selected and considered as a candidate model.
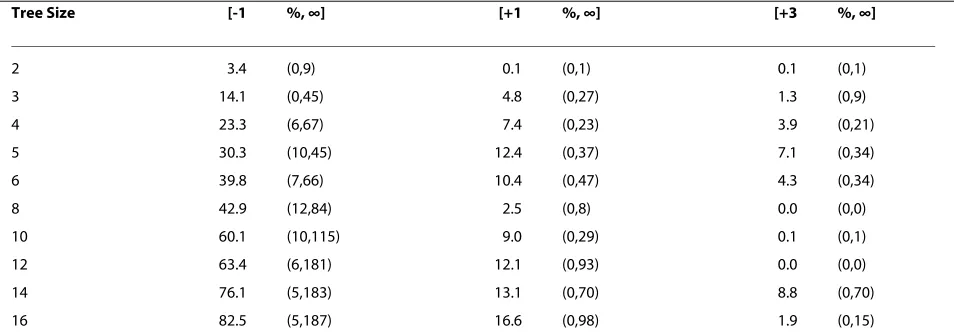
In Table 3 the numbers of distinct accurate trees are broken down into accuracy classes for each tree complex-ity. The results are displayed as the mean, minimum and maximum number of different trees constructed on the 8 evaluated data-sets and are within an accuracy class. To give an example, for models with 4 internal nodes on average 23.3 distinct trees with a minimum performance in relative accuracy of -1% were constructed. The mini-mum number of distinct trees constructed on one of the
data-sets is 6 and the maximum number is 67. From these 23.3 different models an average of 7.4 trees have a rela-tive improvement of accuracy > 1% and in turn 3.9 trees achieved a relative improvement of > 3%.
The results show that even for very low tree complexi-ties alternative models can be found. For simplest models, with only 2 internal nodes, an average of 3.4 different trees with at least similar accuracy [-1%, +1%] were found. For slightly more complex models with 3 rules the average number of models with at least similar accuracy increased to 14.1 and 4.8 trees offered improve accuracy of > 1%, compared to the standard CART tree. It can be observed that with increasing model size the number of different trees increases to 187 for models with 16 inter-nal nodes, while many of these models only differ by minor important splits at the bottom of the trees, which do not contribute much to the reduction of impurity and are medically very similar.
Therefore the similarity of trees should be further dis-tinguished. How to assess statistical similarity of trees by means of topography and similar partitioning is discussed in [36,37]. However, in the DRG-application we are mainly interested in the choices of split-variables regard-ing their medical meanregard-ing. In our analyses nodes differ-ing further up in the tree are considered as more influential, as more patients are affected by these rules and they also contribute more to the reduction of the total variance. As an estimate on which levels the differ-ences occur the results from Table 3 can be taken into account.
Conclusions
Based on the evaluation of 8 large data-sets taken from the Austrian DRG system, we showed that bumping can
Table 3: Number of diverse trees.
Tree Size [-1 %, ∞] [+1 %, ∞] [+3 %, ∞]
2 3.4 (0,9) 0.1 (0,1) 0.1 (0,1)
3 14.1 (0,45) 4.8 (0,27) 1.3 (0,9)
4 23.3 (6,67) 7.4 (0,23) 3.9 (0,21)
5 30.3 (10,45) 12.4 (0,37) 7.1 (0,34)
6 39.8 (7,66) 10.4 (0,47) 4.3 (0,34)
8 42.9 (12,84) 2.5 (0,8) 0.0 (0,0)
10 60.1 (10,115) 9.0 (0,29) 0.1 (0,1)
12 63.4 (6,181) 12.1 (0,93) 0.0 (0,0)
14 76.1 (5,183) 13.1 (0,70) 8.8 (0,70)
16 82.5 (5,187) 16.6 (0,98) 1.9 (0,15)
be used to construct diverse and accurate candidate mod-els for DRG-systems that are based on conjunctive rules. Compared to other methods that allow a broader search of the hypothesis space, bumping can be used computa-tionally more efficient. The presented results show that on average the predictive accuracy of the best bootstrap based tree offers improved accuracy compared to the tree from the standard CART algorithm. Furthermore, less complex trees can be found that are non-inferior com-pared to the single tree constructed by the original algo-rithm.
During the whole development of the Austrian DRG-system medical experts have been involved in the evalua-tion of the resulting regression trees. Many times the sta-tistical optimal tree was not selected because of medical expert opinion. From discussions with medical experts, we know that a single, data-driven model is not always the medical correct one and different options have to be presented for medical evaluation. With our approach of constructing diverse models for different pre-specified tree sizes, we allow a wide range of candidate models to be considered. For these candidate models suitable tree sizes can be selected, based on the cost-complexity crite-rion as well as on economical and medical consider-ations. Subsequently, given a desired tree complexity, medical domain experts can chose a final model. In this way, statistically suboptimal, manual alterations of mod-els can be minimized.
This presentation illustrates the possibilities of bump-ing, which will be used in the next years of the mainte-nance and further development of the Austrian DRG-system. Besides its relevance to DRG-systems, bumping and the proposed two-step model selection process are especially useful to assist in any kind of classification or regression problems in medical decision and prognosis tasks [38-40]. This is because domain specific knowledge can be used to guide the selection of a medically mean-ingful and statistically accurate model.
Competing interests
The authors declare that they have no competing interests.
Authors' contributions
TG is the main author of this article. He participated in the design of the study, conducted the experiments and drafted the manuscript. CK provided knowl-edge about DRG-systems and helped to draft and review the manuscript. Since 1991, KPP is one of the project managers for the development of the Austrian LKF system. He participated in the study with his expert knowledge about DRG-systems, provided the data, contributed in the design of the study and reviewed the manuscript. All authors read and approved the final manu-script.
Acknowledgements
The authors would like to thank Michael Edlinger, Department of Medical
Statis-tics, Informatics and Health Economics, for reviewing the paper. Furthermore, we
want to thank the Bundesministerium für Gesundheit, Familie und Jugend for
pro-viding and approving the use of the data-sets for this study.
Author Details
Department of Medical Statistics, Informatics and Health Economics, Innsbruck Medical University, Schoepfstrasse 41/1, 6020 Innsbruck, Austria
References
1. The Casemix Service: HRG4 Design Concepts. 2007 [http://
www.ic.nhs.uk/webfiles/Services/casemix/Prep%20HRG4/ HRG4%20design%20concepts%20a.pdf]. (accessed January 29, 2010)
2. Canadian Institute for Health Information: Acute Care Grouping
Methodologies. 2004 [http://secure.cihi.ca/cihiweb/en/downloads/ Acute_Care_Grouping_Methodologies2004_e.pdf]. (accessed on January 29, 2010)3.Bundesministerium für Gesundheit, Familie und Jugend:
Leistungsorientierte Krankenanstaltenfinanzierung. LKF
Systembeschreibung. 2009 [http://bmg.gv.at/cms/site/attachments/6/ 4/5/CH0719/CMS1159516854629/systembeschreibung_2009.pdf].
(accessed on January 29, 2010)4.Fischer W: Diagnosis Related Groups
(DRG's) und Verwandte Patientenklassifikationssysteme Wolfertswil: Zentrum für Informatik und wirtschaftliche Medizin; 2000.
5. Institut für das Entgeltsystem im Krankenhaus GmbH: German Diagnosis
Related Groups Definitionshandbuch. Siegburg: Deutsche Krankenhaus Verlagsgesellschaft GmbH 2005.
6. Tibshirani R, Knight K: Model Search by Bootstrap "Bumping". Journal of
Computational and Graphical Statistics 1999, 8(4):671-686.
7. Breiman L, Friedman J, Olshen R, Stone C: Classification and Regression
Trees Belmont: Wadsworth; 1984.
8. Theurl E, Winner H: The impact of hospital financing on the length of
stay: Evidence from Austria. Health policy 2007, 82(3):375-389.
9. Quinlan J: Learning with continuous classes. In Proceedings of the 5th
Australian Joint Conference on Artificial Intelligence 1992:343-348.
10. Breiman L: Random Forests. Machine Learning 2001, 45:5-32.
11. Suárez A, Lutsko J: Globally Optimal Fuzzy Decision Trees for
Classification and Regression. IEEE Transactions on Pattern Analysis and Machine Intelligence 1999, 21(12):1297-1311.
12. Shannon W, Banks D: Combining classification trees using MLE.
Statistics in Medicine 1999, 18(6):727-740.
13. Vogel D, Asparouhov O, Scheffer T: Scalable look-ahead linear
regression trees. In Proceedings of the 13th ACM SIGKDD international conference on Knowledge discovery and data mining ACM Press New York, NY, USA; 2007:757-764.
14. Murthy S, Salzberg S: Lookahead and pathology in decision tree
induction. Proceedings of the Fourteenth International Joint Conference on Artificial Intelligence 1995:1025-1031.
15. Quinlan J, Cameron-Jones R: Oversearching and Layered Search in
Empirical Learning. Breast Cancer 1995, 286:2-7.
16. Esmeir S, Markovitch S: Anytime Learning of Decision Trees. The Journal
of Machine Learning Research 2007, 8:891-933.
17. Esmeir S, Markovitch S: Lookahead-based algorithms for anytime
induction of decision trees. In ACM International Conference Proceeding Series ACM Press New York, NY, USA; 2004:257-264.
18. Norton S: Generating better decision trees. Proceedings of the Eleventh
International Conference on Artificial Intelligence 1989:800-805.
19. Shi H, Lyons-Weiler J: Clinical decision modeling system. BMC Medical
Informatics and Decision Making 2007, 7:23.
20. Fan G, Gray J: Regression tree analysis using TARGET. Journal of
Computational and Graphical Statistics 2005, 14:206-218.
21. Chipman H, George E, McCulloch R, et al.: Bayesian CART Model Search.
Journal of the American Statistical Association 1998, 93:935-947.
22. Denison D, Mallick B, Smith A: A Bayesian CART algorithm. Biometrika
1998, 85(2):363-377.
23. Sutton C: Improving Classification Trees with Simulated Annealing.
Proceedings of the 23rd Symposium on the Interface, Interface Foundation of North America 1992:333-44.
24. Youssef H, M Sait S, Adiche H: Evolutionary algorithms, simulated
annealing and tabu search: a comparative study. Engineering Applications of Artificial Intelligence 2001, 14(2):167-181.
25. Kalles D: Lossless fitness inheritance in genetic algorithms for decision
trees. Arxiv preprint cs/0611166 2006.
Received: 8 October 2009 Accepted: 3 February 2010 Published: 3 February 2010
This article is available from: http://www.biomedcentral.com/1472-6947/10/9 © 2010 Grubinger et al; licensee BioMed Central Ltd.
This is an Open Access article distributed under the terms of the Creative Commons Attribution License (http://creativecommons.org/licenses/by/2.0), which permits unrestricted use, distribution, and reproduction in any medium, provided the original work is properly cited.
26. Jin Y: A comprehensive survey of fitness approximation in evolutionary computation. Soft Computing-A Fusion of Foundations, Methodologies and Applications 2005, 9:3-12.
27. Breiman L: Bagging predictors. Machine Learning 1996, 24(2):123-140.
28. Friedman J: Greedy function approximation: a gradient boosting
machine. Annals of Statistics 2001, 29(5):1189-1232.
29. Gao H, Davis J: Sampling Representative Examples for Dimensionality
Reduction and Recognition-Bootsrap Bumping LDA. Lecture Nodes in Computer Science 2006, 3953:275-287.
30. Heskes T: Balancing between bagging and bumping. In Advances in
Neural Information Processing Systems 9 MIT Press; 1997:466-472.
31. Petrikieva L, Fyfe C: Bagging and bumping self-organising maps.
Computing and Information Systems 2002, 9(2):69.
32. Weisstein Eric WA: "Binary Tree." From Math World-A Wolfram Web
Resource. [http://mathworld.wolfram.com/BinaryTree.html]. (accessed
Mai 21, 2009)33.Therneau T, Atkinson E: An introduction to recursive
partitioning using the RPART routines. Mayo Foundation 1997.
34. Hastie T, Tibshirani R, Friedman J: The Elements of Statistical Learning: Data
Mining, Inference, and Prediction Springer; 2008. 35. Bundesministerium für Gesundheit, Familie und Jugend:
Bundesministerium für Gesundheit, Familie und Jugend. [http:// bmg.gv.at]. [accessed on December 23th 2009]36.Chipman H, George E,
McCulloch R: Making sense of a forest of trees. Proceedings of the 30th
Symposium on the Interface 1998:84-92.
37. Miglio R, Soffritti G: The comparison between classification trees
through proximity measures. Computational Statistics and Data Analysis
2004, 45(3):577-593.
38. Ji S, Smith R, Huynh T, Najarian K: A comparative analysis of multi-level
computer-assisted decision making systems for traumatic injuries. BMC Medical Informatics and Decision Making 2009, 9:2.
39. Toussi M, Lamy J, Le Toumelin P, Venot A: Using data mining techniques
to explore physicians' therapeutic decisions when clinical guidelines do not provide recommendations: methods and example for type 2 diabetes. BMC Medical Informatics and Decision Making 2009, 9:28.
40. Barrett J, Mondick J, Narayan M, Vijayakumar K, Vijayakumar S: Integration
of modeling and simulation into hospital-based decision support systems guiding pediatric pharmacotherapy. BMC Medical Informatics and Decision Making 2008, 8:6.
Pre-publication history
The pre-publication history for this paper can be accessed here: http://www.biomedcentral.com/1472-6947/10/9/prepub
doi: 10.1186/1472-6947-10-9
Cite this article as: Grubinger et al., Regression tree construction by
boot-strap: Model search for DRG-systems applied to Austrian health-data BMC