R E S E A R C H
Open Access
Developing a similarity searching module
for patient safety event reporting system
using semantic similarity measures
Hong Kang and Yang Gong
*FromThe International Conference on Intelligent Biology and Medicine (ICIBM) 2016 Houston, Texas, USA. 08-10 December 2016
Abstract
Background:The most important knowledge in the field of patient safety is regarding the prevention and reduction of patient safety events (PSE) during treatment and care. The similarities and patterns among the events may otherwise go unnoticed if they are not properly reported and analyzed. There is an urgent need for developing a PSE reporting system that can dynamically measure the similarities of the events and thus promote event analysis and learning effect.
Methods:In this study, three prevailing algorithms of semantic similarity were implemented to measure the similarities of the 366 PSE annotated by the taxonomy of The Agency for Healthcare Research and Quality (AHRQ). The performance of each algorithm was then evaluated by a group of domain experts based on a 4-point Likert scale. The consistency between the scales of the algorithms and experts was measured and compared with the scales randomly assigned. The similarity algorithms and scores, as a self-learning and self-updating module, were then integrated into the system. Results:The result shows that the similarity scores reflect a high consistency with the experts’review than those randomly assigned. Moreover, incorporating the algorithms into our reporting system enables a mechanism to learn and update based upon PSE similarity.
Conclusion:In conclusion, integrating semantic similarity algorithms into a PSE reporting system can help us learn from previous events and provide timely knowledge support to the reporters. With the knowledge base in the PSE domain, the new generation reporting system holds promise in educating healthcare providers and preventing the recurrence and serious consequences of PSE.
Keywords:Patient safety, Medical errors, Medical informatics
Background
An effective way to learn from patient safety events (PSE) is through reporting system, where events are col-lected in a properly structured format [1]. With the ac-cumulation of the event reports, such a system will turn into a knowledge base of PSE repository which could generate common solutions for cases under investigation [2]. In order to achieve this goal, researchers must meet two essential challenges: 1) how to define the structured format of PSE; and 2) how to measure the similarity
between two PSE. The Common Formats (CF) released by The Agency for Healthcare Research and Quality (AHRQ) [3] and the International Classification of Pa-tient Safety (ICPS) released by the World Health Organization (WHO) [4] defined the types and categor-ies for PSE, which are widely accepted and commonly used in patient safety community. However, neither CF nor ICPS can provide PSE reports comprehensive pro-files for comparison purpose which is the foundation of learning. Researchers are striving to develop new de-scription approaches for PSE reports such as an ontol-ogy in the PSE domain which could better serve the PSE reporting and comparing. By annotating all PSE reports * Correspondence:Yang.Gong@uth.tmc.edu
School of Biomedical Informatics, the University of Texas Health Science Center at Houston, 7000 Fannin St., Houston, TX 77030, USA
to the same ontology, the comparison between two PSE reports could be technically processed through semantic similarity measure as a function that, given two sets of terms annotating two entities, returns a numerical value reflecting the closeness in meaning between the two [5].
As the advent of big data era, semantic similarity algo-rithms have been generally applied in many fields, such as bioinformatics [5–7], geoinformatics [8], linguistics [9, 10] and natural language processing (NLP) [11, 12]. Semantic similarity assesses the degree of relatedness between two entities by the similarity in meaning of their annotations. Basically, there are two types of semantic similarity ap-proaches when comparing terms, edge-based and node-based. Edge-based approaches are based on counting the number of edges in the graph path between two terms [13], for instance, the shortest path or the average of all paths. Correspondingly, node-based approaches focus on comparing the properties of the terms themselves, their ancestors or descendants. Information content (IC), a typ-ical node-based approach, gives a measure of information to every term and regards the information as an important parameter when comparing different annotated entities. Edge-based and node-based approaches are intended to score the similarity between two terms, and must be ex-tended to compare sets of terms such as gene products and PSE reports. Pairwise and group-wise approaches are the two types of strategies applicable for the comparison of term sets. Every term in the direct annotation set A is compared against every term in the direct annotation set B in pairwise approaches, then the semantic similarity is considered by every pairwise combination of terms from the two sets (average, the maximum, or sum) or only the best-matching pair for each term. Group-wise approaches calculate the similarity directly by set, graph, or vector. Set approaches are not widely used since they only consider the direct annotations that would lose a lot of information; based on set similarity techniques, graph approaches rep-resent entities as the subgraphs of the whole annotations and calculate the similarity using graph matching tech-niques; vector approaches compact the information in vector space (VS) as binary fingerprints which are more convenient for comparison.
With a main focus on investigating similarity in mo-lecular biology, the Gene Ontology (GO) [14] is the most common ontology widely adopted by the life sci-ences community, which enables the comparison among gene products at the functional level. Numerous re-searches have demonstrated that the functional related-ness between gene products with GO annotations can be well measured by semantic similarity algorithms [5, 15–19], which demonstrate major significance for gene function studies. AHRQ PSNet (Patient Safety Network) taxonomy [20], in contrast, is also imperative for under-standing the meaning of patient safety and underlying
concepts relate to the existing safety and quality frame-works commonly used in healthcare [21], and for pre-senting an opportunity for healthcare providers to learn from the previous events. In the patient safety commu-nity, there is an urgent need for an approach to compar-ing PSE and offercompar-ing potential solutions based on the compared cases. Intuitively, the form of event data ap-pears similar to that of GO, since a number of taxon-omies have been designed for labeling cases through ontology annotations. Accordingly, the methods that work effectively to compare GO products might be feas-ible when identifying similarities in PSE. However, to our best knowledge, the semantic similarity algorithms have never been adopted and assessed by using patient safety data.
In this study, detailed comparisons were made be-tween GO and the AHRQ PSNet taxonomy from mul-tiple perspectives, based on which we reviewed the semantic similarity measures and analyzed their applic-ability to the AHRQ Morbidity and Mortality Rounds on the Web (WebM&M) database [20]. WebM&M, the only publicly accessible patient safety database with an-notated event reports, makes it possible to compare the reports by applying the semantic similarity measures. A workflow about how to process and assess the semantic similarity measures on WebM&M data was proposed. According to the workflow, several preliminary results were raised for further discussion.
Methods
Dataset comparison
To ensure AHRQ PSNet taxonomy has the potentials to represent PSE features and to support PSE similarity measurement, we compared the characteristics presented in GO against those in AHRQ PSNet taxonomy from five perspectives: 1) stage of development; 2) complexity and independence; 3) quality and maintenance; 4) assessment of similarity; 5) application value of similarity study.
Semantic similarity algorithms
We reviewed the key literature on semantic similarity measures in the field of GO through which we identified and scrutinized diverse semantic similarity approaches according the characteristics of WebM&M data. Using Pesquita’s work [5] as the primary reference, we chose three prevailing approaches from each typical type of se-mantic similarity as the potential assessment candidates. The approaches were applied to measure the PSE simi-larity by calculating a simisimi-larity score based on their an-notations on the AHRQ PSNet taxonomy.
Expert review
and have work experiences in clinical settings participated in the expert review. They are also familiar with patient safety data and the process of PSE reporting. The experts reviewed and judged the degree of relevancy between query case and every other cases through a 4-point Likert scale [22] which contains 1-irrelevant, 2-somewhat irrele-vant, 3-releirrele-vant, and 4-highly relevant. After the experts completed the review, two rounds of discussion were con-ducted to provide a final review result. If an agreement was not reached to certain case, the case would be labeled by a majority. The final expert result was treated as a gold standard. Any case that was labeled as either 1 or 2 by both expert and algorithm was regarded as an “ agree-ment” and judged as being irrelevant to the query case; conversely, the ones that were labeled as either 3 or 4 by expert and algorithm were also regarded as “agreements” but classified as being relevant to the query. The agree-ment ratio between final expert review and algorithm (sample agreement ratio) was calculated by dividing the numbers of agreement cases by the number of total cases. Then we randomly labeled the same group of cases for 10,000 times and calculated the agreement ratios respect-ively (random agreement ratios). One sample t-test was adopted to examine the mean difference between the sam-ple agreement ratio and the random agreement ratios mean (power analysis).
Results
Comparison between GO and WebM&M with AHRQ PSNet taxonomy
Stage of development
To date, GO has been the most widely adopted know-ledge database in the life sciences community for com-paring gene products at the functional level since 1998. GO defines commonly accepted ontology and provides a schema for representing gene product function in the cel-lular context. The GO project has developed formal ontol-ogies that represent over 40,000 biological concepts, which are constantly being revised to reflect new discoveries. WebM&M, an online journal and forum on patient safety and healthcare quality, features expert analysis of anonym-ously reported PSE. Since February 2003, WebM&M has accumulated 366 cases with annotations mapping to a 219-concept taxonomy across six axes (AHRQ PSNet tax-onomy). Apparently, WebM&M has much fewer entities and a less complicated ontology/taxonomy comparing to GO. To our best knowledge, little research on PSE similar-ity has been conducted thus far.
Complexity and Independence
The structure of GO is typical directed acyclic graphs (DAGs), and each term in GO is assigned to one of the three independent root ontologies: molecular function, biological process and cellular component. Although the
six axes of AHRQ PSNet taxonomy are not independent, the data structure of AHRQ PSNet taxonomy is much simpler than that of GO since it has fewer terms and lower complexity.
Quality and maintenance
A consortium of GO [23] is responsible for developing and maintaining GO databases as well as the tools that support the creation, maintenance, and use of all the in-formation. The consortium ensures the high quality of GO. The situation of WebM&M is different because all the annotations are based on voluntarily submissions. Although cases in WebM&M are well scrutinized by the experts in patient safety, keeping the consistency of an-notation may be difficult due to different understanding among diverse expertise across the healthcare domains.
Assessment of similarity
There is an increasing trend in defining functional related-ness through semantic similarity of genes and GO annota-tions. One reason is that the performance of similarity algorithms on GO is much easier to be assessed, since there are plenty of experimental methods providing real similarity measures for gene products which serve as references in the assessment procedure. However, the assessment of similarity algorithms on WebM&M data is much more challenging since there is still no widely accepted method which can sup-ply a real similarity measure between two PSE.
Application value of similarity study
GO provides rich information and a convenient way to study gene functional similarity, which has been success-fully used in various aspects including predicting gene functional associations [24], homology analysis [25], asses-sing target gene functions [26], and predicting subcellular localization [27]. In the patient safety field, the essential purpose of establishing computerized system for PSE reporting is to acquire experiences from previous cases, find solutions for new cases, and reduce the probability of recurrence. Therefore, finding an approach of measuring and assessing the similarity between PSE is considered the primary goal of learning from the PSE reports.
In summary, AHRQ PSNet taxonomy still has room for improvement comparing to the GO which is already a mature product in molecular biology. However, as the only hierarchical feature structure for PSE reports, PSNet taxonomy has the potentials to represent PSE features and to support PSE similarity measurement.
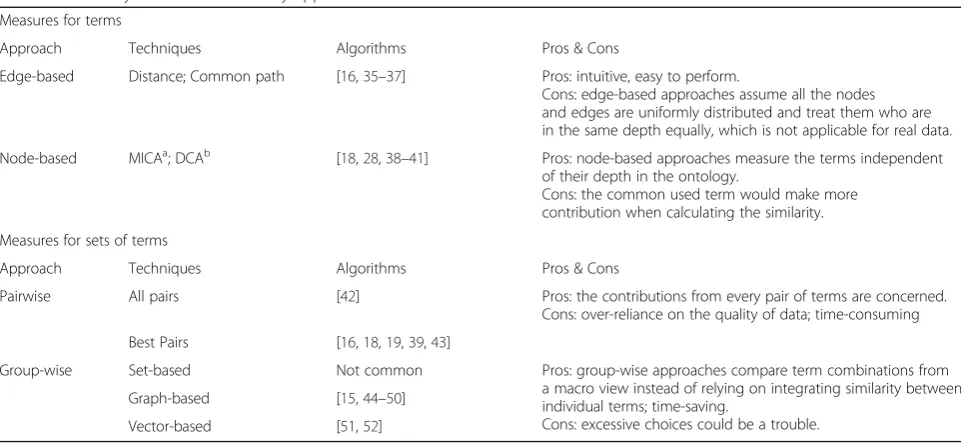
The applicability analysis for semantic similarity methods on WebM&M data
functional relatedness [5]. However, whether these ap-proaches or which of them are applicable for PSE remains unclear. Aiming to narrow the searching scope, we summa-rized the pros and cons for all the above mentioned seman-tic similarity approaches and their typical applications in biomedical researches, as shown in Table 1. Considering the characteristics of the WebM&M data, three approaches (IC model, normalized term overlap model and VS model) were finally involved in our study.
Information Content (IC)
As a classic node-based approach, IC gives a measure on how specific and informative a term is. Towards PSE, it as-sumes that a term with higher probability of occurrence may contribute less when measuring the similarity. In this study, the pairwise strategy which calculated the similarity for all pairs of terms and assessed them with average score was adopted. And we used Lin’s measure of similarity [28] which accounts the IC values for each of termt1andt2in addition
to the lowest ancestor shared between the two terms.
Normalized Term Overlap (NTO)
NTO [15] considers the set of all direct annotations and all of their associated parent terms. Theoretically, NTO might be applicable if the taxonomy is well defined and the reports are well annotated. The only concern is that the depth of AHRQ PSNet taxonomy may be not deep enough to ensure the expected performance of NTO. However, to figure out the applicability of this typical graph-based group-wise approach, we also enrolled this method to our assessment.
Vector Space (VS)
VS compacts the annotations of a set of terms into a binary vector which is more comparable because the model is based on linear algebra with lots of mature al-gorithms which can measure similarity, such as cosine measure [29]. Similar to IC, a variation of VS approach has been used in ontology-based similarity. The ap-proach generates a weight for each term based on the frequency of its occurrence in the corpus, and then re-places the non-zero values in the binary vector with these weights. As the WebM&M cases are well anno-tated in an ontological structure, VS measure, a vector based group-wise approach, may be potentially applic-able to measure the similarity between WebM&M cases.
Workflow for semantic similarity analysis on WebM&M data
Data collection and management
Each WebM&M report contains three parts of informa-tion (summary, commentary and references) and has been annotated by AHRQ PSNet taxonomy with six per-spectives and 219 totally terms. All the reports and an-notations were extracted from WebM&M and managed in our local MySQL database server.
Algorithm implementation
For each approach of IC, NTO and VS, we initialized the weights of the six perspectives equally to calculate the similarity score between every pair of PSE. These weights and the similarity matric would be optimized dynamically all the times based on the feedback or as-sessment from domain experts and end users.
Table 1Summary of semantic similarity approaches Measures for terms
Approach Techniques Algorithms Pros & Cons
Edge-based Distance; Common path [16,35–37] Pros: intuitive, easy to perform.
Cons: edge-based approaches assume all the nodes and edges are uniformly distributed and treat them who are in the same depth equally, which is not applicable for real data.
Node-based MICAa; DCAb [18,28,38–41] Pros: node-based approaches measure the terms independent of their depth in the ontology.
Cons: the common used term would make more contribution when calculating the similarity.
Measures for sets of terms
Approach Techniques Algorithms Pros & Cons
Pairwise All pairs [42] Pros: the contributions from every pair of terms are concerned.
Cons: over-reliance on the quality of data; time-consuming
Best Pairs [16,18,19,39,43]
Group-wise Set-based Not common Pros: group-wise approaches compare term combinations from a macro view instead of relying on integrating similarity between individual terms; time-saving.
Cons: excessive choices could be a trouble. Graph-based [15,44–50]
Vector-based [51,52]
a
MICA = the most informative common ancestor b
Expert review
Expert review introduced in the Methods session were carried out to create the gold standard and assess the performance of the PSE similarity searching model.
Agreement analysis
In order to investigate the agreement between the results provided by an expert and a certain semantic similarity approach, we firstly labeled the same amount of cases which were ranked by similarity scores with a 4-point Likert scale according to the same distribution ratio of the scales rated by the expert. For instance, if the expert labeled three cases with 1-irrelevant, four cases with 2-somewhat irrelevant, six cases with 3-relevant, and seven cases with 4-highly relevant, we would label three cases with the lowest similarity scores as label 1, then label the 4th to 7th lowest ones as label 2, and so on. An agree-ment ratio was calculated to represent the consistency between each pair of expert and semantic similarity approach.
Statistical test
The performance of semantic similarity approaches was assessed by testing the mean difference of the agreement ratios between the random group and the gold standard.
User feedback
The semantic similarity module was embedded into our voluntary PSE reporting system which allows users to provide feedback by clicking a user feedback button to decide whether they agree or disagree with certain case with high similarity against the query case. Then all the feedback will be returned to the algorithm implementa-tion step in order to update the weights of the similarity matrices and consequently improve the performance of the algorithms dynamically. The model is expected to be gradually stabilized and convincing given more feedback is collected and learned.
The main steps of the workflow are shown in Fig. 1.
Case study
In current work, we conducted a detailed study of the three semantic similarity algorithms based on AHRQ PSNet taxonomy. Case 241 [30], a typical event report of nosocomial infection, was chosen as the test query in our study. The similarity list of the query was generated by considering axis “safety target” only, and there were 49 of overall 365 cases with nonzero similarity scores in the result list based on the VS model. The sampling pro-cedure of the 20 cases was as follow. When any of the total 366 cases in the WebM&M database was chosen as a query case, around 50 cases among the other 365 cases had non-zero similarity scores against the query. Consid-ering the draws and close scores, 15 was fixed as an ap-propriate amount to represent the distribution of the cases with non-zero scores. Then five cases with zero scores were randomly selected and added to the review list because the 4-point Likert scale assumes a quarter of the non-query cases are irrelevant to the query case.
Three domain experts were invited to rate the 20 cases without implication. The result shows that the agree-ment of the three experts was 90%, and it was more en-couraging that the three cases judged as relevant to the query (Case 12 [31], 47 [32], and 336 [33]) had the high-est similarity scores calculated by the VS model.
Further analysis on the agreements between algo-rithms and experts was performed. By comparing to the random model, the VS model and TO model reflect a significantly higher consistency with the experts’ review (Table 2).
Discussion Data limitations
Here we discuss some of the limitations of WebM&M data. The most obvious defect of WebM&M data is the limited sample size. The inclusion criteria of WebM&M are unclear, however, based on our observation, the cases in WebM&M may be chosen as the most typical ones in each category. For example, patient fall, the most com-mon event type, only has four records in WebM&M,
which does not mean patient fall is infrequent, rather in-dicates the other cases might be similar to the four typ-ical samples and thus were not included by the WebM&M editors. It is also one of the reasons that IC has the worst performance. However, according to the status quo, WebM&M seems to be the best choice for this study since it is by far the only publically accessible taxonomy-based PSE database. Fortunately, the users’ feedback mechanism may reduce the bias caused by the small sample size. The feedback is regarded as an im-portant dynamic parameter which will be used in updat-ing the weights and improvupdat-ing the similarity matrices. Theoretically, the performance of the system would be more effective and reliable as the increase of user feedback.
Another limitation of WebM&M data is the quality of taxonomy. The taxonomy was initially designed for PSE classification and reference rather than providing basic systematic knowledge. In contrast, GO is more suitable for semantic similarity algorithms. Actually, better op-tions, such AHRQ CF, in patient safety community are available with a focus on the structured form only, un-fortunately they are not yet linked with WebM&M. Nevertheless, our group is concurrently designing a novel PSE ontology by integrating multiple patient safety resources, based on which new cases reported by users will be automatically annotated. Meanwhile, we are also trying to find a way to make direct connections among different PSE ontologies and annotate previous cases with the new integrated ontology, thereby, there will be a rapid growth in our database. Overall, the assessment of semantic similarity measures in this study is an essen-tial preliminary work. There are limited effects made by the unsatisfied quality of AHRQ PSNet taxonomy.
Assessment strategy
The assessment of semantic similarity measures on WebM&M data is more challenging than that of GO be-cause there is still no benchmark for the similarity meas-urement between two PSE. The assessment strategy in this study is based on that the judgments from the ex-perts are considered as gold standard, to which the re-sults of similarity algorithms are compared. Moreover, the agreement ratio can be used to reduce the subjective
bias, based on the idea of Content Validity Index [34]. The assessment then turns to a statistical issue regarding testing the mean value of the agreement ratios from se-mantic similarity approaches and random samplings to expert reviews. Again, as aforementioned, the users’ feedback mechanism is another module designed to complement the lack of assessment methods and to en-hance the performance of the whole system.
In the first round of expert review, the 20 cases were selected based on the similarity list provided by VS model. However, it seems unfair to use these cases to measure the performance of the other two models, TO and IC. In order to reduce the assessment biases, additional two rounds of expert reviews would be ne-cessary with a focus on the similarity results of TO and IC respectively.
The overarching goal
In the field of patient safety, most problems are not just a series of random, unconnected one-off events. Conse-quently, the basic assumption of our study is that PSE are provoked by weak systems and often have common root causes which can be generalized and corrected. The fun-damental role of PSE reporting systems is to enhance pa-tient safety by learning from failures of healthcare system. Thus, we summarized the prototype of an ideal reporting system, representing the objective of our research.
Ontology
It is an undoubted kernel of the whole system since an ontology could help us acquire effective experience from previous PSE depending on the quality of the knowledge base. An ideal PSE ontology should be detailed but not cumbersome, and cover all necessary categories and classification criteria of events. The ontology should be able to access the CF and ICPS by providing special interface for format conversation.
Database
The size and quality of the database influence the range of knowledge provided by the system. It is always the most difficult part when establishing a database, espe-cially in the patient safety area, the main reasons of which are the absence of public resources and the in-compatibility among various data formats.
Similarity module
It serves as the engine of the event reporting system since the ultimate goal of using the system, i.e., getting similar cases and potential solutions for the current event, depends on the performance of the similarity al-gorithms. In terms of the ontology structure, semantic similarity measures seem to be the most applicable ap-proaches for developing the module.
Table 2The agreements between the algorithms and the experts
Model Agreement with Expert 1
Agreement with Expert 2
Agreement with Expert 3
VS 80%** 90%** 90%**
TO 90%** 80%* 90%**
IC 70% 70% 70%
Interface
The value of the system is reflected by user experience. Failure in user-centered design may largely account for the issues of low user acceptance and low-quality data that pervasively stored in such PSE systems. A well-designed PSE reporting system should have no limit for multiple educational levels without too much instruction of usage. Besides, as a voluntary reporting system the hints and common solutions should be highlighted since both could motivate users to continue reporting.
Conclusions
Voluntary PSE reporting systems have great potential for im-proving patient safety through wide adoption and effective use in healthcare. The similarity analysis of events is a key to the success of such systems. This paper summarized the pros and cons of semantic similarity measures when applicable for comparing PSE, and suggested that two typical ap-proaches effectively serve the comparison purpose. We also provided an initial workflow for applying semantic similarity measures in AHRQ WebM&M data, which are worth par-ticular attention of researchers in the patient safety area. The new generation of PSE reporting system holds promise in triggering a revolution of data management and promoting learning in the patient safety community.
Abbreviations
AHRQ:The Agency for Healthcare Research and Quality; CF: Common Formats; GO: Gene Ontology; IC: Information Content; ICPS: International Classification of Patient Safety; NTO: Normalized Term Overlap; PSE: Patient Safety Events; PSNet: Patient Safety Network; VS: Vector Space;
WebM&M: Morbidity and Mortality Rounds on the Web
Acknowledgements
We thank the experts for their expertise and participation in expert review.
Funding
This project is supported by UTHealth Innovation for Cancer Prevention Research Training Program Post-Doctoral Fellowship (Cancer Prevention and Research Institute of Texas grant #RP160015), Agency for Healthcare Research & Quality (1R01HS022895), and University of Texas System Grants Program (#156374).
Availability of data and materials Not applicable.
Authors’contributions
HK and YG designed the experiment. HK prepared the data, carried out the analyses and drafted the manuscript. YG organized the evaluation and revised the manuscript. Both authors read and approved the final manuscript.
Competing interests
The authors declare that they have no competing interests.
Consent for publication Not applicable.
Ethics approval and consent to participate
Protection of Human Subjects will be conducted according to the study protocol to be approved by the Institutional Review Board (IRB) of the University of Texas Health Science Center at Houston (UTHealth) (HSC-SBMI-12-0767) and in compliance with the National Institutes of Health human subject regulations.
About this supplement
This article has been published as part ofBMC Medical Informatics and Decision MakingVolume 17 Supplement 2, 2017: Selected articles from the International Conference on Intelligent Biology and Medicine (ICIBM) 2016: medical informatics and decision making. The full contents of the supplement are available online at https://bmcmedinformdecismak.biomedcentral.com/articles/supplements/ volume-17-supplement-2.
Publisher’s Note
Springer Nature remains neutral with regard to jurisdictional claims in published maps and institutional affiliations.
Published: 5 July 2017
References
1. Murff HJ, Patel VL, Hripcsak G, Bates DW. Detecting adverse events for patient safety research: a review of current methodologies. JBI. 2003;36(1–2): 131–43.
2. Gong Y. Data consistency in a voluntary medical incident reporting system. J Med Syst. 2011;35(4):609–15.
3. AHRQ. Users guide AHRQ Common formats for patient safety organizations. In: 0.1 Beta Release. Rockville: Agency for healthcare Research and Quality; 2008. 4. WHO. The conceptual framework for the international classification for
patient safety. In: 1.0 for use in field testing. Washington, DC: World Health Organization; 2007. p. 48.
5. Pesquita C, Faria D, Falcao AO, Lord P, Couto FM. Semantic similarity in biomedical ontologies. PLoS Comput Biol. 2009;5(7):e1000443. 6. Guzzi PH, Mina M, Guerra C, Cannataro M. Semantic similarity analysis of
protein data: assessment with biological features and issues. Brief Bioinform. 2012;13(5):569–85.
7. Benabderrahmane S, Smail-Tabbone M, Poch O, Napoli A, Devignes MD. IntelliGO: a new vector-based semantic similarity measure including annotation origin. BMC Bioinform. 2010;11:588.
8. Janowicz K, Raubal M, Kuhn W. The semantics of similarity in geographic information retrieval. J Spat Inf Sci. 2011;2:29–57.
9. Kaur I, Hornof AJ. A Comparison of LSA, WordNet and PMI for Predicting User Click Behavior. In: Proceedings of the Conference on Human Factors in Computing: 2005. New York: CHI; 2005. p. 51–60.
10. Yu Z, Bernstam E, Cohen T, Wallace BC, Johnson TR. Improving the utility of MeSH(R) terms using the TopicalMeSH representation. J Biomed Inform. 2016;61:77–86.
11. Gracia J, Mena E. Web-based measure of semantic relatedness. In: Proceedings of the 9th international conference on Web information systems engineering (WISE‘08). Berlin: Springer; 2008. p. 136–50. 12. Pirolli P. Rational analyses of information foraging on the Web. Cognit Sci.
2005;29(3):343–73.
13. Rada R, Mili H, Bicknell E, Blettner M. Development and application of a metric on semantic nets. IEEE Trans Syst Man Cybern. 1989;19:17–30. 14. Harris MA, Clark J, Ireland A, Lomax J, Ashburner M, Foulger R, Eilbeck K,
Lewis S, Marshall B, Mungall C, et al. The gene ontology (GO) database and informatics resource. Nucleic Acids Res. 2004;32(Database issue):D258–261. 15. Mistry M, Pavlidis P. Gene ontology term overlap as a measure of gene
functional similarity. BMC Bioinform. 2008;9:327.
16. del Pozo A, Pazos F, Valencia A. Defining functional distances over gene ontology. BMC Bioinform. 2008;9:50.
17. Lim WK, Wang K, Lefebvre C, Califano A. Comparative analysis of microarray normalization procedures: effects on reverse engineering gene networks. Bioinformatics. 2007;23(13):i282–288.
18. Schlicker A, Domingues FS, Rahnenfuhrer J, Lengauer T. A new measure for functional similarity of gene products based on gene ontology. BMC Bioinform. 2006;7:302.
19. Wang JZ, Du Z, Payattakool R, Yu PS, Chen CF. A new method to measure the semantic similarity of GO terms. Bioinformatics. 2007;23(10):1274–81. 20. WebM&M Cases & Commentaries. https://psnet.ahrq.gov/webmm. 21. Runciman WB, Baker GR, Michel P, Dovey S, Lilford RJ, Jensen N, Flin R,
Weeks WB, Lewalle P, Larizgoitia I, et al. Tracing the foundations of a conceptual framework for a patient safety ontology. Qual Saf Health Care. 2010;19(6):e56.
22. Likert R. A technique for the measurement of attitudes. Arch Psychol. 1932; 140:1–55.
24. Vafaee F, Rosu D, Broackes-Carter F, Jurisica I. Novel semantic similarity measure improves an integrative approach to predicting gene functional associations. BMC Syst Biol. 2013;7:22.
25. Nehrt NL, Clark WT, Radivojac P, Hahn MW. Testing the ortholog conjecture with comparative functional genomic data from mammals. PLoS Comput Biol. 2011;7(6):e1002073.
26. Lewis BP, Shih IH, Jones-Rhoades MW, Bartel DP, Burge CB. Prediction of mammalian microRNA targets. Cell. 2003;115(7):787–98.
27. Lu Z, Hunter L. Go molecular function terms are predictive of subcellular localization. Pac Symp Biocomput. 2005:151–161. https://www.ncbi.nlm.nih. gov/pmc/articles/PMC2652875/.
28. Lin D. An information-theoretic definition of similarity. In: Proceedings of the 15th international conference on machine learning: 1998. San Francisco: Morgan Kaufmann; 1998. p. 296–304.
29. Popescu M, Keller JM, Mitchell JA. Fuzzy measures on the gene ontology for gene product similarity. IEEE/ACM Trans Comput Biol Bioinform. 2006;3(3):263–74. 30. Case 241: Outbreak. https://psnet.ahrq.gov/webmm/case/241.
31. Case 12: Bloody BP Cuff. https://psnet.ahrq.gov/webmm/case/12. 32. Case 47: Environmental Safety in the OR. https://psnet.ahrq.gov/webmm/case/47. 33. Case 336: Ebola: Are We Ready? https://psnet.ahrq.gov/webmm/case/336. 34. Polit DF, Beck CT. The content validity index: are you sure you know what's being
reported? critique and recommendations. Res Nurs Health. 2006;29(5):489–97. 35. Yu H, Gao L, Tu K, Guo Z. Broadly predicting specific gene functions with
expression similarity and taxonomy similarity. Gene. 2005;352:75–81. 36. Cheng J, Cline M, Martin J, Finkelstein D, Awad T, Kulp D, Siani-Rose MA. A
knowledge-based clustering algorithm driven by gene ontology. J Biopharm Stat. 2004;14(3):687–700.
37. Wu H, Su Z, Mao F, Olman V, Xu Y. Prediction of functional modules based on comparative genome analysis and Gene Ontology application. Nucleic Acids Res. 2005;33(9):2822–37.
38. Resnik P. Using information content to evaluate semantic similarity in a taxonomy. In: Proceedings of the 14th international joint conference on artificial intelligence: 1995. 1995. p. 448–53.
39. Couto FM, Silva MJ, Coutinho PM. Semantic similarity over the gene ontology: family correlation and selecting disjunctive ancestors. In: Proceedings of the ACM conference in information and knowledge management as a short paper. 2005. p. 2005.
40. Jiang J, Conrath D. Semantic similarity based on corpus statistics and lexical taxonomy. In: Proceedings of the 10th international conference on research on computational linguistics: 1997; Taiwan. 1997.
41. Bodenreider O, Aubry M, Burgun A. Non-lexical approaches to identifying associative relations in the gene ontology. Pac Symp Biocomput. 2005:91– 102. https://www.ncbi.nlm.nih.gov/pmc/articles/PMC2224899/.
42. Lord PW, Stevens RD, Brass A, Goble CA. Investigating semantic similarity measures across the gene ontology: the relationship between sequence and annotation. Bioinformatics. 2003;19(10):1275–83.
43. Mahdavi MA, Lin YH. False positive reduction in protein-protein interaction predictions using gene ontology annotations. BMC Bioinform. 2007;8:262. 44. Lee HK, Hsu AK, Sajdak J, Qin J, Pavlidis P. Coexpression analysis of human
genes across many microarray data sets. Genome Res. 2004;14(6):1085–94. 45. Martin D, Brun C, Remy E, Mouren P, Thieffry D, Jacq B. GOToolBox: functional
analysis of gene datasets based on gene ontology. Genome Biol. 2004;5(12):R101. 46. Ye P, Peyser BD, Pan X, Boeke JD, Spencer FA, Bader JS. Gene function
prediction from congruent synthetic lethal interactions in yeast. Mol Syst Biol. 2005;1:2005–0026.
47. Cho YR, Hwang W, Ramanathan M, Zhang A. Semantic integration to identify overlapping functional modules in protein interaction networks. BMC Bioinform. 2007;8:265.
48. Lin N, Wu B, Jansen R, Gerstein M, Zhao H. Information assessment on predicting protein-protein interactions. BMC Bioinform. 2004;5:154. 49. Sheehan B, Quigley A, Gaudin B, Dobson S. A relation based measure of
semantic similarity for gene ontology annotations. BMC Bioinform. 2008;9:468. 50. Pesquita C, Faria D, Bastos H, Ferreira AE, Falcao AO, Couto FM. Metrics for
GO based protein semantic similarity: a systematic evaluation. BMC Bioinform. 2008;9(Suppl 5):S4.
51. Huang DW, Sherman BT, Tan Q, Collins JR, Alvord WG, Roayaei J, Stephens R, Baseler MW, Lane HC, Lempicki RA. The DAVID gene functional classification tool: a novel biological module-centric algorithm to functionally analyze large gene lists. Genome Biol. 2007;8(9):R183. 52. Chabalier J, Mosser J, Burgun A. A transversal approach to predict gene
product networks from ontology-based similarity. BMC Bioinform. 2007;8:235.
• We accept pre-submission inquiries
• Our selector tool helps you to find the most relevant journal
• We provide round the clock customer support
• Convenient online submission
• Thorough peer review
• Inclusion in PubMed and all major indexing services
• Maximum visibility for your research
Submit your manuscript at www.biomedcentral.com/submit