S
BOSNIAN JOURNAL OF BASIC MEDICAL SCIENCES 2009; 9 (SUPPLEMENT 1): S77-S82
&
Abstract
Th e pedicle screw diameter, composite and design are variables that can aff ect the threshold of intraop-erative electromyographic monitoring. Even though we know that larger diameter objects tend to have less resistance, no study documented the eff ect that this variable could have on pedicle screw resistance. Using high quality equipment, resistance and resistivity of ten pedicle screws (from four manufactur-ers) were calculated based on known constant current and measured voltage. Voltage was measured three times for each screw to determine intraobserver measurement variability. Resistance of all screws ranged from. to . mΩ (mean = .±. mΩ). Th e screw with largest diameter (. mm) had lower resistance than screws with other diameters. Resistivity of screws ranged from . to . μΩ•m (mean = .±. μΩ•m). Based on the screw design, one manufacturer’s pedicle screws (A) had signifi cantly lower resistivity compared to three other manufacturers (p<.). Larger diameter screws (. mm in diameter) had lower resistance. Screw design (polyaxial or monoaxial) had no eff ect on its resistance. Screws of one manufacturer (A) showed lower resistivity compared to those manufactured by other three companies.
KEY WORDS: pedicle screw, electrical resistance, electrical resistivity, intraoperative neuromonitoring
EVALUATION OF THE
INTRINSIC PROPERTIES
OF PEDICLE SCREWS:
DO DIAMETER,
MANUFACTURING
AND SCREW DESIGN
AFFECT RESISTANCE
AND/OR RESISTIVITY
Worawat Limthongkul1, Jason Savage2,
Emmanuel K. Nenonene3, Eldin E. Karaikovic1*
¹ Department of Orthopaedic Surgery, North Shore University Health
Systems (NUH), University of Chicago, IL, USA
² Department of Orthopaedic Surgery, Northwestern University, Chicago, IL, USA ³ Department of Neurology, University of Chicago, Chicago, IL, USA
S
BOSNIAN JOURNAL OF BASIC MEDICAL SCIENCES 2009; 9 (SUPPLEMENT 1): S78-S82Introduction
In the past decade, pedicle screw systems have proven to provide the highest biomechanical stability in spinal in-strumentation, which gives a surgeon greater fl exibility to accommodate patient’s intrinsic anatomy. To achieve maximum fi xation, the screw should be placed properly within the pedicle. Due to a high variability of pedicle ge-ometry (), the rates of pedicle cortical perforation have been reported to be between . and (-). Clini-cally, this is relevant because an incorrect placement of a pedicle screw not only leads to suboptimal spinal stabil-ity and higher incidence of pseudoarthrosis (), but also may lead to neurological irritation or nerve root injury.
An intraoperative electrical testing of pedicle screws is a widely accepted technique of minimizing intra-operative nerve root irritation or an injury during in-sertion of spinal instrumentation. A properly placed screw can be distinguished from those that perforate a pedicle wall by its minimum level (threshold) of the electrical current needed to elicit a compound muscle action potential (CMAP). On the other hand, stimu-lation thresholds have been shown to vary in sev-eral studies. The strong likelihood of a pedicle wall defect and a potential screw contact with a nerve root and/or the dura ranged from mA to mA (-).
Diff erences in CMAP threshold values may be attrib-uted to a host of variables (screw, bone, nerve, muscle, subcutaneous fat tissue and skin). One variable that can aff ect the threshold is electrical conductivity of pedicle screws: their resistivity and resistance. Electrical
resistiv-ity (specifi c electrical resistance) is the property of an element that shows how strongly material opposes elec-trical current. High resistivity indicates that a material strongly opposes the movement of the electrical charge. Resistance is a material’s opposition to the fl ow of the current, which is aff ected by its length, diameter and resistivity. Resistance of a pedicle screw may vary with its length, diameter and resistivity of the material as well. This may affect electrical conduction during intraop-erative neuromonitoring. To our knowledge, no earlier study evaluated eff ects of screw diameter, screw manu-facturing and design on its intrinsic electrical properties.
Materials and Methods
Ten titanium alloy (Ti-Al-V) pedicle screws from four diff erent manufacturers (Table ) commonly used in spine surgery were inserted into an aluminum block to provide a connection with the current source. A current meter (Kiethley system digits multimeter, Kiethley Instruments, Inc., Cleveland, Ohio, USA) was attached to the aluminum block with a current wire on one side, and through a surgical monopolar probe (WR Medi-cal Electronics Company, Stillwater, MN, USA) on the other. Th e probe was manually kept in contact with a pedicle screw in order to test its resistance based on screw design. Th is created an electrical circuit (Figure).
S
BOSNIAN JOURNAL OF BASIC MEDICAL SCIENCES 2009; 9 (SUPPLEMENT 1): S79-S82
passed through a screw via current wire. Generated voltage was recorded using a voltmeter (HPA digital multimeter, Hewlett-Packard Company Test and Measurement Organization, Santa Clara, CA, USA). Th e resistance was calculated based on Ohm’s law (R=V/I); where R is resistance of an object (mea-sured in ohms; Ω), V is a potential diff erence across an object (measured in volts) and I is a current through an object (measured in amperes). Each screw was tested three times to minimize an intraobserver er-ror. Each screw had several diameters (Table ).
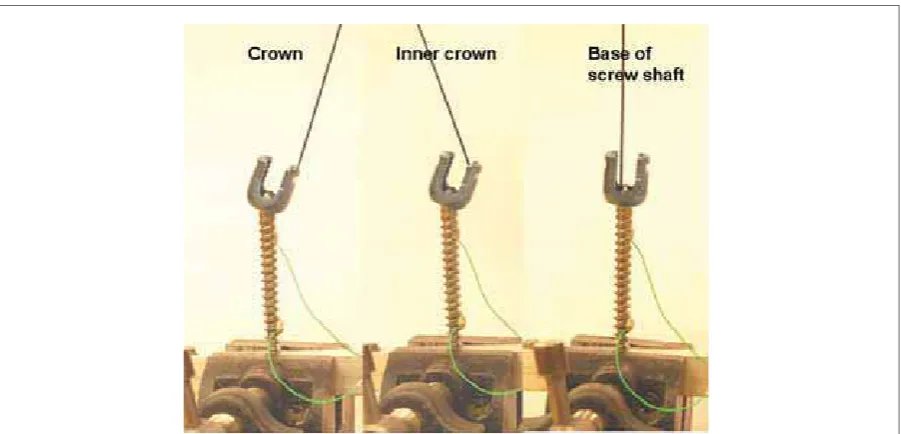
In order to test the difference in conductivity at dif-ferent screw sites based on screw design (monoaxial versus polyaxial), we attached a contact with mono-polar probe in three different locations on the screw surface; the screw top (the top of the screw crown
surface), the inner surface (the inner site of the crown) and the screw shaft (a hexagonal screw base) (Figure ). Resistivity of a screw was then calculated based on ρ = R• A / ℓ, where ρ is resistivity of a material (mea-sured in Ω•m), R is resistance of an object (mea-sured in ohms), A is a cross sectional area (mea-sured in m), and ℓ is a length (measured in meters).
Statistical analysis was done by using SAS . (SAS In-stitute, Cary NC) software and ANOVA. In order to see diff erence between groups of screws of diff erent diam-eters we used Tukey grouping as the statistic method to categorize the data. Mean values of screw resistance within the same Tukey group are not statistically diff er-ent. As it is shown in Table , there are diff erent cat-egories of screw sizes, which based on their means are grouped in four groups: Group I (. and . millimeter screws with not statistically different means: . and . respectively); Group II (. and . mm screws had no statistically diff erent means: . and . respectively): Group III (., , and . mm screws had no statistically diff erent means from each other, but they had statistically diff erent means from everyone in groups I, II and IV); and Group IV (. mm screws had a mean of ., statistically different from all other groups). Screw
Manufacturer Screw material Screw design
Screw diameter (mm) A Titanium alloy* Monoaxial 6.25, 7.75 B Titanium alloy* Polyaxial 6.2, 7.0 C Titanium alloy* Polyaxial 5.5, 6.5, 7.0 D Titanium alloy* Monoaxial 5.5, 6.5, 7.5
Screw
manufacturer Test trial A A B B C C C D D D
Screw size 6.25 7.75 6.2 7 5.5 6.5 7 5.5 6.5 7.5
Measured voltage (mV)
1 0.2074 0.1401 0.2923 0.24 0.3922 0.3394 0.2134 0.3081 0.3203 0.2362
2 0.2083 0.1412 0.2927 0.2404 0.3926 0.3391 0.2135 0.3084 0.3201 0.2367
3 0.2068 0.1424 0.2925 0.2393 0.3932 0.3392 0.2132 0.3082 0.3198 0.2364
TABLE 1. Screws used in the study
*T i-6Al-4V alloy anodized thickness from ~50 nm to ~1μm
S
BOSNIAN JOURNAL OF BASIC MEDICAL SCIENCES 2009; 9 (SUPPLEMENT 1): S80-S82Note that the size . mm is in both groups I and II. So while size . is the same group as size ., and the size . is the same as group ., we cannot say that . is the same as ., because . and . are not in the same group; they have statistically different means)
Results
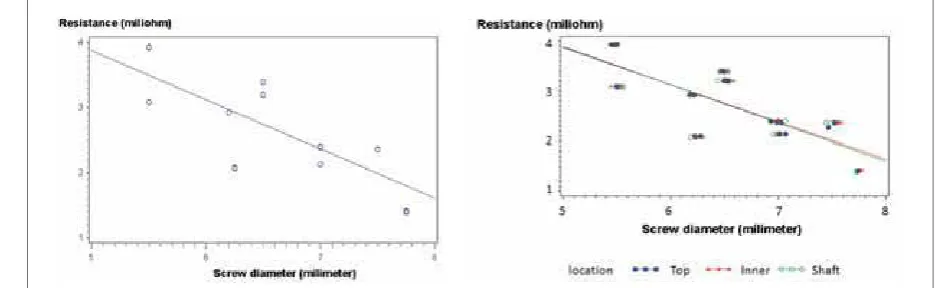
The obtained voltages and calculated resistance val-ues for each screw are summarized in Table and Table . Resistance of all screws ranged from . to . mΩ (mean = .±. mΩ). Th ere was a strong nega-tive linear correlation (r= /-./, p<.) between resistance and a screw diameter (Figure ). By treat-ing each screw diameter as a Tukey category (a screw size was treated as a categorical variable, and not as an ordinal or a scale), .-diameter screw (group IV in Table ) had lower resistance than other diameter screws. A screw design (polyaxial versus monoaxial) and the location of a monopolar probe attachment had
no effect on measured screw resistance (Figure ). Resistivity of screws also varied from . to . μΩ•m (mean = .±. μΩ•m). Resistivity values of each screw diameter and manufacturer were sum-marized in Table . Manufacturer A screws had than screws from other three manufacturers ANOVA, p<.) (Figure ). We found no statistically signifi cant diff erences in screw resistivity among three other manu-facturers (B, C and D) regardless of a screw diameter.
Discussion
In regards to resistance, our study showed that larger diameter screws with the same manufacturing process had lower resistance and more current fl owed through it. However, a manufacturing process might alter the results as the .mm diameter from one manufac-turer (manufacmanufac-turer A) showed as low resistance as the .mm or .mm diameter screws from other manu-facturers (manufacturer B, C and D). (see group III in Table ). Electrical resistivity of titanium is known to be . μΩ•m (). In our study, resistivity of pedicle screws had higher ranges, from . to . μΩ•m (Table ). Screws A showed a signifi cantly lower resis-tivity when compared to screws of other three manu-facturers (B, C and D). Th e diff erence in resistivity may be caused by diff erence in the process of anodization of screws (changing the voltage, electrolyte and tem-perature). Anodization of a titanium pedicle screw is a surface modifi cation process that increases resistance Screw
manufacturer Test trial A A B B C C C D D D
Screw size 6.25 7.75 6.2 7 5.5 6.5 7 5.5 6.5 7.5
Screw resistance
(mΩ)
1 2.074 1.401 2.923 2.4 3.922 3.394 2.134 3.081 3.203 2.362
2 2.083 1.412 2.927 2.404 3.926 3.391 2.135 3.084 3.201 2.367
3 2.068 1.424 2.925 2.393 3.932 3.392 2.132 3.082 3.198 2.364
Tukey Grouping
Mean resistance [mΩ]
Number of screw
Screw diameter [mm]
I 3.5045 6 5.5
II I 3.2965 6 6.5
II 2.9250 3 6.2
III 2.3643 3 7.5
III 2.2663 6 7
III 2.0750 3 6.25
IV 1.4123 3 7.75
TABLE 3. Calculated screw resistance values.
S
BOSNIAN JOURNAL OF BASIC MEDICAL SCIENCES 2009; 9 (SUPPLEMENT 1): S81-S82
to corrosion and a stability of a material. It is known that this process increases thickness of a titanium oxide layer on its surface and causes changes in a color of a screw and therefore potentially changes resistivity ().
By measuring most of the same size screws (xmm), Anderson et al () demonstrated a resistance range from to . Ω, both for titanium and stainless steel screws across all regions except the mobile crowns of polyaxial screws. Th eir higher resistance was explained by increased resistance across the mobile crown-shank connection (up to . Ω) or by high contact resistance between a screw and a measuring instrument. Th ey also recommended placing the monopolar probe in contact with the hexagonal base of a screw shaft or directly on a screw shank below the crown in order to reduce a false-negative result. In our study, we found no diff erence between diff erent probe locations (outer and inner mo-bile crown versus a screw’s shank stimulation) and volt-age through a screw. A probable reason for that is that the equipment used in our study was more accurate.
Furthermore, in our study, measured screw resistances were lower (. to . mΩ) than in Anderson’s () study. We believe that the reason for that is that the contact resistance between a screw and a voltage wire was reduced by using highly electrical conductive ele-ments such as silver epoxy in our study. During testing, we observed that a negligible voltage decrease occurred regardless of current strength (for currents as high as Ampers, the voltage drop was less than . Volt).
Other parameters with higher resistance that can in-terfere with an intraoperative spinal cord monitoring in vivo are: pedicle cortical thickness, conditions of a recording nerve, conductivity of a muscle and thickness of a subcutaneous fat layer when using percutaneous
compound muscle action potential recording. (Figure ), however, these factors were not examined in this study. More signifi cant reduction in voltage will occur at the interface between a metal screw and a bone into which a screw is inserted. Bone and fat tissue (both perineu-ral and subcutaneous) showed signifi cantly higher re-sistivity among other human tissues due to low water content (the mean of Ω•m in cortical bone and . Ω•m in fat tissue).(, ) With an intact ped-icle, more current (>mA) is needed to pass through a bone in order to be recorded in a peripheral nerve. Other potential pitfalls in neuromonitoring may be caused by an actual condition of a nerve root. Us-ing direct stimulation to a nerve root after decom-pression, Holland et al () showed that signifi cantly higher stimulus intensities were required to evoke myogenic responses from chronically compressed nerve roots compared with normal nerve roots. It is possible that a channel with lower resistance such as fluid in the operative field or a blood vessel next to a nerve root may conduct the electrical cur-rent to the nerve as well. With prolong nerve root compression, a perineural fat tissue may diminish and may not play an important role in conduction.
stimu-S
BOSNIAN JOURNAL OF BASIC MEDICAL SCIENCES 2009; 9 (SUPPLEMENT 1): S82-S82lation. Therefore, in a large diameter screws even lower threshold (below mA) might not necessary indicate screw perforation through the pedicle cor-tex, and a possible nerve root injury. One has to keep in mind that manufacturing process might increase or decrease screw resistivity and ultimately determine whether these variables have an effect on an intra-operative spinal cord monitoring. Since the obtained values of resistance are very small (in milliohms), po-tential clinical implications are not easily predictable.
Th e question of clinical relevance of our data remains open and further research on this is needed. Based on the combined results of an animal study and a prospec-tive clinical series some authors () recommended that threshold stimulus intensity higher than . mA is to be considered an indicator that a pedicle screw was entirely within the pedicle, while intensity below that threshold was considered to be an indicator for a po-tential pedicle wall defect due to screw perforation and a possible contact of a screw with a nerve root. Th ese values are not absolute so direct palpation of the
in-ner pedicle wall, intra-operative radiographs and direct visualization should be considered as well. In our insti-tution, we use mA as a threshold as recommended by Clements et al. () Because of these considerations and the fact that these threshold values are not absolute, although the diff erence in resistivity of larger diameter pedicle screw was statistically signifi cant in our study, the clinical relevance is not strongly evident since cur-rent technology can not successfully detect such small differences in resistivity (milli-Ampers). These differ-ences are merely an indicator of the diff erence in the quality and resistivity of the diff erent screws used for spinal fusion. Future research should look into other factors that might affect threshold stimulus intensity such as thickness and resistance of a pedicle cortex around a pedicle screw as well as a subjective inter-pretation of recordings by an interpreter. During the intraoperative pedicle screw stimulation, values are not defi nitive as a threshold is identifi ed only when a clear and relatively robust CMAP is obtained of the time. Nevertheless a very high threshold is a good indicator of an appropriate pedicle screw placement.
References
() Zindrick M.R., Wiltse L.L., Doornik A., Widell E.H., Knight G.W., Patwardhan A.G., Th omas J.C., Rothman S.L., Fields B.T. Analysis of the morphometric characteristics of the thoracic and lumbar pedicles. Spine ; :-.
() Gertzbein S.D., Robbins S.E. Accuracy of pedicular screw place-ment in vivo. Spine. ;():-.
() George D.C., Krag M.H., Johnson C.C., Van Hal ME, Haugh L.D., Grobler LJ. Hole preparation techniques for transpedicle screws. Effect on pull-out strength from human cadaveric vertebrae. Spine. ;():-.
() Glassman S.D., Diamar J.R., Puno R.M., Johnson J.R., Shields C.B., Liden R.D. A prospective analysis of intraoperative electromyo-graphic monitoring of pedicle screw placement with computed tomographic scan confi rmation. Spine ;:-
() Lenke L.G., Padberg A.M., Russo M.H., Bridwell K.H., Gelb D.E. Triggered electromyographic threshold for accuracy of pedicle screw placement. An animal model and clinical correlation. Spine. ;():-.
() Raynor B.L., Lenke L.G., Bridwell K.H., Taylor B.A., Padberg A.M. Correlation between low triggered electromyographic thresholds and lumbar pedicle screw malposition: analysis of screws. Spine. ;():-.
() Maguire J., Wallace S., Madiga R., Leppanen R., Draper V. Evalua-tion of intrapedicular screw posiEvalua-tion using intraoperative evoked electromyography. Spine. ;():-.
() Calancie B., Madsen .P, Lebwohl N. Stimulus-evoked EMG mon-itoring during transpedicular lumbosacral spine instrumentation: initial clinical results. Spine ;:–.
() Djurasovic M., Dimar J.R nd, Glassman SD, Edmonds HL, Carreon LY. A prospective analysis of intraoperative electromyo-graphic monitoring of posterior cervical screw fi xation. J Spinal Disord Tech ;():-.
() Clements D.H., Morledge D.E., Martin W.H., Betz R.R. Evoked and spontaneous electromyography to evaluate lumbosacral pedicle screw placement. Spine ;():-.
() Lütjering G., Williams J.C. Titanium. New York: Springer.,
() Anderson D.G., Wierzbowski L.R., Schwartz D.M., Hilibrand A.S., Vaccaro A.R., Albert T.J. Pedicle screws with high electri-cal resistance: a potential source of error with stimulus-evoked EMG. Spine ;():-.
() Faes T.J.C., van der Meij H.A., de Munck J.C. and Heethaar R M. Th e electric resistivity of human tissues ( Hz– MHz): a meta-analysis of review studies. Physiol. Meas. ; : R–R
() Geddes L.A., Baker L.E. Th e specifi c resistance of biologic ma-terial: A compendium of data for the biomedical engineer and physiologist. Med. Biol. Eng. ;:–.