NEURAL NETWORK BASED MODEL FOR PREDICTING THE
NUMBER OF SLEEPING CARS IN RAIL TRANSPORT
DraganaMacura1, Milica Šelmić2, Branka Dimitrijević3, Milorad Miletić4
1, 2, 3, 4 University of Belgrade, Faculty of Transport and Traffic Engineering, Vojvode Stepe 305, 11000
Belgrade, Serbia
Received 15 November 2014; accepted 21 January 2015
Abstract: A Decision Support System based on Artificial Neural Network is developed to forecast the number of sleeping cars in rail transport. The inputs to the system consist of train route, month, type of sleeping car, number of berths (supply), number of departures, ticket price and GDP, while the output of the neural network is the number of sold tickets (demand). By comparing the results obtained through the model with those resulting from historical data, it has been found that the developed model is highly compatible with reality. The developed Decision Support System could be used for capacity planning purposes, because it is important for a rail operator to know in advance how many sleeping cars have to be available. All considered data are obtained from Serbian Railways. Keywords: artificial neural network, forecast, sleeping cars.
1. Introduction
Rail transport market can be considered through theory and practice. In general, major problem for rail companies all over the world is how to attract more passengers while fulfilling their specific demands, on the one hand, and how to maximize company profit, on the other. Within this problem, there are several sub-problems, the solving of which can affect achieving the objectives of rail operators. One of them is predicting the number of sleeping and couchette cars.
Sleeping and couchette cars are intended to accommodate passengers using various types of berths, primarily overnight and on long-distance trains. The first such a car was configured on American railways in 1880. One of the types is equipped with standard seats that can be transformed into a sleeping area, and is known as a European couchette car. Luxury types provide separate private rooms that passengers can share or
book them just for themselves to keep the maximum of privacy.
Predicting the number of tickets sold for couchette and sleeping cars is a very important problem for rail operators. With correct assessment, it is possible to reduce expenses incurred either by unused capacities, or when passengers are rejected because all capacities are sold out. Predicting the number of sleeping and couchette cars required can be done by using Artificial Neural Network, and real, accurate historical data. The inputs to the system consist of train route, month, type of sleeping car, number of berths (supply), average number of daily departures, ticket price and GDP, while the output of the neural network is the number of sold tickets (demand).
biological neural networks. Artificial Neural Networks are able to learn from experience, to make generalizations and to detect key characteristics of input data which may often contain even irrelevant information.
The principal objective of this study is to explore the possibility of developing a Decision Support System to help rail experts to better predict the number of sleeping cars required, i.e. the number of sold tickets (demand), thus directly influencing company revenues for providing this type of service.
This paper is organized as follows. Section two presents brief literature overview. Section three provides Artificial Neural Network basic concepts while section four contains prediction of the number of sleeping cars using mentioned technique. Results and discussion are given in section five. The last section is devoted to conclusions.
2. Brief Literature Overview
The data in transport sector are mainly modeled by apply ing t wo dif ferent approaches: stat ist ica l met hods or computational intelligence. Statistical approaches include data collection, organization and interpretation of numerical data. Computational Intelligence uses training, adaptation and evolution in order to develop the model. Similarities and differences between these approaches, as well as their application in research in the field of traffic and transport are presented in detail in the paper by Karlaftis and V lahigianni (2011).Neural networks, as modern computational intelligence methods, are often applied in solving traffic problems. This approach allows developing
components. Neural networks are used as (Haykin, 1999): models of biological neural systems, as adaptive signal processors in real time, or as a method for data analysis, which is actually the most common case in the field of transport. The advantages of neural networks are numerous: the ability to manage a large number of multivariate data, flexible modeling, the ability of training and generalization, and of course the ability to predict.
In railway sector, neural networks have been applied in various issues, such as: prediction of passenger traffic demands (Zheng and Wang, 2011; Tsai et al., 2009; Zhuoa et al., 2007), scenario management (Wu et al., 2010), railway operations optimization (Martinelli and Teng, 1996; Altınkaya et al., 2014), train re-scheduling (Dundar and Sahin, 2013), evaluation of rail service quality (Sadeghi and Askarinejad, 2012; Yaghini et al., 2013), etc.
3. Artificial Neural Network
The Artificial Neural Network (ANN) is a mathematical model that relies on a simplified brain model. The processing tasks are distributed over numerous neurons (nodes, units or processing elements). Even though individual nodes are capable of simple data processing, the main power of a neural network is the result of connectivity and collective behavior among the nodes (Teodorović and Šelmić, 2012).
output in certain situations. In other words, the neural network is continually trained during the training phase by adjusting the weights. The main goal is to identify the relationships between the input and output data. ANN consists of three types of nodes: input, output and hidden. Input nodes receive input signals from sources outside the network. Input and output signals of hidden nodes existing in the network are not “visible” from the outside. Output nodes transmit signals outside the network. Each node sends signals of different strength to
its associated neighbor (the nodes to which it is connected).
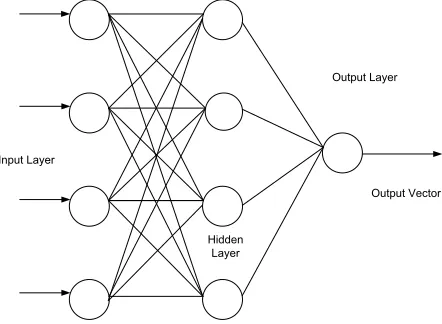
According to basic principles each node is associated with a function f which performs mapping of input to output signal. This function is often a threshold that must be reached so that output signal could be transmitted to the neighbors. The structure of ANN consists of number of nodes and their connections. ANN is fully defined when its structure, activation function and way of training are determined (Fig. 1).
Input Layer
Output Vector Output Layer
Hidden Layer
Fig. 1.
Artificial Neural Network
ANNs are able to modify their behavior depending on various conditions of the environment. This characteristic greatly influenced its wide application in different areas.
Artificial networks are trained by providing a set of input values (usually with a set of output values) in order to adjust the weight of system. When presented with a
4. Predicting the Number of Sleeping
Cars Using Artificial Neural Networks
Artificial neural networks are commonly used for the following four types of problems:
• Classification • Prediction • Recognition • Optimization
The problem analyzed in this paper is classified as a prediction problem. While doing a forecast, ANN will predict future values of the outputs for a range of inputs. The accuracy of estimate output data depends on many factors, but the most
important are the number and relevance of the input data.
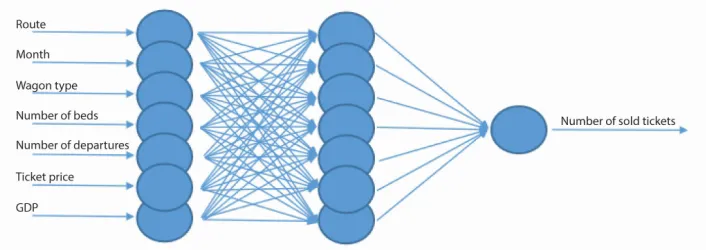
In this paper, the inputs to the system consist of train route, month, type of sleeping car, number of berths, number of departures, ticket price and GDP. The output of the neural network is the number of tickets sold (demand) for sleeping cars.
For the purposes of prediction here we used the two-layer neural network. The input and hidden layers are fully connected. The network is trained in order to estimate the number of tickets sold for sleeping cars. The input layer has 7 nodes, and output has only one node. The proposed neural network is given in Fig. 2.
Fig. 2.
ANN for Estimating the Number of Tickets Sold
5. Results and Discussion
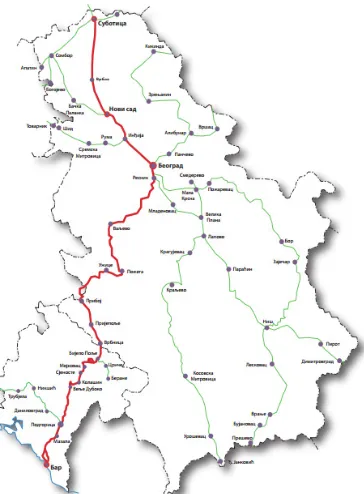
Three rail directions of the Serbian railway network are examined: Subotica-Bar, Novi Sad-Bar and Beograd-Bar (Fig. 3). Data have been obtained for the period from 2009 to
2013, including four months: June, July, August and September.
Fig. 3.
Rail Connections under Examination
Out of the total of 105 data sets, the proposed neural network is trained with 80 data sets, and is afterwards tested with the remaining 25 data sets. All used data are obtained from the PE Serbian Railways.
For the neural network, three types of patterns have been taken into consideration. The first data set represents the data which are used for the neural network training, and the network is consequently adapted in accordance with the mistakes made in this iteration. The second one is used for
validation. These data are used to generalize the network, and to end training process at the moment when the neural network stops making further improvements. Finally, the third one is used for testing. This data set does not influence the training process, and by extension, it represents an independent measure of the neural network’s performance during and after the training. In our code, in Matlab, this pattern makes 24% of all data.
Table 1
Training Set Data
No. of inputs Direction Month Type of car No. of beds No. of departures Ticket price GDP Sold tickets
1. Bg-Bar June WL 5.712 4 10.100 42,9 3.151
2. Bg-Bar June Ac 1.988 4 8.200 42,9 864
3. Bg-Bar June Bc 2.456 4 5.600 42,9 1.085
. . .
. . .
. . .
104. NS-Bar Sept. WL 1.664 1 12.800 47,1 1.076
105. NS-Bar Sept. Bc 1.836 1 7.270 47,1 849
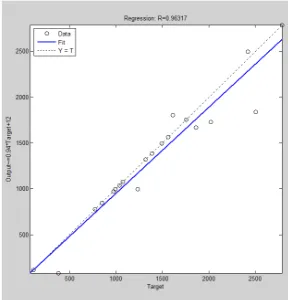
Fig. 4.
The Matching of the Output Data to the Target Results (Relation between the Output Data and the Target Results)
During the training phase, the artificial neural network has predicted the number of sold tickets, which reflects the reality in 98% of cases. When the test data were processed, an accurate prediction of the number of tickets sold was 96% in all cases.
The regression in the case of test data is shown in Fig. 4, where the x-axis shows the target values (the number of tickets sold in the past), while the y-axis shows the output values (the number of tickets obtained by means of neural network’s prediction).
6. Conclusion
The model for assessing the number of sleeping cars in a train, i.e. demand prediction for this kind of service, has been developed in this paper. The artificial neural
into account. In order to train and test the neural network, real data are collected for certain four months over the past five years.
The neural network represented in this paper should be suitable support tool for rail managers who have to make decisions. By the demand assessment, based on the data that were collected from the past, is it possible to manage the supply, optimize resources, in particular - the number of sleeping cars, as well as the costs of the company.
Acknowledgements
This work was supported by the Ministry of Education, Science and Technological Development of the Republic of Serbia through the projects TR36002 and TR36022 for the period 2011-2014.
References
Altınkaya, H.; Orak, I.M.; Esen, I. 2014. Artificial neural network application for modeling the rail rolling process,
Expert Systems with Applications. DOI: http://dx.doi.
org/10.1016/j.eswa.2014.06.014, 41(16): 7135-7146.
Dundar, S.; Sahin, I. 2013. Train re-scheduling with genetic algorithms and artificial neural networks for single-track railways, Transportation Research Part C: Emerging Technologies. DOI: http://dx.doi.org/10.1016/j. trc.2012.11.001, 27: 1-15.
Haykin, S. 1999. NN: A Comprehensive Foundation. Macmillan, NY.
Karlaftis, M.G.; Vlahogianni, E.I. 2011. Statistical methods versus neural networks in transportation research: Differences, similarities and some insights,
Transportation Research Part C: Emerging Technologies.
DOI: http://dx.doi.org/10.1016/j.trc.2010.10.004, 19(3): 387-399.
Martinelli, D.R.; Teng, H. 1996. Optimization of railway operations using neural networks, Transportation Research Part C: Emerging Technologies. DOI: http://dx.doi. org/10.1016/0968-090X(95)00019-F, 4(1): 33-49.
Sadeghi, J.; Askarinejad, H. 2012. Application of neural networks in evaluation of railway track quality condition, Journal of Mechanical Science and Technology. DOI: http:// dx.doi.org/10.1007/s12206-011-1016-5, 26(1): 113-122.
Teodorović, D.; Šelmić, M. 2012. Computational
intelligence in transport. The Faculty of Transport and
Traffic Engineering, Belgrade, Serbia.
Tsai, T-H.; Lee, Ch-K.; Wei, Ch-H. 2009. Neural network based temporal feature models for short-term railway passenger demand forecasting, Expert Systems
with Applicationn. DOI: http://dx.doi.org/10.1016/j.
eswa.2008.02.071, 36(2): 3728-3736.
Wu, D.; Zhu, G.; Ai, B. 2010. Application of artificial neural networks for path loss prediction in railway environments. In Proceedings of the5th International ICST Conference - Communications and Networking in China
(CHINACOM), 1-5.
Yaghini, M.; Khoshraftar, M.M.; Seyedabadi, M. 2013. Railway passenger train delay prediction via neural network model, Journal of Advanced Transportation. DOI: http://dx.doi.org/10.1002/atr.193, 47(3): 355-368.
Zheng, D.; Wang, Y. 2011. Application of an artificial neural network on railway passenger flow prediction. In Proceedings of the International Conference on Electronic and Mechanical Engineering and Information Technology
(EMEIT), 149-152.
Zhuo, W.; Li-Min, J.; Yong, Q.; Yan-hui, W. 2007. Railway Passenger Traffic Volume Prediction Based nn Neural Network, Applied Artificial Intelligence:
An International Journal. DOI: htt p://d x .doi.