18 2015, XVIII, 3 DOI: 10.15240/tul/001/2015-3-002
Introduction
A key long term consequence of the Great Recession of 2007–2009 was a rapid surge in public debt, especially in developed market economies. The OECD debt to GDP ratio stood at 79.9 per cent in 2008, and was expected to stabilize at 111.1 per cent in 2014. The Euro area (15) ratio was 78.0 per cent in 2008, and is expected to stabilize at 107.7 per cent in 2014 [10]. The important question is whether this debt is sustainable, and if not what is to be done about it? The public debt to GDP ratio in OECD countries had roughly doubled between 1980 and the eve of the Great Recession. So the recent increase has pushed to the fore an issue whose importance had been growing for decades. To assess sustainability requires, amongst other information, plausible forecasts of the debt to GDP and the primary balance to GDP ratios. This paper uses a non-parametric iterative approach to estimate these ratios for the Czech Republic and Slovakia up to 2022. The estimates are then used to assess whether these countries` public debts are sustainable. The paper extends the current forecasting methodology for analysing sustainability, and hence provides an improved and more relevant analysis for policy makers to act on.
In this paper we undertake a debt sustainability analysis of the Czech Republic and Slovakia. We model the paths of the public debt to GDP ratio and the primary balance to GDP ratio up until 2022, under three different projections. The first, baseline projection, forecasts their indebtedness assuming that there will be no adjustments either to the public debt to GDP ratio or to the primary balance to GDP ratio. This projection uses the offi cial forecasts of the relevant Czech and Slovak authorities, and assumes that they are realized. The second projection estimates how much consolidation the Czech Republic and Slovakia
would have to undertake if they aimed to keep their public debt to GDP ratios at current levels. The third projection estimates the consolidation required to re-attain the levels of public indebtedness seen on the eve of the crisis in Europe, at the end of 2008.
Each of our three projections is calculated for fi ve different scenarios. These comprise a status quo scenario and two different variants for both GDP growth and the consolidation effort. Thus this paper is a contribution to the empirical exploration of public debt sustainability. We employ a non-parametric methodology based on the work of Becker et al. [1]. This allowed them to calculate the required degree of consolidation to maintain the debt to GDP ratio at its current level. We extend their methodology to incorporate iterative solution techniques [4]. These iterative numerical methods allow the estimation of a targeted level of the public debt to GDP ratio, and the required path of the primary balance to GDP ratio, taking account of such variables as nominal interest rates, public debt yields to maturity, the infl ation rate and the average maturity of debt. The paper`s novelty lies in its development of an extension to a recognized methodology, and its application to forecasting the time path of debt for the Czech Republic and Slovakia. This allows a more realistic assessment of their public debts` sustainability.
We should state at the outset that in this paper we do not explicitly model the structure of public debt. Thus the distribution of short, medium and long term fi nancial instruments is only refl ected by using the average yield to maturity of the fi nancial instruments. Debt is undifferentiated by holder (resident or non-resident), by currency denomination (domestic or foreign), or by other characteristics, for example whether its interest rate is fl oating or fi xed. Such characteristics will however
A DEBT SUSTAINABILITY ANALYSIS
OF THE CZECH REPUBLIC AND THE
SLOVAK REPUBLIC: A NON PARAMETRIC
APPROACH
Vlastimil Farkašovský, Colin William Lawson, Emília Zimková
EM_3_2015.indd 18
19 3, XVIII, 2015
influence governments` access to capital markets. While the omission of these factors limits the scope of the analysis, our more limited model offers the best practical approach to the measurement of debt sustainability [15].
Our paper is structured as follows. Part one provides a brief literature overview and part two describes the data and methodology. Part three reports estimates of the debt dynamics implied by our three scenarios, from 2014 to 2022 and part four contains our conclusions.
1. Literature Overview
Historically the main drivers of public debt have been fi nancing war and smoothing consumption across business cycles. But on the demand side governments can increase borrowing for a wide variety of reasons, including their impatience to spend slow to arrive tax revenues. On the supply side since the early eighties increasing globalization and liberalization of fi nancial markets has made it easier to acquire public debt. And as Reinhart and Rogoff [13] show, banking crises often prefigure and cause sovereign debt crises. So the recent rapid rise in public debt has complex supply, demand, and regulatory failure antecedents.
The consequences of the growth in public debt are widespread and disputed. For example, in a politically infl uential paper Reinhart and Rogoff [12] argued that when debt exceeds 90 per cent of GDP it has a major dampening effect on growth. But a more reliable econometric analysis by Herndon et al. [5] has signifi cantly weakened the earlier result. For Visegrad countries Uradnicek and Zimkova [16] using panel regression techniques have identifi ed a threshold point at a debt to GDP ratio of 55%, above which further debt has no identifi able positive growth impact. By 2013 all the Visegrad states were above this threshold [9].
Apart from its possible effects on growth the more immediate risk facing governments whose debt to GDP ratio is both high and rapidly growing is that the market will judge the ratio unsustainable and this will precipitate a default. Such risks have generated a signifi cant literature on assessing sustainability. Much of this literature has focused on the relationship between fi scal policy and debt trajectories, and in particular on the time path of primary balances, for the dynamic stability of debt requires its current value to equal the discounted present value of expected future surpluses, net of interest payments.
In the European Union much of the practical policy orientated motivation behind exploring public debt sustainability comes from concerns about the Euro zone`s stability, and originates from the 1992 Maastricht treaty. The 1997 Stability and Growth pact of the European Monetary Union, reformed in 2005 and 2011, was intended to address those concerns.
In recent years the more technical academic literature has also developed in a policy oriented direction as researchers have tackled the sustainability issue in a way that explicitly recognizes the behavioral and political economy limits to the maximum tax take, and to the minimum level of government consumption, see e.g. Hindls and Hronová [6], Orviska and Hudson [11]. The way of accounting is taken into consideration too [14]. In developing tests of sustainability the search is for a fi scal equivalent to the Taylor rule for monetary policy: in other words a rule that would describe responsible fi scal policy. Daniel and Shiamptaris [2] argue that this requires the primary surplus to respond rather strongly to debt levels, and for it to be cointegrated with output and debt. Their empirical analysis of eleven of the older EU-15 members, now Eurozone members, shows that from 1970 to 2011 they satisfi ed such “responsibility” criteria. The recent fi nancial crises in several of these countries are thus not the result of past explosive debt acquisition, but have been caused by large adverse unanticipated fi scal shocks, or by politicians` promises for unfunded future expenditures that violated responsibility criteria and so precipitated insolvency.
2. Data and Methodology
The data set used for the Czech Republic and Slovakia covered the period 2002 to 2013, and contained the series listed in table 1.
The data sources were Eurostat, the European Central Bank, the OECD, the Czech National Bank, the National Bank of Slovakia, the Ministry of Finance of the Czech Republic, and the Ministry of Finance of the Slovak Republic [3], [7], [9].
The model which is going to be used is deterministic. There is a limited amount of time series data and the distribution of the variables does not suggest that it would be appropriate to estimate a stochastic model. The data was used to produce three different projections of the public debt to GDP ratio and the primary
EM_3_2015.indd 19
20 2015, XVIII, 3
balance to GDP ratio up to 2022: these were the baseline projection, the debt stabilizing projection and the debt adjusting projection. The fi rst two projections were generated using Becker et al`s [1] and Yeyati`s methodology [17]. But we use our own method to obtain the debt adjusting projection. This uses numerical methods, and was inspired by the work of Fylstra and Warren [4].
As noted in the introduction, the baseline projection estimates the public indebtedness of the Czech Republic and Slovakia to 2022, if their public-debt-to-GDP and primary-balance-to-GDP ratios remain unchanged. This projection draws on the offi cial forecasts by the relevant Czech and Slovak authorities, including those of growth rates. The second projection estimates how much they would have to consolidate to sustain their current public-debt-to-GDP ratios. Finally the third projection estimates how much they would have to consolidate if they wanted to re-attain their pre-crisis end-2008 public-debt-to-GDP ratios.
In addition, for each of the three above projections for the period 2013–2022, fi ve scenarios are estimated. The fi rst, which we call the status quo scenario, assumes that the offi cial forecasts of the relevant institutions – central banks, ministries of fi nance,
international institutions – are realized. As this status quo scenario assumes governments make no consolidation efforts, the nominal interest rate would likely increase, refl ecting investors` responses to increased risk. In the further scenarios, the offi cial predictions of the nominal interest rate on existing debt published by Eurostat are used as stated in Table 1. We model the nominal interest rate by (1).
(1) In this fi rst scenario, because the authorities are assumed not to consolidate their public
fi nances during the forecast period, the primary balance is unaffected by current public policy, though it may show some small infl uence from previous consolidation. The other variables – interest rates, yield to maturity, and the average maturity of debt are set at their offi cial forecast levels.
The second and third scenarios, which allow for economic growth or decline, are labelled the Growth+ and Growth- scenarios. They incorporate the same assumptions as the baseline scenario, except for the GDP growth rate. From 2015 this is set at its ten- year average, plus or minus twice its standard
Series Notation Unit Source
Gross domestic product GDPt mil. € Eurostat/Slovstat
Public debt dt % of GDP Eurostat
Government primary balance pbt % of GDP European Central Bank
GDP growth rate gt % Eurostat
Nominal interest rate on existing debt it % Eurostat Required rate of return for new debt
and refi nancing, measured by yield to maturity
YTMt % Oesterreichische Nationalbank
Real interest rate rt % Authors´ computing
Infl ation rate t % Eurostat
Average maturity of debt AMt in years National Bank of Slovakia
Dummy variable
k
t {1,7} Authors
Source: authors based on[3], [7], [9].
Tab. 1: Overview of data and sources
EM_3_2015.indd 20
21 3, XVIII, 2015
deviation. Assuming a normal distribution, the two sigma rule marks off a 95% confi dence interval. Such boundaries are commonly used by central banks and ministries of fi nance in exploring the likely range of macroeconomic performance. In this case these scenarios form the upper and lower hypothetical bounds of future Czech and Slovak growth rates. The 2014 growth rate is a linear interpolation, giving a smooth through pass, and also refl ecting central banking forecasting practice.
Similarly the fourth and fi fth scenarios, denoted as Consolidation+ and Consolidation-, use some of the same assumptions as the status quo scenario. But in these scenarios the primary balance after 2015 is assumed to be its ten year average, plus or minus twice its standard deviation.
In addition, for the Growth- and Consolidation- scenarios, the nominal interest rate is assumed to be that used in the status quo scenario, plus its standard deviation. This models the lower credibility of the sovereign borrowers in these less attractive and more risky scenarios.
Equation (2) determines changes in the level of public debt:
(2)
Where public debt dt is given by equation (3) (3) The calculation of the primary balance, when the aim is that public debt should remain at its current level, is given by equation (4).
(4)
The estimation of the primary balance when the aim is to achieve a target level of public debt is performed by an MS Excel add-in for iterative numerical methods. Methodological details are available in Fylstra and Warren [4], and we can provide further details upon request.
3. Empirical Results
and Discussion
Here we report and discuss in some detail the empirical results for the Czech Republic. Then the Czech and Slovak results are summarized in table 2.
The fi rst, baseline projection, estimates Czech indebtedness up to 2022, assuming
there were to be no changes to either the public debt to GDP or to the primary balance to GDP (consolidation) ratios. Figure 1 shows the Czech Republic`s offi cial forecast of its public debt to GDP ratio. The status quo scenario, which assumes that the offi cial forecasts estimates of the key variables are realized, predicts that by 2022 the Czech public debt to GDP ratio will reach 48.8 per cent. For most European countries this would be an enviable outcome. For the Growth+ scenario, which assumes the growth rate will be two standard deviations above the ten year average the predicted 2022 public debt to GDP ratio is only 29.2 per cent. For the Consolidation+, which assumes the primary balance improves by two standard deviations above its ten year average, the predicted 2022 public debt to GDP ratio is as low as 26.7 per cent. Thus the Czech Republic has a good chance of achieving its 2008 pre-crisis level of indebtedness of 28.7 per cent in either the Growth+ or the Consolidation+ scenarios.
For the Growth- scenario, which assumes the GDP growth rate will deteriorate by 2 standard deviations from its 2002–13 average, the 2022 public debt to GDP ratio is predicted to reach 83.5 per cent. Finally in the Consolidation- scenario, which assumes a primary balance deterioration of two standard deviations from its 2002–13 average, the 2022 public debt to GDP ratio is predicted to be as high as 81.7 per cent. For the fi rst projection we also assume that the primary balance to GDP ratio – the consolidation effort – is unchanged during the forecast period. This is shown in fi gure 2. In the Growth+ scenario the denominator of the primary balance would increase, so therefore the primary balance can deteriorate to –5.8 per cent. But in the Growth- scenario the primary balance would have to improve to 1.4 per cent of GDP to maintain an unchanged consolidation effort.
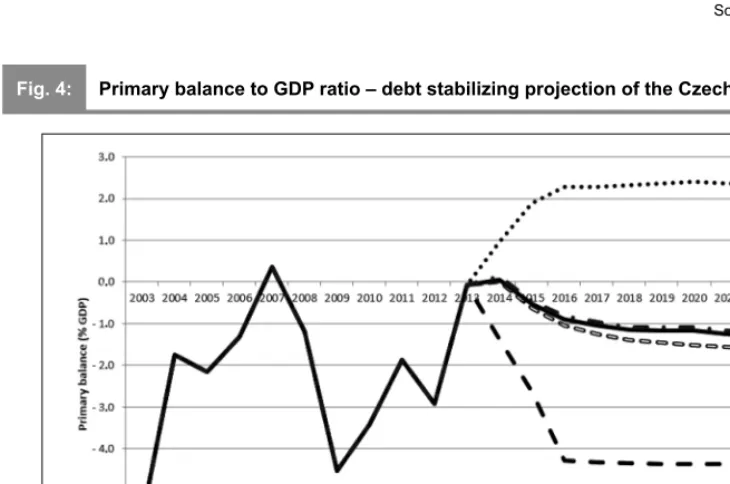
Figure 3 shows the public debt to GDP ratio for the Czech Republic`s debt stabilizing projection. This projection assumes that after rising rapidly during the Great Recession, debt to GDP remains at its 2013 level of 46.0 per cent, for all fi ve scenarios. But to maintain this level the primary balance has to vary, and this variation, for different scenarios, is shown in
fi gure 4 and table 1. In the Status Quo and Growth- scenarios the primary balance ratio needs to improve by almost one per cent,
EM_3_2015.indd 21
22 2015, XVIII, 3
Fig. 1: Public debt to GDP ratio – baseline projection of the Czech Republic
Source: authors
Fig. 2: Primary balance to GDP ratio – baseline projection for the Czech Republic
Source: authors
EM_3_2015.indd 22
23 3, XVIII, 2015
Fig. 3: Public debt to GDP ratio – debt stabilizing projection of the Czech Republic
Source: authors
Fig. 4: Primary balance to GDP ratio – debt stabilizing projection of the Czech Republic
Source: authors
EM_3_2015.indd 23
24 2015, XVIII, 3
in comparison to the same scenarios for the baseline projection.
The primary balance to GDP ratio is strongly infl uenced by economic growth. For the Growth+ scenario the primary-balance-to-GDP ratio can fall to -4.4 per cent, while still maintaining the debt to GDP ratio at 46.0 per cent. But for the Growth- scenario the primary balance must register a surplus of 2.4 per cent of GDP to maintain the same debt ratio.
Figure 5 and table 1 show the public debt to GDP ratios for the Czech Republic`s debt adjusting projection. The target was the pre-crisis 2008 ratio of public debt to GDP, of 28.7 per cent. Achieving this ambitious target required a primary surplus in four out of the fi ve scenarios, which are shown in fi gure 6. The Status Quo scenario requires a surplus of 1.3 per cent, while the damaging Growth- scenario would require one of 4.0 per cent of GDP. Only the Growth+ scenario would allow the relatively comfortable constraint of a 1.3 per cent primary defi cit.
Table 2 draws together the two countries` results for all three projections and fi ve scenarios. In the fairly recent past both
countries recorded rather modest public debt to GDP ratios, compared to the majority of developed European Union members. On the eve of their 2004 European Union accession the public debt to GDP ratio in the Czech Republic was only 28.6 per cent, while Slovakia’s was 42.4 per cent. In the following years Slovakia used its signifi cant privatization receipts to drastically reduce its public debt, which by 2008 stood at only 27.9 per cent of GDP, lower even than the Czech Republic’s. However the Great Recession caused a relatively stronger deterioration in Slovakia’s public fi nances, and by the end of 2013 its indebtedness had soared to 58.1 per cent, while the Czech Republic’s was still under 50 per cent. But clearly both countries face the same challenge to consolidate more sharply or to grow much more rapidly than they have done recently, if they are to re-attain their pre-crisis levels of indebtedness.
Conclusions
The main aim of this paper has been to show that developing an existing method of assessing debt sustainability [1] by introducing iterative numerical solution methods can
Fig. 5: Public debt to GDP ratio – debt adjusting projection of the Czech Republic
Source: authors
EM_3_2015.indd 24
25 3, XVIII, 2015
Fig. 6: Primary balance to GDP ratio – debt adjusting projection of the Czech Republic
Source: authors
Czech Republic Slovak Republic
2003 2008 2013 2018 2022 2003 2008 2013 2018 2022
Public debt to GDP ratio – baseline projection
Status quo 28.6 28.7 46.0 48.7 48.8 42.4 27.9 55.4 56.8 58.1
Growth + 28.6 28.7 46.0 36.7 29.2 42.4 27.9 55.4 40.8 30.0
Growth – 28.6 28.7 46.0 63.7 83.5 42.4 27.9 55.4 76.6 100.9
Consolidation + 28.6 28.7 46.0 36.6 26.7 42.4 27.9 55.4 40.4 26.6
Consolidation – 28.6 28.7 46.0 65.5 81.7 42.4 27.9 55.4 78.5 101.3
Primary balance to GDP ratio – baseline projection
Status quo –5.6 –1.2 –0.1 –1.3 –1.3 –0.3 –0.8 –0.8 –1.3 –1.3
Growth + –5.6 –1.2 –0.1 –5.8 –5.8 –0.3 –0.8 –0.8 –6.9 –6.9
Growth – –5.6 –1.2 –0.1 1.4 1.4 –0.3 –0.8 –0.8 2.5 2.5
Consolidation + –5.6 –1.2 –0.1 –1.3 –1.3 –0.3 –0.8 –0.8 –1.3 –1.3
Consolidation – –5.6 –1.2 –0.1 –1.3 –1.3 –0.3 –0.8 –0.8 –1.3 –1.3 Tab. 2: Results of baseline, debt stabilizing and debt adjusting projections for the Czech and the Slovak Republics – Part 1
EM_3_2015.indd 25
26 2015, XVIII, 3
Czech Republic Slovak Republic
2003 2008 2013 2018 2022 2003 2008 2013 2018 2022
Public debt to GDP ratio – debt stabilizing projection
Status quo 28.6 28.7 46.0 46.0 46.0 42.4 27.9 55.4 55.4 55.4
Growth + 28.6 28.7 46.0 46.0 46.0 42.4 27.9 55.4 55.4 55.4
Growth – 28.6 28.7 46.0 46.0 46.0 42.4 27.9 55.4 55.4 55.4
Consolidation + 28.6 28.7 46.0 46.0 46.0 42.4 27.9 55.4 55.4 55.4
Consolidation – 28.6 28.7 46.0 46.0 46.0 42.4 27.9 55.4 55.4 55.4
Primary balance to GDP ratio – debt stabilizing projection
Status quo –5.6 –1.2 –0.1 –0.3 –0.5 –0.3 –0.8 –0.8 –1.2 –0.9
Growth + –5.6 –1.2 –0.1 –4.3 –4.4 –0.3 –0.8 –0.8 –6.1 –6.1
Growth – –5.6 –1.2 –0.1 2.3 2.4 –0.3 –0.8 –0.8 3.0 3.1
Consolidation + –5.6 –1.2 –0.1 –1.4 –1.6 –0.3 –0.8 –0.8 –1.6 –1.5
Consolidation – –5.6 –1.2 –0.1 –1.1 –1.2 –0.3 –0.8 –0.8 –1.0 –0.7
Public debt to GDP ratio – debt adjusting projection
Status quo 28.6 28.7 46.0 37.3 28.7 42.4 27.9 55.4 41.4 27.9
Growth + 28.6 28.7 46.0 36.1 28.7 42.4 27.9 55.4 40.3 27.9
Growth – 28.6 28.7 46.0 37.7 28.7 42.4 27.9 55.4 39.1 27.9
Consolidation + 28.6 28.7 46.0 37.5 28.7 42.4 27.9 55.4 42.4 27.9
Consolidation – 28.6 28.7 46.0 37.4 28.7 42.4 27.9 55.4 40.5 27.9
Primary balance to GDP ratio – debt adjusting projection
Status quo –5.6 –1.2 –0.1 1.3 1.3 –0.3 –0.8 –0.8 2.5 2.5
Growth + –5.6 –1.2 –0.1 –1.3 –1.3 –0.3 –0.8 –0.8 –1.0 –1.0
Growth – –5.6 –1.2 –0.1 4.0 4.0 –0.3 –0.8 –0.8 5.7 5.7
Consolidation + –5.6 –1.2 –0.1 1.1 1.1 –0.3 –0.8 –0.8 2.2 2.2
Consolidation – –5.6 –1.2 –0.1 1.3 1.3 –0.3 –0.8 –0.8 2.7 2.7
Source: authors
Tab. 2: Results of baseline, debt stabilizing and debt adjusting projections for the Czech and the Slovak Republics – Part 2
EM_3_2015.indd 26
27 3, XVIII, 2015
produce a richer analysis of sovereign debt sustainability, that can better warn policymakers of approaching crises, and provide them with a wider range of insights into the consequences of their choices.
We have argued that sovereign debt sustainability issues have had a higher profi le in recent years because of the ubiquity of higher levels of public debt, especially in developed economies over recent decades, the creation of the Euro zone, and the consequences of the recent Great Recession. With many developed economy public debt levels now at or near what until relatively recently would have been viewed as crisis levels, the saliency of this issue is likely to continue for the forseeable future. When it comes, insolvency can come almost instantaneously, as markets can close to borrowers in hours. And as we have seen a history of previously responsible public borrowing is no guarantee that the market will continue to judge a country solvent.
A cautionary example is the paper`s analysis of Czech debt sustainability up to 2022. In the baseline projection, with the Growth- and Consolidation- scenarios, the debt to GDP ratio increases rapidly over less than a decade, turning a comfortable ratio, at least by international standards, into a a rather worrying one of over 80 per cent. One implication is that adverse movements in the debt ratio may need rapid policy responses, and certainly need frequent analysis. Further implications from the same projection, but from the Growth+ and Consolidation+ scenarios, is the importance of growth and of fi scal discipline, because of the speed at which signifi cant improvements in them can shrink the debt ratio.
The paper shows that the proposed methodology provides a practical and informative way of assessing debt sustainability, and can also provide policymakers and analysts with practical examples of the key changes needed to achieve a range of targets, for example debt ratios of varying size. It can also help with the choice between policies, because it produces information on the trade offs between targets.
An obvious extension to the methodology would be to undertake a more disaggregated modelling of the term structure of public debt, its pattern of ownership between residents and non-residents, and whether its interest rates are fi xed or fl oating. All these factors infl uence
the riskiness and hence sustainability of a given public debt burden.
The paper was prepared as a partial fulfi lment of the Operational Program Education project ITMS 26110230082 Mobility – Support of Science, Research and Education at Matej Bel University in Banská Bystrica (Mobility – podpora vedy, výskumu a vzdelávania na UMB) co-fi nanced by the European Social Fund within the bounds of fi nancial subsidy contract No. 018/2012/1.2/OPV.
References
[1] BECKER, S., DEUBER, G., STANKIEWICZ, S. Public debt in 2020. Deutsche Bank Research. 2010. pp. 1-24. ISSN 1612-314X. [2] DANIEL, B.C., SHIAMPTARIS, C. Pushing the limit? Fiscal policy in the European Monetary Union. Journal of Economic Dynamics and Control. 2013, Vol. 37, Iss. 11, pp. 2307-2321. ISSN 0165-1889.
[3] European economic forecast. Winter
[online]. Directorate General for Economic and Financial Affairs of the European Commission, c2013 [cit. 2014-06-10]. 155 p. (PDF). Available from: http://ec.europa.eu/economy_fi nance/ publications/european_economy/2013/pdf/ ee2_en.pdf. DOI: 10.2765/3931.
[4] FYLSTRA, D., WARREN, A. Design and use of the Microsoft Excel Solver. Interfaces. 1998, Vol. 28, No. 5, pp. 29-55. ISSN 0092-2102. [5] HERNDON, T., ASH, M., POLIN, R. Does high public debt consistently stifl e economic growth? A critique of Reinhart and Rogoff.
Cambridge Journal of Economics. 2014, Vol. 38, Iss. 2, pp. 257-279.ISSN 1464-3545. [6] HINDLS, R., HRONOVA, S. Refl ection of Economic Development of Selected Countries in the Structure of Final Consumption Expenditure. Politická ekonomie. 2012, Vol. 60, Iss. 4, pp. 425-441. ISSN 0032-3233.
[7] Macroeconomic forecast – October [online]. Prague: Ministry of Finance of Czech Republic, c2013 [cit. 2014-06-11]. 68 p. (PDF). Available from: http://www.mfcr.cz/assets/en/media/ Macroeconomic-Forecast-October-2013.pdf. ISSN 1804-7971.
[8] MELECKÝ, A., GUBANIOVÁ, M. Fiskální pravidla v zemích Visegrádské čtyřky. Ekonomický
časopis/Journal of Economics. 2013, Vol. 61, No. 5, pp. 437-452. ISSN 0013-3035.
[9] OECD Economic outlook – Czech Republic
[online]. OECD Publishing, c2012 [cit.
2014-EM_3_2015.indd 27
28 2015, XVIII, 3
06-08]. Available from: http://www.oecd.org/ eco/outlook/czech-republic-economic-forecast-summary.htm.
[10] OECD. Economic outlook No 95. OECD Economic Outlook: Statistics and Projections
database [online]. OECD, c2014 [vid. 2014-08-26]. Available from: http://www.oecd-ilibrary. org/economics/data/oecd-economic-outlook- statistics-and-projections/oecd-economic-outlook-no-95_data-00688-en. DOI: 10.1787/ data-00688-en.
[11] ORVISKA, M., HUDSON, J. Tax evasion, civic duty and the law abiding citizen. European Journal of political Economy. 2003, Vol. 19, Iss. 1, pp. 83-102. ISSN 0176-2680.
[12] REINHART, C., ROGOFF, K.S. Growth in a time of debt. American Economic Review.
2010, Vol. 100, Iss. 2, pp. 466-472. ISSN 0002-8282. DOI: 10.1257/aer.100.2.573.
[13] REINHART, C., ROGOFF, K.S. From fi scal crisis to debt crisis. American Economic Review.
2011, Vol. 101, Iss. 5, pp. 1676-1706. ISSN 0002-8282. DOI: 10.1257/aer.101.5.1676. [14] SIXTA, J., FISCHER, J. Accrual taxes, capital formation and consumption in government sector. Politická ekonomie. 2010, Vol. 58, Iss. 6, pp. 798-804. ISSN 0032-3233. [15] STURZENEGGER, F. Toolkit for the analysis of debt problems. Buenos Aires: Universidad Torcuato Di Tella, 2002 [cit. 2014-06-10]. Available from: http://www.utdt.
edu/departamentos/empresarial/cif/pdfs-wp/ wpcif-122002.pdf.
[16] URADNICEK, V., ZIMKOVA, E. Debt and growth in the Visegrad countries; threshold analysis. Acta Aerarii Publici. 2014, Vol. 11, Special issue, pp. 120-125. ISSN 1336-8818. [17] YEYATI, E.L. Optimal Debt? On the insurance value of international debt fl ows to developing countries. Open Economies Review. 2006, Vol. 20, Iss. 4, pp. 489-507. ISSN 1573-708X. DOI: 10.1007/s11079-008-9086-4.
Ing. Vlastimil Farkašovský Matej Bel University Faculty of Economics Department of Finance and Accounting vlastimil.farkasovsky@umb.sk
dr. Colin William Lawson Matej Bel University Faculty of Economics Department of Finance and Accounting University of Bath, UK Department of Economics hsscwl @bath.ac.uk
doc. Ing. Emília Zimková, PhD. Matej Bel University Faculty of Economics Department of Finance and Accounting emilia.zimkova@umb.sk
EM_3_2015.indd 28
29 3, XVIII, 2015
Abstract
A DEBT SUSTAINABILITY ANALYSIS OF THE CZECH REPUBLIC
AND THE SLOVAK REPUBLIC: A NON PARAMETRIC APPROACH
Vlastimil Farkašovský, Colin William Lawson, Emília Zimková
Surging public debt since the Great Recession has focused increasing attention on the issue of debt sustainability. This paper provides debt sustainability analyses for the Czech Republic and Slovakia by estimating their public debt to GDP, and primary balance to GDP ratios up until 2022 under three different projections. The fi rst, labelled the baseline projection, predicts their debt ratios to 2022, if neither their public debt to GDP ratios nor their primary balance to GDP ratios change. This projection uses the offi cial forecasts of the key variables. The second projection answers the question of how much the two counties have to consolidate, measured by their primary balance to GDP ratios, if they want to hold their public debt to GDP ratios at their current levels. The third projection answers the question of how much the countries have to consolidate if they aim to re-attain their December 2008 pre-crisis public debt to GDP ratios. All three projections are made for the same fi ve scenarios, which cover a status quo case, where offi cial forecasts are realized, and both optimistic and pessimistic scenarios for growth and consolidation outcomes. The paper`s novelty lies in its development of an existing non-parametric methodology to encompass iterative numerical solution methods to assess public debt sustainability. This allows a richer set of results to be obtained, for example estimates for the required level of the public debt to GDP ratio, and the primary balance to GDP ratio, taking account of variables such as nominal interest rates, yields to maturity on public debt, infl ation rates and average maturities of debt.
Key Words: Public debt sustainability, primary balance to GDP ratio, public debt to GDP ratio, gross public debt stock.
JEL Classifi cation: H12, H63, H68.
DOI: 10.15240/tul/001/2015-3-002
EM_3_2015.indd 29