DOI: 10.30954/0424-2513.3.2018.17
©2018 New Delhi Publishers. All rights reserved
Use of Electronic Payment Instruments and Effect on Cash
Management: A Micro Analysis
K.P. Radhika
1*and P. Ambiga Devi
21Department of Humanities, PSG College of Technology, Coimbatore, Tamil Nadu, India
2Avinashiligam Institute for Home Science and Higher Education for Women University, Coimbatore, Tamil Nadu, India
*Corresponding author: [email protected]
ABSTRACT
The emergence of innovative electronic payment modes in the financial sector has changed the payment dynamics of transactions across countries. The two important modes of card payments offered by the commercial banks are the debit and credit cards in India. This study is an attempt to examine at the micro level the Baumol Tobin model of demand for money in light of the adoption of electronic payment instruments via debit and credit cards among the select households of Coimbatore City for 2017. The estimated results revealed that from across the range of transactions, more than 50 per cent of the respondents chose the mode of cash payment for values lesser than ` 10,000. This indicated that cash was preferred more in the case of low-value transactions. Garrett’s Ranking technique was used to find the impact of usage of debit and credit cards on the financial parameters of the respondents. The results showed that among the respondents usage of debit and credit cards had the highest impact on the “level of indebtedness”, which indicated that the usage of cards for retail purchases substituted cash significantly. JEL: E42 Monetary Systems; Standards; Regimes; Government and the Monetary System; Payment Systems Keywords: Debit cards, credit cards, demand for money, electronic payments, financial innovations, the Indian banking sector
The technological revolution and innovations in the
financial system of India in the last three decades have paved the way for different forms of electronic payment instruments as a substitute for paper
currency. This change has created an impact and
changed the dynamics of the banking sector, the
transaction demand for cash among households and the monetary policy on the higher end. Humphrey
et al. (2003) noted that “if a country moves from a wholly paper-based payment system to close to an “all-electronic system”, it may save 1% or more of its GDP annually once the transaction costs are absorbed”.
Gandhi (2017) in his speech observed, “The Vision-2018 of Payment and Settlement Systems in India reiterates the commitment of the Reserve Bank of India to encourage greater use of electronic payments by all sections of society to achieve a “less-cash” society. The objective is to facilitate the
provision of a payment system for the future that
combines the much-valued attributes of safety,
security and universal reach with technological
solutions which enable faster processing, enhanced convenience, and the extraction and use of valuable information that accompanies payments”.
Electronic Payment Instruments in India
The electronic payment instruments like debit cards, credit cards, NEFT, RTGS, ATMs, the point of sale devices, mobile banking, smart cards, internet banking and WAP banking have opened the channels of financial transactions to the ease of users. These instruments are found to be “welfare enhancing” in the economy owing to their lower cost of capital, reduced financial risks and improved financial intermediation.
The share of electronic payments have made an
constituting 91 per cent in terms of value from 88 per cent in 2009-10 and 48 per cent in terms of volume from 35 per cent in 2009-10 (Payment Systems Vision in India: Vision 2012-15 Report, RBI).
Debit and Credit Cards – the boon of the households
Card payments have formed an integral part of e-payments in India because of the ease of
transactions that it has supported customers from
paying bills to transferring funds and shopping globally. The technological diffusion in the payment
methods has paved the way for increased use
of cards (both debit and credit) by households specifically for retail payments and transactions.
The ease of operations and the lowering of the
transaction costs in this sector have enabled
economic agents to reduce their outstanding
transaction balances as postulated by the Baumol-Tobin model of transaction demand for money (1952).
Das and Singh (2010) reported that the Global Retail Development Index (GRDI Report) showed that during 2009-10, the retail sales transactions in India was ` 90,000 crore through cards (credit and debit) at Point of Sale (POS) accounting for about 5 per cent of retail sales in India. In other words,
card transactions reduced cash transactions in the
retail sector by about 5 per cent leading to ` 140
crore of savings in currency management for the government.
LITERATURE SURVEY
The increased adoption of debit and credit cards in India has led researchers to analyse the effects of the same on different aspects of the monetary and financial arena.
Rupa Jajoo and Vani Laturkar (2011) explained that debit cards are the main component of the
retail payment system and emphasised that card transactions reduced cash transactions in the retail
sector by about 5 per cent and that with the costs for printing banknotes being of the order of ` 2800 crore annually card usage at POS leads to about ` 140 crore of savings in currency management. Agrawal and Jain (2012) studied the various financial innovations in banking in India and highlighted the benefits and challenges of innovative banking trends and practices. The study concluded that in today’s
new business environment, banks and financial institutions are expected to have more creativity and innovation more than ever before. The study
suggested that with the introduction of modern methods of payments that are technologically
sophisticated, institutions should enable inclusive
and low cost solutions.
Nyasha Kaseke (2012) conducted a qualitative survey of consumer use of plastic money, Debit/ ATM cards, Credit cards and VISA/Master cards from 200 respondents during 2011 in Newzealand.
The study found that individual factors such as
education level and gender had a bearing on the use of plastic money and that there were problems encountered by consumers in relation to security, speed and complexity of use.
Gupta and Aggarwal (2014) in their paper “Financial Innovations and Technologies: Indian Economy 2020” discussed the various financial innovations that have transformed the Indian economy. The
study revealed that these developments have had
a significant positive effect on the economy like Venture Capital, microfinance and also various financial technologies like National Electronic Fund Transfer (NEFT), Mobile-Banking. Online share trading, E-banking have played a significant role in changing India.
Studies have explained the significance and impact
of adoption of electronic payment instruments in an
economy by analyzing the determinants, changes in
the monetary mechanism and the structural changes
in the financial arena. Micro-level studies will enhance the analysis to find the factors that promote
the adoption of electronic payment instruments and determine the impact of usage of these instruments among households.
Need for the study
The objective of this paper is to analyse at the
micro level the determinants of usage of payment
instruments and the effect of payment instruments
on elements of cash management among households
of Coimbatore, Tamil Nadu.
The study was carried out with the following objectives:
To describe the socio-economic and banking
To identify the pattern of usage of cards (debit
and credit card) among the respondents.
To analyse the effect of cards (debit and credit card) on elements of cash management among
the respondents.
METHODOLOGY
The present study was conducted in the Coimbatore City Municipal Corporation of Coimbatore District in Tamil Nadu. The high urban population combined with vibrant industry atmosphere gives
rise to increased currency transactions among the households, and hence the present study selected
its respondents from Coimbatore city to estimate the adoption of debit and credit cards and their impact on elements of cash management. A scheduled questionnaire was administered to 400 respondents from the five zones of Coimbatore City Corporation, who were working in private
organisations, professionals, government employees
or businessmen during the study period 2017. The primary data obtained, through the structured questionnaire, were analysed with the help of percentages, tables, charts, Likert’s Scaling and Garrett’s Ranking Technique.
Findings of the Study
(a) Socio-Economic Profile of Respondents:
The study successfully received data regarding
adoption of e-payment instruments from 400 respondents spread in the five zones of Coimbatore City Corporation, with 269 male and 131 female
respectively. The distribution of respondents based on their age is given in table 1.
Table 1: Distribution of respondents based on Age
Sex
Age Male Female Total
20-30 years N 128 62 190
C 47.58 47.33 47.5
31-40 years N 87 36 123
C 32.34 27.48 30.75
41-50 years N 34 20 54
C 12.64 15.27 13.5
51-60 years N 20 13 33
C 7.43 9.92 8.25
Total 269 131 400
Source: Estimates based on primary data survey, 2017; N = number stated and C = percentage to column total.
Majority of men and women were found to be in the age group of 20 – 30 years (47.58 per cent and 47.33 per cent respectively) followed by the age group of 31 – 40 years.
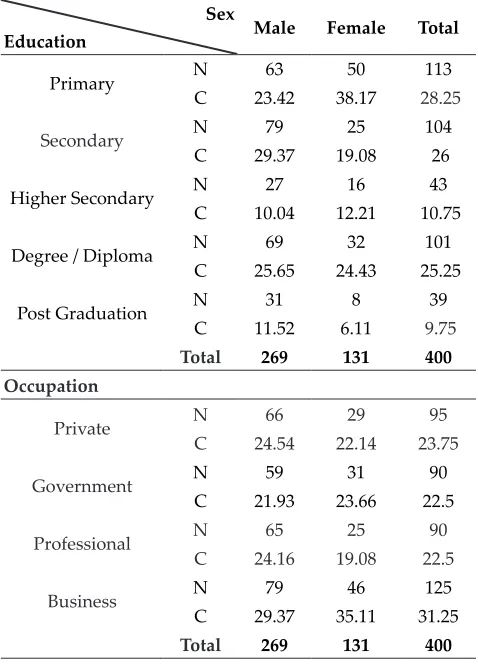
Table 2 gives the distribution of respondents based
on education and occupation, which are considered vital instruments to enhance the use of electronic payments among the respondents.
Table 2: Distribution of respondents based on
education and occupation
Sex
Education Male Female Total
Primary N 63 50 113
C 23.42 38.17 28.25
Secondary N 79 25 104
C 29.37 19.08 26
Higher Secondary N 27 16 43
C 10.04 12.21 10.75
Degree / Diploma N 69 32 101
C 25.65 24.43 25.25
Post Graduation N 31 8 39
C 11.52 6.11 9.75
Total 269 131 400
Occupation
Private N 66 29 95
C 24.54 22.14 23.75
Government N 59 31 90
C 21.93 23.66 22.5
Professional N 65 25 90
C 24.16 19.08 22.5
Business N 79 46 125
C 29.37 35.11 31.25
Total 269 131 400
Source: Estimates based on primary data survey, 2017; N = number stated and C = percentage to column total.
Among the respondents, 25.65 per cent of males and 24.43 per cent of females were degree/diploma
holders highlighting the fact that the level of education was considered a primary criterion for the understanding and adoption of the electronic
the “government employees” with 23.66 per cent. Empirical supports from literature for the above finding are by Stix (2004), Simiyu; et, al (2012) and Yang and Chin (2013).
Table 3 gives the distribution of respondents based on their income levels. David and Abel (2006), Rinaldi (2011) and Fujiki (2014) have concluded
in their studies that income levels, especially the middle-income groups had a positive impact on the higher use of electronic payment instruments
for their daily transactions. In this regard, the study also finds that the respondents were mostly in the
monthly income category of ` 10,000-20,000 per
month.
Table 3: Distribution of the respondents based on
income
Sex
Income (`) Male Female Total
Below 10,000 N 71 37 108
C 26.39 28.24 27
10,000-20,000 N 100 38 138
C 37.17 29.01 34.5
20,000-40,000 N 53 30 83
C 19.70 22.90 20.75
More than 40,000 N 45 26 71
C 16.73 19.85 17.75
Total 269 131 400
Source: Estimates based on primary data survey, 2017; N = number stated and C = percentage to column total.
(b) Banking Profile of the Respondents: Stix (2004), Mishra (2007) and Yang and Ching (2013) have empirically found that there existed a positive association with account ownership in banks by
individuals and the adoption electronic payments
instruments among households. The number of respondents based on the “category of bank” and “type of account” maintained are given in table 4.
Table 4: Respondents based on Category of Bank and Type of Account
Sex
Category of bank Male Female Total
Public N 203 96 299
C 75.46 73.28 74.75
Private N 62 34 96
C 23.05 25.95 24
Foreign N 4 1 5
C 1.49 0.76 1.25
Total 269 131 400
Type of Account
Savings N 228 114 342
C 84.76 87.02 85.5
Current N 41 17 58
C 15.24 12.98 14.5
Total 269 131 400
Source: Estimates based on primary data survey, 2017; N = number stated and C = percentage to column total.
Seventy-five per cent of male respondents and 73
per cent of female respondents had an account in
the public sector banks in the study area, followed by private sector banks with male 23 per cent and female respondents 25 per cent respectively. 84.76 per cent of male and 87.02 per cent of the female
had possessed savings account among the total
respondents of the study, indicating higher number
of savings-account.
Table 5 gives the summary of the respondents based on their possession of debit and credit cards during the study period. Cards formed the base
for electronic transactions among the respondents.
The present study also found that 64.31 per cent of male respondents and 67.18 per cent of female respondents used debit cards. Credit cards were used by 53.53 per cent and 58.78 per cent of male
and female respondents respectively.
Table 5: Respondents based on Usage of Debit and Credit Cards
Sex
Possess Male Female Total
Possess Debit Card
Yes N 173 88 261
C 64.31 67.18 65.25
N 96 43 139
No C 35.69 32.82 34.75
Total 269 131 400
Possess Credit Card
Yes N 144 77 221
C 53.53 58.78 55.25
No N 125 54 179
C 46.47 41.22 44.75
Total 269 131 400
(c) The Pattern of usage of Debit and Credit Cards among Respondents: Boeschoten (1998) explained payment behaviour of households and demonstrated the importance of transaction size
on the adoption of the payment instrument. The current study analysed the choice of payment
instrument among the respondents based on the
volume of the transactions of the respondent.
Table 6 summarises the choice of payment instrument based on the value of the transaction
amount. The study considered a respondent as an
electronic money user if they made payment by
electronic money for at least one of the options. The estimated results reveal that across the ranges of the transaction whose values were lesser than
` 10,000, more than 50 per cent of the respondents used “cash” for payment, indicating preference of “cash” frequently for low-value transactions.
Table 6: Choice of payment instrument based on the value of transactions (in percentages)
Value of
transaction (`) Cash(A) Debit card (B)
Credit card
(C)
NEFT (D)
RTGS
(E) F*
Less than 1000 64.5 22.25 13.25 0 0 35.5
1000 – 5000 76.5 10.5 13 0 0 23.5
5000 – 10000 57.5 17.25 24.5 0.75 0 42.5
10000 – 50000 29 36.5 31.5 3 0 71
50000 – 100000 36.5 21.75 31.75 5 5 63.5 Above 100000 43.5 23.5 25.5 5.25 2.25 56.5 Source: Estimates based on primary data survey, 2017; F* = per cent of instruments other than cash for payment (B+C+D+E).
In the study, it was found that debit cards and
credit cards were preferred mode of payment for transactions in the range of ` 10,000 to ` 50,000
and ` 50,000 to ` 1, 00,000 with 36.5 per cent and 31.75 per cent respectively. The combined adoption
of financial innovations was highest when the transaction values were in the range of ` 10000
to ` 50000 with 71 per cent. The use of electronic money may further reduce the transaction cost by
shortening the transaction time, which is in line
with the Baumol-Tobin model of the transaction
demand for money.
(d) The Frequency of Usage of Debit and Credit Cards among Respondents: The extent of usage of debit and credit cards for various transaction purposes indicates the substitution capacity of these
instruments for cash. In this regard, the frequency of usage of debit cards for purposes of “purchase of goods and services”, “withdrawal of cash”, “deposit of cash”, “travel and tickets” and “memberships and subscriptions” were analysed using the percentage distribution of the respondents and are given in table 7.
Table 7: The Frequency of usage of debit cards (in percentages)
Frequency of
usage
Purchase of goods Withdrawal of
cash
Cash deposit Travel and
tickets
Memberships/ subscriptions
Daily 45.59 6.51 0.77 4.21 0.00 1-2 days 29.12 40.61 15.33 3.45 4.98 2-5 days 16.86 30.65 34.10 28.35 16.48 Once In 15
Days 3.83 13.79 15.71 25.67 18.39 Once In A
Month 3.45 5.36 16.09 31.80 34.48
Never 1.15 3.07 18.01 6.51 25.67 Source: Estimates based on primary data survey, 2017.
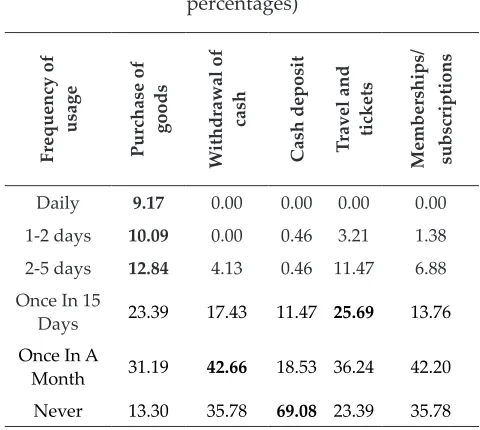
Table 8: The Frequency of usage of credit cards (in percentages)
Frequency of
usage
Purchase of goods Withdrawal of
cash
Cash deposit Travel and
tickets
Memberships/ subscriptions
Daily 9.17 0.00 0.00 0.00 0.00 1-2 days 10.09 0.00 0.46 3.21 1.38 2-5 days 12.84 4.13 0.46 11.47 6.88 Once In 15
Days 23.39 17.43 11.47 25.69 13.76 Once In A
Month 31.19 42.66 18.53 36.24 42.20
Never 13.30 35.78 69.08 23.39 35.78
Source: Estimates based on the primary data survey, 2017.
With regard to “Purchase of goods”, 45 per cent of the respondents used debit cards on a “daily basis”. This revealed that the respondents used debit cards on a higher frequency for the purchase of goods
The frequency of credit card usage was dependent on the revolving credit facility provided by the bank and the rate of interest charged. Table 8 gives the percentage distribution of frequency
of usage of credit cards for various transactions. The respondents used credit cards only once in a
month for the different types of transactions, with the highest percentage recorded for “purchase of goods” (31.19 per cent) followed by “cash deposit” (49 per cent), “travel and tickets” (36 per cent) and “memberships and subscription” (42 per cent).
(e) Effect of Debit and Credit Card Usage on Element
of Cash Management among Respondents: T h e
analysis of the impact of the usage of debit and
credit cards is essential to understand if, in the long
run, the increased usage of debit and credit cards
will lead to the disappearance of cash. Boeschoten
(1992), Duca and Whitesell (1995), Blanchflower
et al. (1998), Stix (2004) and Attanasio et al. (2002)
have assessed the impact of usage of debit cards
and credit cards among households on the various
measures of cash demand. In this regard, the present study analysed the impact of “debit and credit cards” on the essential parameters of “cash management” among the respondents.
Following Simiyu et al. (2012), the study identified seven parameters for verifying the influence of usage of debit and credit cards. The parameters include “bank balance”, “cash in hand”, cash deposits”, “cash withdrawal”, “amount of savings”, “amount of consumption” and “level of indebtedness”. The Likert’s five-point scale scoring method was
used to score the impacts of usage of the instruments on the elements of cash management. The scores of
the respondents were then analysed using Garrett’s ranking methodology to find the highest impact on the parameters by ordering them based on the weighted ranks obtained from Garrett’s weighted
sum and weighted average score.
Based upon the scores assigned by the respondents
for the various parameters, the percentage score of
the ranked parameters are calculated using Garrett’s percentage score formula as:
Percentage position = 100 (Rij – 0.5) / Nj
Where Rij = Rank given for the ith variable by jth
respondents
Nj= Number of variables ranked by jth respondents.
The percentage obtained for the ranks are then converted into their respective scores using Garrett’s table, called the scale value. The weighted sums are obtained by multiplying the number of respondents by the respective scale values and by adding the scores of each rank for every factor. The mean score is then calculated to know the order of impact of usage of debit and credit cards on the parameters.
The factor with the highest mean values is said to
have greater impact due to the usage of debit and credit cards. The distribution of Garrett’s scores is given in table 9.
Table 9: Distribution of Garrett’s scores and ranks
Elements of Cash
Management VMI MI NC MD VMD Total
Bank balance 161 61 155 19 4 400
Cash in hand 122 47 186 35 10 400
Cash deposits 152 37 172 31 8 400
Cash withdrawals 156 58 131 41 14 400 Amount of savings 132 69 149 35 15 400
Amount of
consumption 149 49 162 28 12 400
Level of indebtedness 119 56 172 34 19 400 Source: Estimates based on the primary survey, 2017; VMI = very much increased, MI = moderately increased, NC = No change; MD = Moderately decreased, VMD = very much decreased.
The values in table 9 were used to calculate the percentage score for each ranking factor and thereby to derive at the Garrett’s score value using the Garrett’s table, which are presented in table 10.
Table 10: Estimated Percentage score and the Garrett
score value
Rank Percentage
calculation Percentage score Garrett’s Score*
VMI 100(5-0.5)/5 90 25
MI 100(4-0.5)/5 70 40
NC 100(3-0.5)/5 50 50
MD 100(2-0.5)/5 30 60
VMD 100(1-0.5)/5 10 75
Source: Estimates based on the primary survey, 2017. * Garrett’s value from Garrett’s table; VMI = very much increased, MI =
moderately increased, NC = No change; MD = Moderately decreased, VMD = very much decreased.
management. Table 11 gives the order of impact of usage of debit and credit cards among respondents on their elements of cash management based on the ranking obtained. It is evident from the table that debit and credit cards had the highest impact on the “level of indebtedness”, indicating that cards have
replaced cash predominantly for retail purchases among the respondents in the study.
Table 11: Calculated weighted sum, mean and the rank based on Garrett’s Ranking
Elements of cash
management Total score Mean score Rank
Bank balance 15655 39.14 VII
Cash in hand 17080 42.70 II
Cash deposits 16340 40.85 V
Cash withdrawals 16280 40.70 VI Amount of savings 16735 41.84 III
Amount of
consumption 16365 40.91 IV
Level of indebtedness 17280 43.20 I Source: Estimates based on primary survey, 2017.
The second impact was on “cash in hand”, bringing out the fact that after inducing credit purchases
among respondents with use of credit cards, the
increased use of debit cards have reduced the holding of cash in hand by the respondents. Hence, it can be said that debit cards and credit cards have replaced cash thereby causing a decline in the “transaction motive for holding cash” among
the respondents.
CONCLUSION
This study attempted to analyse the Baumol
Tobin model of demand for money in light of the
adoption of electronic payment instruments via
debit and credit cards among the select households
of Coimbatore City for 2017. The estimated results
revealed that from across the range of transactions,
more than 50 per cent of the respondents preferred “cash-payment” for values lesser than ` 10,000, indicating its preference for “low-value transactions”. Garrett’s Ranking technique to analyse the order of impact of usage of debit and credit cards among respondents showed that usage of “debit and credit cards” impacted the “level of indebtedness”,
indicating that cards dominated the retail purchases among the households of the study.
REFERENCES
Attanasio, Orazio, Guiso, Luigi and Jappelli, Tullio, 2002. The Demand for Money, Financial Innovation, and the Welfare Cost of Inflation: An Analysis with Household Data, Journal of Political Economy, 110(2): 317-351. Boeschoten, W.C. 1998. “Cash Management, Payment Patterns
and the Demand for Money,” De Economist, 146(1): 117-142.
Das Ashish and Agarwal Rakhi 2010. Technical Report 2010 http://dspace.library.iitb.ac.in/jspui/handle/10054/1732. David Bounie and Abel Francois 2006. “Cash, Check or Bank
Card? The effects of Transactions Characteristics on the use of
Payment Instruments”, Working Papers in Economics and Social Sciences, Working Paper ESS-06-05, Available at SSRN: https://ssrn.com/abstract=891791 or http://dx.doi. org/10.2139/ssrn.891791.
Gandhi. R. 2017. Speech by the Deputy Governor of the Reserve
Bank of India, at the launch of the Bharat QR Code,
Mumbai, 20 February 2017. https://www.bis.org/review/ r170223b.htm
https://www.rbi.org.in/Scripts/PublicationVisionDocuments. aspx?Id=678
Humphrey David, Magnus Willeson, Ted Lindblom and Goran Bergendahl 2003. “What does it cost to make a payment?”, Review of Network Economics, 2(2).
Laura Rinaldi 2001. “Payment Cards and Money Demand in Belgium”, Center for Economic Studies Discussions Paper Series (DPS) 01.16, http://www.econ.kuleuven.be/ ces/ discussionpapers/default.htm.
Nyasha Kaseke 2012. “Cash or Plastic Money – An Investigation into the Payment mode during Post-multi-currency period in Zimbabwe”, Int. J. Adv. Res. Mgt. and Soc. Sc., 1(6): 102 – 119.
Rupa Jajoo and Vani Laturkar 2011. “Debit Card Usage in India – A Perspective”, Global Economic Research, 1(1): 54 – 61.
Simiyu, Justo Simiyu, Momanyi, Gedion, Naibei, Kiprotich Isaac and Odondo, Alphonce Juma 2012. “Credit and Debit Card Usage and Cash Flow Management Control by Customers: Evidences from Commercial Banks Customers in Kisumu City, Kenya”, African Research Review, 6(4): 157-172.
Stix, H. Empirica 2004. “How Do Debit Cards Affect Cash Demand? Survey Data Evidence”, 31: 93.
Sunita Agrawal and Ankit Jain 2012. “Technological Advancement in Banking Sector in India: Challenges Ahead”, Abhinav J. Res. Com. Mgt., 2(1): 89 – 96.