World Maritime University World Maritime University
The Maritime Commons: Digital Repository of the World Maritime
The Maritime Commons: Digital Repository of the World Maritime
University
University
World Maritime University Dissertations Dissertations
11-5-2017
A study on the practical use of operations research and vessels
A study on the practical use of operations research and vessels
big data in benefit of efficient ports utilization in Panama
big data in benefit of efficient ports utilization in Panama
Gabriel Fuentes Lezcano
Follow this and additional works at: https://commons.wmu.se/all_dissertations
Part of the Databases and Information Systems Commons
Recommended Citation Recommended Citation
Fuentes Lezcano, Gabriel, "A study on the practical use of operations research and vessels big data in benefit of efficient ports utilization in Panama" (2017). World Maritime University Dissertations. 580.
https://commons.wmu.se/all_dissertations/580
1
WORLD MARITIME UNIVERSITY
Malmö, Sweden
A STUDY ON THE PRACTICAL USE OF
OPERATIONS RESEARCH AND VESSELS BIG
DATA IN BENEFIT OF EFFICIENT MARITIME
PORTS UTILIZATION IN PANAMA
By
GABRIEL FUENTES LEZCANO
Panama
A dissertation submitted to the World Maritime University in partial
Fulfilment of the requirements for the award of the degree of
MASTER OF SCIENCE
In
MARITIME AFFAIRS
(SHIPPING MANAGEMENT AND LOGISTICS)
2017
ii
DECLARATION
I certify that all the material in this dissertation that is not my own work has been
identified, and that no material is included for which a degree has previously been
conferred on me.
The contents of this dissertation reflect my own personal views, and are not
necessarily endorsed by the University.
(Signature):
(Date):
Supervised by: Dr. Daniel Seong-Hyeok Moon
World Maritime University
Internal Assessor: Dr. Dong-Wook Song
World Maritime University
External Assessor: Dr. Jan Hoffmann
iii
ACKNOWLEDGEMENTS
First and foremost, I have to thank my wife Rosario Hernandez for her continuous
support, love and inspiration that encouraged me in giving that extra mile needed for
this project.
My deepest appreciation to my supervisor Dr. Daniel Moon for his constructive advice,
dedication, time and availability to address my questions and guide me through this
dissertation.
I gratefully acknowledge the funding sources given by ITF Seafarers Trust so I could
undertake studies at World Maritime University.
I will like to thank Mr. Juan Carlos Croston and Mrs. Larissa Barrios from Manzanillo
International Terminal for their openness, availability and feedback such as per the
supplied information very much needed as central part of this dissertation.
Particularly, I will like to thank my parents and sister for their emotional support and
encouragement throughout my life.
Last but not least, I will like to thank my colleagues, professors and staff of WMU for
iv
ABSTRACT
Title of dissertation: A study of the practical use of operations research and vessels big data in benefit of efficient maritime ports utilization in Panama
Degree: MSc
This dissertation assesses the impact of operations research tools and big data analytics on vessels and ports operations using Manzanillo International Terminal (MIT) as an example.
Results for the Berth Allocation Problem (BAP) and the Berth and Quay Cranes Allocation and Scheduling Problem (BAQCASP), which are operation research problems, on several occasions lack robustness due to the uncertainty of quay crane performance and vessels unattachment to static optimal berth allocation schedules. With the modeling of MIT port using Python programming language and its linear programming modeler PuLP, solutions for the optimal scheduling of vessels are tested against dynamic adjustments from a database that simulates vessel information refined from big data analytics.
The modeling of MIT is done through a multi-step optimization problem using BAP and BAQCASP and solved by GUROBI Mixed Integer Linear Programming (MILP) solver. The findings from the research show how through a collaborative feed of information between vessels and terminals, a better port utilization, vessel consumption and overall reduction of emissions, could be reached.
The creation of a programming code for this dissertation has the capability of plotting the results on a graph and in an excel .csv file that could then be utilized to generate simulations for additional experiments. An identified additional potential of the code is used as a business decision tool based on its capability of adapting to different scenarios in a very short time.
Based on the results, it can be concluded that an integration of big data analytics to operation research tools has a great potential to be used in practice. However, additional research is recommended in order to identify its financial feasibility.
KEYWORDS: Operations Research, Maritime Big Data, Maritime Business
v
TABLE OF CONTENTS
Declaration ... Error! Bookmark not defined.
Acknowledgements ... ii
Abstract ... iv
Table of Contents ... v
List of Tables ... vii
List of Figures ... viii
List of Abbreviations ... ix
1. Introduction ... 11
1.1 Background ... 11
1.2 Overview of MIT ... 12
1.3 Objectives ... 14
1.4 Methodology ... 14
1.5 Research Contribution... 16
2. Literature review ... 18
2.1 Maritime Big Data ... 18
2.2 Maritime and port inefficiencies ... 19
2.3 BAP and BAQCASP ... 20
3. BAP and BAQCASP modeling of MIT ... 23
3.1 BAP Modeling ... 23
3.1.1 Problem formulation ... 24
3.1.1.1 BAP Input elements ... 24
3.1.1.2 BAP Assumptions ... 29
3.1.1.3 BAP Variables, Objective Function and Constraints ... 30
3.1.2 BAP expected solution ... 32
vi
3.2.1 Problem formulation ... 34
3.2.1.1 BAQCASP additional input elements ... 35
3.2.1.2 BAQCASP assumptions ... 36
3.2.1.3 BAQCASP Variables, Objective Function and Constraints ... 37
3.2.2 BAQCASP expected solution ... 39
3.3 BAP & BAQCASP rolling horizon problem... 41
3.3.1 Rolling horizon problem proposed solution ... 42
3.3.2 Expected results from proposed solution ... 44
4. Dynamic Adjustnment of BAP and BAQCASP using real time vessels and port data ... 46
4.1 Feasible Big Data values for BAP/BAQCASP adjustment ... 47
4.1.1 Terminal input ... 48
4.1.2 Vessels input ... 49
4.2 Dynamic BAP/ BAQCASP development ... 51
4.2.1 Vessels real-time data random simulation ... 51
4.2.2 Vessel evaluation to consider for shifting to a new slot ... 53
4.2.3 Dynamic BAP/BAQCASP simulated scenario ... 54
5. Conclusions ... 63
References ... 65
Appendices ... 70
Appendix A. Liner services including MIT ... 70
vii
LIST OF TABLES
Table 1. Layout description of container berths in MIT. ... 13
Table 2. A calculation example of bi, average feasible processing time of vessel i. 25 Table 3. Result for BAP, utilizing MIT 10/05/2016 schedule ... 32
Table 4. BAP input values repeated as input for BAQCASP ... 34
Table 5. QC assignment based on vessels length ... 35
Table 6. Vessels information after big data analysis/calculation for 4/5/2016... 55
Table 7. Savings caused by speed reduction to arrive just in time for berth allocation ... 58
Table 8. Vessels information after big data analysis/calculation for 5/5/2016... 59
Table 9. Arrival at 04:00 scenario. Consumption difference for next destination ... 61
viii
LIST OF FIGURES
Figure 1. Aerial image of the port of MIT. ... 13
Figure 2. Proposed methodology ... 16
Figure 3. Spatial/temporal graph with 2 vessels assigned to berth 2 ... 24
Figure 4. Graphical representation of BAP solution for MIT 10/05/2016 schedule .. 32
Figure 5. BAQCASP solution graph of Berth 1 with 4 vessels and their assigned cranes ... 34
Figure 6. BAQCASP graph plot returned by python code after solving multi step MILP for MIT 10/05/2016 schedule. ... 39
Figure 7. Excel .csv file with BAQCASP values of vessels assigned to Berth 1 at MIT to the 10/05/2016 schedule ... 40
Figure 8. Dialogue Box generated by python code with final multistep MILP for MIT 10/05/2016 schedule ... 40
Figure 9. Rolling horizon problem on MILP BAP/BAQCASP ... 41
Figure 10. Rolling horizon violation of 3 vessels overlapping space and same cranes utilized by 3 vessels. ... 42
Figure 11. Schedule for the day following Figure 9 enabled with rolling horizon problem solution ... 45
Figure 12. Available idle slots after BAP/BAQCASP solution ... 48
Figure 13. Random geodetic positioning of vessels bound to MIT ... 52
Figure 14. Scenario timeline ... 54
Figure 15. Schedule for vessels served on 3/5/2016 ... 54
Figure 16. Static BAP/BAQCASP for 4/5/2016 (Day 2) ... 55
Figure 17. Day 2 dynamically adjusted and original schedule after BAP/BAQCASP ... 57
Figure 18. Fuel consumption depending on ship speed ... 58
Figure 19. Static BAP/BAQCASP solution for 5/5/2016 (Day 3)... 59
ix
LIST OF ABBREVIATIONS
AIS Automatic Identification System
BAQCASP Berth and Quay Cranes Allocation and Scheduling problem
BAP Berth Allocation Problem
CITOS Computer Integrated Terminal Operations System
DNV-GL Det Norske Veritas- Germanischer Lloyd
DO Diesel Oil
ECDIS Electronic Chart Display and Information System
ECLAC Economic Commission for Latin America and the Caribbean
FAL Facilitation Committee
GPS Global Positioning System
HDFS Hadoop Distributed File System
HFO Heavy Fuel Oil
IFO Intermediate Fuel Oil
IMO International Maritime Organization
IoT Internet of Things
JIT Just in Time
LOA Length Overall
MGO Marine Gas Oil
MILP Mixed Integer Linear Programming
MIT Manzanillo International Terminal
MT Metric ton
NM Nautical miles
RPM Revolutions per minute
S-AIS Satellite- Automatic Identification System
SOG Speed Over Ground
SOLAS International Convention for the Safety of Life at Sea
x STW Speed Through Water
TEU Twenty-foot Equivalent Unit
11
1. INTRODUCTION
1.1 Background
In this challenging time for the maritime industry, use of information will be paramount
for the better utilization of assets.
As the industry is struggling to meet higher profits while facing overcapacity problems,
the use of operations research tools will definitely reduce the gap between
inefficiencies.
Certainly, in this extremely competitive environment, the difference will be at the costs
and service levels. Some of the maritime industry needs have been deeply assessed
through extensive research while others require additional assessment (Lee & Song,
2017). In Lee and Song efforts to classify the existing research done to provide value
to industry needs, the study referred to 5 important segments and the research
attached to these needs:
Shipment routeing and capacity procurement
Container fleet and repositioning
Vessel fleet and operations
Terminal operations and container handling
Inland transport vehicle and container handling
In addition to these necessities and the use of optimal or heuristic tools, the next
natural step needed to approach dynamic and real-time solutions is the use of
vessel´s and port available data in real time.
As stated in “DNV-GL Strategic Research & Innovation Position Paper 4-2014. Big
Data. The new data reality and industry impact” (Løvoll & Kadal, 2014), the use of big
data is authentic and could create an important impact on the following areas:
Technical operation and maintenance
Energy efficiency
Safety Performance
Management and monitoring of accident and environmental risks from
shipping traffic
Commercial operation (as part of a logistics chain)
12
According to (Drewry Shiping Consultants, 2012) the schedule reliability of container
shipping achieved 73%. This uncertainty directly leads to underutilization of resources
for both the port and the liner shipping vessels. Not following a Just in Time (JIT)
process caused by both port and vessel schedule unpunctuality leads to increased
cost caused by vessel fuel consumption and consequently increased CO2 emissions
(Moon & Woo, 2014).
In a win-win situation, terminals would like to have regular arrival patterns of ships, in
line with what was agreed or announced by shipping companies and in return shipping
companies want to minimize their vessels waiting time, even if they are delayed (Lang
& Veenstra, 2010).
Expecting this to be a dissertation that could help in identifying the benefits of a
business model driven by a collaborative approach between stakeholders. The goal
is on concentrating efforts to demonstrate how big data could impact on commercial
operations. Specifically, in port utilization and vessels performance enhanced by
schedule punctuality and proper berth allocation planning, utilizing MIT as an
example.
1.2 Overview of MIT
MIT is a container and Ro-Ro terminal located close to the north entrance of the
Panama Canal in the city of Colon. Operated in a joint venture called MIT- Panama.
S.A by Carrix, Inc. which is a parent company of SSA Marine, Manzanillo together
with the port of Cristobal operated by Panama Ports Company and Colon Container
Terminal operated by Evergreen Group complements the Colon Port region.
As per the Economic Commission for Latin America and the Caribbean (ECLAC)
regarding the last values, Colon stands 2nd in container throughput in Latin America
and the Caribbean just after Santos, Brazil with a general throughput of 3.2 M TEU in
2016 (Economic Commission for Latin America and the Caribbean, 2017).
MIT is considered an important node for several liner services (see Appendix A) that
utilizes this port mostly for transshipment, which accounts for almost 85% of its total
operations. The port has 2,500 meters of berth from which 3 Ro-Ro berths and 6
container berths forms part of the layout. For the purpose of this research, the
13
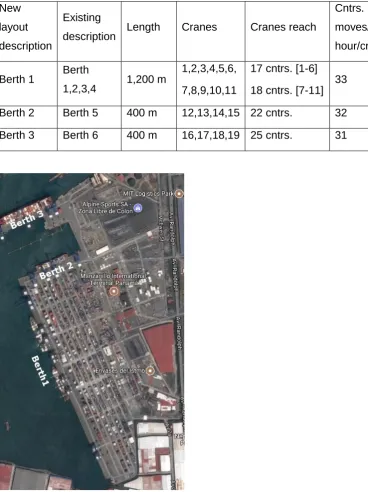
1,2,3,4 and the remaining berths of 400 m each classified as individual berths (see
Table 1).
Table 1. Layout description of container berths in MIT.
New
layout
description
Existing
description Length Cranes Cranes reach
Cntrs.
moves/
hour/crane
Berth 1 Berth
1,2,3,4 1,200 m
1,2,3,4,5,6,
7,8,9,10,11
17 cntrs. [1-6]
18 cntrs. [7-11] 33
Berth 2 Berth 5 400 m 12,13,14,15 22 cntrs. 32
Berth 3 Berth 6 400 m 16,17,18,19 25 cntrs. 31
Figure 1. Aerial image of the port of MIT. (Google Maps, 2017)
All container berths have a minimum depth of 14 m with a very small average tide
14
The use of 19 cranes with a reach from 17 containers up to 25 containers allows MIT
to provide services including New Panamax vessels1 whose volume of transit has
increased due to the opening of the expanded Panama Canal.
The increase of more than 10 additional liner services after Panama Canal expansion
(Panama Canal Authority, 2017) together with important logistic services and its
proximity to the transisthmian railway and the biggest free trade zone of the region
make MIT an important node of transit for the new services.
1.3 Objectives
Main Objective
Identify the feasibility of operation research techniques together with real time
data exchange and demonstrate their impact on vessels and port operations
at the port of MIT.
Specific Objectives
Adjust the use of the BAP and BAQCASP given the real conditions of the port
of MIT.
Demonstrate the impact of proper planning and dwell time reduction at port on
vessels operation.
Compare static models of BAP and BAQCASP with a dynamic scenario where
decisions of vessels scheduling are taken based on a combination of the
previously mentioned models and real-time data received from vessels.
Provide with a decision-making tool to the port of MIT based on BAP,
BAQCASP and vessels real time data exchange.
1.4 Methodology
The BAP and BAQCASP will be modeled given the actual conditions of MIT with the
use of Python programming language and its module PuLP which is a MILP modeler.
GUROBI will be utilized as the solver for the optimal results modeled through PuLP.
1 New Panamax Vessel: Container vessel of 366m length, 49m beam, 15.2 m draft and capacity of
15
Data utilized as input for these models was provided by the port of MIT with some few
exceptions given their sensitive nature. Assumptions taken to replace these
exceptions will be properly pointed out throughout this dissertation.
Data Base manipulation and creation of vessel values were done utilizing Python
module Pandas. Pandas used as a replacement of SQL language has the same
operationality with the powerful platform provided by Python.
In some scenarios, the approach is done through a comparison of the results on a
vessel following a fixed schedule against others with more flexibility, accounting
factors like speed reduction, weather routeing and slot exchange causing speed
adjustment.
Vessels’ real-time data will be simulated based on assumptions described throughout
this document. The use of this database will then be taken into account to perform
adjustments to BAP and BAQCASP results.
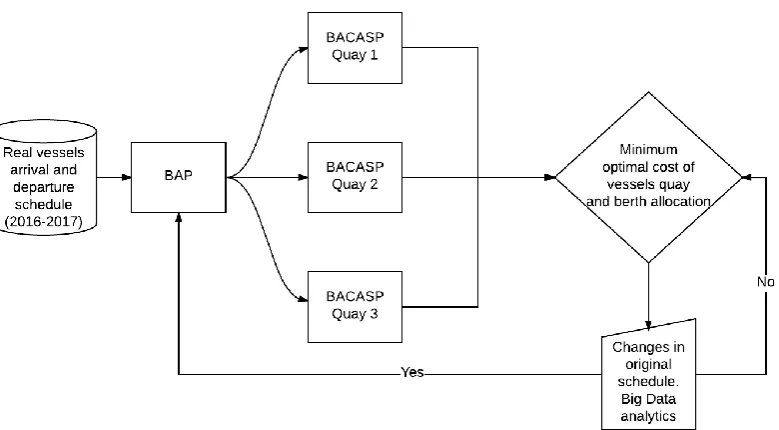
The first stage of the project is to model the port into a BAP utilizing the database
supplied by MIT with the arrival and departure time of real vessels calling the port in
the past year.
The second step will create an individual BAQCASP model that could return optimal
results provided by the crane description for each berth. Berths assigned to a vessel
will dynamically determine the processing time of the vessels to be attended based
on their per hour movement and the containers to be moved from/to the vessel.
The integration of both models will be achieved by merging them into a multistep
optimization approach that will utilize the results of step 1 as input for step 2, meaning
that the selection of a berth will be done in step 1 and that result will determine in what
of the three BAQCASP optimization problems a vessel will be part of, later on. The
sum of the three BAQCASP will return the minimum feasible combination of position
and berthing time considering available space in the three available berths.
Finally, an evaluation of the optimal results with a created scenario simulating real
time data feed will help in adjusting the model and re running it through the BAP and
BAQCASP considering the real time of arrival of a vessel and if it could cause a speed
16 Figure 2. Proposed methodology
1.5 Research Contribution
Given the high capital investment required for vessels and ports to remain
competitive, the use of operation research techniques such as BAP and BAQCASP
and the utilization of technological trends such as Big Data has now proven practical
when utilized individually and has the potential to create a powerful combination for
better utilization of assets which is aimed to be proved in this research.
The outcomes of this research will serve to demonstrate the power of MILP with the
manipulation of databases utilizing Pandas, which in a future research could be
replaced by the use of the most significant Big Data Hadoop Distributed File Systems
(HDFS) feature. This is the MapReduce2 that enhances significantly mining through
huge patches of data. A Python module named mrjob has already proven a good
adjustment for Python of the JAVA written MapReduce.
The creation of a multi-step MILP model exclusively for the layout and quay
distribution of MIT could be used for the formulation of, for example, additional linear
2 Hadoop MapReduce: is the original framework for writing applications that processes large
17
programming models, integer programming models, heuristics models and genetic
algorithms. at the port of MIT.
The creation of a multi-step optimization model with BAP and BAQCASP could be
segregated to measure the performance of the port considering each model
separately.
This research is expected to prove that the first step towards the dynamic combination
of big data is feasible and could be used to compare the actual port performance
against the recommended scheduling of the optimization model. The next step is now
open towards the integration of a dynamic merge of big data algorithms that could
recognize the best fit for empty spaces based on constraints such as the speed
needed to arrive and if it is worth increasing or reducing speed based on next
destinations.
Future research including a collaborative approach between different multimodal
stakeholders including trucks, ports, vessels and the Panama Canal will help in
enhancing the model and introducing new constraints that will aim in finding the
objective of minimum cost of a whole logistic platform. For the time being, the model
could be adapted to change the objective of the minimum cost for the minimum level
of CO2 emissions, considering the distance of trucks to suboptimal vessel locations,
the speed performance of the vessel before arriving MIT and the savings that results
in being served promptly and consequently being able to steam slower to the next
18
2. LITERATURE REVIEW
2.1 Maritime Big Data
The use of big data has generated a great enthusiasm among researchers as per the
powerful capabilities offered in a constant retrieval of information from vessel
conditions. Big Data is defined as data sets whose size is beyond the ability of typical
database software tools to capture, store, manage and analyze (Mckinsey Global
Institute, 2011). The difficulties arosing from big data created the opportunity and the
inherent need of human skills of insight and pattern recognition to find genuine
meaning in the data. (Lloyds Register Foundation, 2014)
Based on the more common usage of “big data” in the maritime industry, an analysis done in “Major challenges and solutions for utilizing big data in the maritime industry”
(Koga, 2015) correctly assessed the potential of the practical use of big data in line
with the enhancement of maritime areas such as energy efficiency, safety
performance, technical operations and maintenance and commercial operations.
Koga’s dissertation has related this information from very important sources of research such as “DNV-GL Strategic Research & Innovation Position Paper 4-2014 Big Data” (Løvoll & Kadal, 2014) and “Foresight review of big data: Towards data-centric engineering”. (Lloyds Register Foundation, 2014). These sources validate Koga’s assertions in the potential of the areas of development, additional to the
challenges that big data could face from where privacy issues, data governance,
availability of powerful tools, flexibility and near monopoly providers, are mentioned.
A valuable fact from Koga’s dissertation and papers of DNV-GL and LRF is that for
the data to be recognized as big data it should be extraordinary in one or multiple of
the following dimensions (volume, velocity, variety and veracity).
Koga’s dissertation creates a good foundation for the next natural step that is the
utilization of big data as a game changer in practice and the more efficient utilization
of maritime and logistics assets through a dynamic decision-making process driven
by operations research techniques explained in simulated scenarios utilizing vessels
and port data as input.
The enhancer of big data utilization in the maritime field follows a comparison done
19
environment, performs by having long cycles decision-making processes based on
past events and the optimization based on old data. The counterpart which is the
information centric data also known as real time data, bases the decision-making
process making use of current events and the optimization process based on actual
data (Vitsounis, 2014). The complexity of this approach as expressed by Vitsounis is
that supply chains are dynamic, unpredictable and diverse by nature. The low
visibility, repetitive information and high fragmentation of the supply chain
stakeholders add additional pressure to the best performance a supply chain could
have. A central organism such as a port community system that could work as a
central, open and neutral infrastructure for the whole community, will help in
enhancing strategies to optimize supply chains through the identification of bottle
necks and the constant feed of information to sophisticated algorithms through big
data. From this analysis, it is clear that big data on integrated logistics platforms such
as where ports and vessels merge requires a highly collaborative approach.
2.2 Maritime and port inefficiencies
One of the factors that are of great concern by liner shipping companies is the
schedule reliability and their implications in their port dwell time that affects their
bottom line profits through additional cost and the increased required speed to keep
up with their next destinations in a full liner service. An analysis of the factors causing
liner schedule reliability and the implications of decreasing schedule integrity for
seaports and their actors was carried out by Vernimmen, Dullaert and Engelen in
2007. It has been argued by Notteboom, in 2006 that delays at port caused by late
arrivals might be a competitive factor for mature markets where competing lines are
not differentiated and transit times are comparable. Notteboom described the sources
of liner delays considering ports and vessels and the measures and planning tools
container services utilizes to maximize schedule reliability.
An analysis of Drewry Shipping Consultants in 2012 mentions that there is a group of
carriers that is almost never on time and may easily have delays of 2 or 3 days. A
complete analysis on carriers’ punctuality was also carried in this published
document.
A quantitative analysis was carried by Lang and Veenstra (2010) with a comparison
20
scenarios delivered by Lang and Veenstra, the introduction of a central Arrival
Planning Strategy (APS) enhances the coordination of shipping lines and terminals.
Hence, generating monetary and operational benefits for both parties, which were
quantified as part of the results of this publication.
A research carried by Moon and Woo (2014) assesses the impact of port operations
on vessel speed performance and the effect it has on CO2 emissions and fuel
consumption. The study focusses on how the waiting and berthing time at port
influences the vessel operations costs and at the same time affects the terminal
competitiveness measured most of the time through the ship time at a port which is a
key indicator to measure the efficiency of port operations.
A delay caused by the terminal could have its origin in factors such as port congestion,
quay cranes breakdowns, strikes, natural disasters and bottlenecks in access
channels, which are factors assessed by Maloni and Jackson (2005), Lun, Lai and
Cheng (2010) and Notteboom (2006) as cited by (Moon & Woo, 2014).
It is important to mention that there is a gap of research related to the utilization of
centralized data from the integration of ports and vessels’ information to create an optimal schedule less sensitive to the vessels’ arrival punctuality.
2.3 BAP and BAQCASP
BAP and BAQCASP have been extensively assessed in the existing literature as they
are two important issues in the operation of container terminals.
The use of the widely known operations research problem, the Multiple Machine
Scheduling Problem and the Resource Allocation and Scheduling Problem mostly
utilized in manufacturing and their introduction into port and vessels operations is what
is now known as BAP and Quay Cranes Allocation and Scheduling Problem
(QCASP). The similarity is based on the fact that tasks have to be assigned by
machines utilizing resources and vessels (tasks) must be served at quays (machines)
by additional resources (quay cranes).
BAP is classified in two different branches, the discrete BAP and the Continuous BAP.
Literature describing BAP should fall in one or another section.
The discrete BAP considers an entire wharf as a set of partitions where a vessel could
21
Lai and Shih (1992) while assessing the characteristics of a major container terminal
in Hong Kong and a comparison of their allocation procedures which were usually
following a First Come First Served approach in relation with a heuristic and simulation
solution. They could demonstrate improvements in comparison with the terminal
allocation practices. An approach taken by Imai, Nagaiwa and Tat (1997) addressed
the BAP with the assumption that every vessel is ready to be served at the beginning
of a planning horizon. This assumption was trimmed by Imai, Nishimura and Stratos
(2001) where the consideration of vessels arriving after the beginning of the planning
horizon was introduced. An introduction of a weighting for giving a service priority to
selected vessels was then assessed by Imai, Nishimura and Papadimitriou (2003).
The continuous BAP considers the quay as an undivided space where vessels can
berth at any position in a single continuous line of a given length (Froja, Correcher,
Valdes, Koulouris, & Tamarit, 2015). One of the first to introduce the concept were Li,
Cai and Lee (1998) as a machine sequencing problem not adapted to address berths.
A MILP relaxed by a Lagrangian relaxation with discretized space of berth and time
to reduce computational load was developed by Park and Kim (2002).
The addition of multiple quays to the problem of continuous BAP was introduced by
Froja, Correcher, Valdes, Koulouris and Tamarit (2015), where the variables of
assigning vessels to a specific quay, berthing times and positions are mixed with the
regular BAP constraint of time and space while minimizing the penalty cost of being
deviated from the desired position, delay penalty, different quay assignment cost and
the cost of waiting for a berth.
Some of the research on BAP and BAQCASP weakest link is the uncertainty caused
by unknown information, breakdowns, changes or incidences, making the initial
optimal plans infeasible. Studies realized by Umang, Bierlaire and Erera (2013) has
introduced stochastic approaches to the arrival and handling times of vessels which
are uncertain.
The introduction of time buffers for dealing with the uncertainty of vessels arrival and
vessels handling time at BAP was studied by Xu, Chen and Quan (2012). A proper
real-time monitoring of vessels aims to create a follow-up and convert arrival times in
deterministic for the correct application of the BAP and BAQCASP results in real life
22
The BAQCASP have been usually assessed separately from the BAP. Few studies
have addressed these problems together. This problem aims within the minimum
optimal cost caused by delays and positioning of the vessel, to locate every expected
vessel in a position where it could be served with less than the maximum number of
available quay cranes. This problem considers the use of continuous BAP’S of a
single berth. One of the first to address this problem were Park and Kim (2003)
through an integer programming model formulated by a two-step solution. The
publication of Imai, Chen, Nishimura and Papadimitriou (2008), tackles the
formulation of simultaneous quays and crane allocation problem through a heuristic
solution. The introduction of the constraint of the cranes range of motion was part of
the formulation of a MILP model proposed by Zhang, Zheng, Shi and Armstrong
(2010). Following an integrated approach, Correcher, Alvare-Valdes and Tamarit
(2017) delivered a continuous BAQCASP that does not require berth discretization,
allowing vessels to be moored at any position of the berth and being served with sets
of cranes that could not surpass the area of the next crane.
For the creation of a model that could simulate the characteristics of MIT, no literature
has created what should be considered as a Continuous BAQCASP with multiple
quays. An additional challenge for this dissertation is the creation of an optimal
solution where vessels are assigned to berths and position together with the cranes
and the number to be used and based on that number and crane type, a dynamically
23
3. BAP AND BAQCASP MODELING OF MIT
3.1 BAP Modeling
BAP refers to the optimal location of a vessel in a berth over a planning horizon
considering an objective function that could be selected based on the delay and
position cost of placing a vessel in a berth position at a specific time. Modifications to
the objective function could be related with finding the minimum makespan3 or to find
the minimum emission level caused by the position and time of berthing a vessel.
The main constraints related with this problem deals with spatial and temporal
restrictions. The spatial restrictions have to do with the berth dimensions, including
length. The temporal restrictions need to acquaint for the arrival and berthing date of
the vessel (Rodriguez, Rosa, Gomes, & Ribeiro, 2016).
As mentioned previously, according to the spatial restriction, BAP could be divided
into discrete BAP, continuous BAP and hybrid BAP. The discrete BAP uses set of
quays that divides a berth, each of which can harbor one vessel at a time (Lin, Ying,
& Wan, 2014). In continuous BAP, the quay is not divided and vessels can berth at
any position along the pier (Bierwith & Meisel, 2010) as cited by (Rodriguez, Rosa,
Gomes, & Ribeiro, 2016). The description of hybrid BAP as a partition area of a quay
with the possibility of having larger vessels occupying more than one quay was given
by Rodriguez, Rosa, Gomes and Ribeiro (2016).
Based on the temporal approach, a BAP can be divided into static or dynamic. The
static problem has to do with a set of vessels ready to be served at a quay at the
beginning of a planning horizon while a dynamic problem accepts to receive vessels
through the planning horizon, once the arrival time is known in advance (Gkolias,
2007).
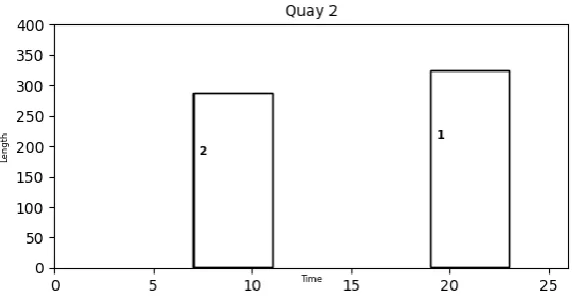
Results for BAP are expected as a two-dimensional temporal/spatial graph with the x
axis representing the time from 0 up to the planned horizon and the y axis
representing the length of the berth (see Figure 3).
24
Figure 3. Spatial/temporal graph with 2 vessels assigned to berth 2
The configuration of MIT layout requires of a BAP of a continuous type with dynamic
arrivals but with the addition that a selection of a single among multiple quays (3)
could be done.
The main goal of BAP, in this case, will be assigning vessels to feasible quays taking
into consideration the minimum cost caused by the waiting time, suboptimal position
and delay after planned departure time. The result will also be provided with the
optimal position in the selected berth, together with the berthing time. However, at this
stage, the main interest is of knowing at what berth a vessel is assigned.
3.1.1 Problem formulation
Information utilized as input for the model is absorbed from a database given by the
terminal but trimmed and adjusted for the purpose of this dissertation. Some columns
were created following some assumptions. The description of the needed values for
the BAP model will be provided with the detail of how they were acquired and if it is
from an assumption or from the original data. This model was created and adapted
from, “The continuous Berth Allocation Problem in a container terminal with multiple berths” published by Froja, Correcher, Valdes, Koulouris and Tamarit (2015).
3.1.1.1 BAP Input elements
Berths
𝑞 ∈ 𝑄. A set of berths, elements of total berths. (q=1,2,3)
Lq
. ∀ 𝑞 ∈ 𝑄 Length of each berth. (q1=1,240m,q2 = 400m, q3= 400 m). Informationacquired from (Georgia Tech Panama. Logistics and Innovation & Research Center,
25
Vessels
𝑖 ∈ 𝑉Set of vessels elements of Vessels. (i=1,2,3, …., n). Each planning day has a
number of vessels to be served. The filtering criteria of this section is the date in the
database when the vessel was served.
𝑙𝑖
𝑖∀ 𝑖 ∈ 𝑉
. Length of each vessel. For vessels of more than 130 m a 10% safetymargin is added as part of the length, otherwise, 10m is added to the vessel original
length.
𝑏𝑖
𝑖. ∀ 𝑖 ∈ 𝑉
. Estimated handling time (loading/unloading). Value was calculatedconsidering the number of containers to be moved from/to the vessel divided by
several combinations of the feasible crane assignment each vessel could have. i.e. a
vessel with a beam of 49 meters for being served up to the last container requires a
crane with a reach at least of 20 containers, based on the width of a container
(49m/2.43m + allowance). This means that it could be served by cranes from berth 2
and berth 3 exclusively (see Table 1). Given that the performance of the cranes is
provided and the minimum and maximum per vessel crane requirement is provided,
a set of values having all the handling times for all combinations of containers to be
handled and cranes servicing was calculated. This set of values provides an average
of the vessel handling time before setting the amount and type of containers to be
used.
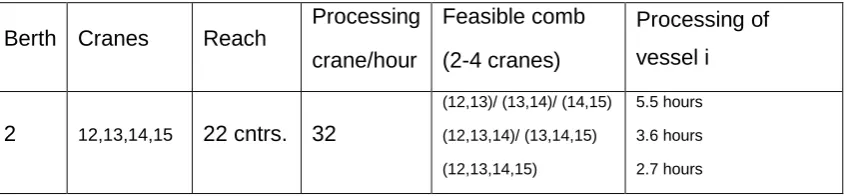
e.g. The case of vessel i with 49 m beam and 350 containers to be moved at an
agreed min/max cranes allocation of 2 and 4 respectively:
Processing of vessel i with 2 quay cranes combination at berth 2 = 350 cntrs. / 2x32
cntrs. per hour = 5.5 hours.
Table 2. A calculation example of bi, average feasible processing time of vessel i.
Berth Cranes Reach
Processing
crane/hour
Feasible comb
(2-4 cranes)
Processing of
vessel i
2 12,13,14,15 22 cntrs. 32
(12,13)/ (13,14)/ (14,15) (12,13,14)/ (13,14,15) (12,13,14,15)
26 3 16,17,18,19 25 cntrs. 31
(16,17)/ (17,18)/ (18,19) (16,17,18)/ (17,18,19) (16,17,18,19)
5.6 hours 3.7 hours 2.8 hours
Avg.(bii)= 4.0hours
𝑎𝑖𝑖∀ 𝑖 ∈ 𝑉. Arrival time. Time when a vessel is ready to be processed. 2 hours after
confirmed and monitored Estimated Time of Arrival (ETA). Available from raw
database.
𝑠𝑖𝑖 ∀ 𝑖 ∈ 𝑉. Desired departure time. Time when a vessel is scheduled to depart due
to next destination planning or Panama Canal transit scheduled window. Actual Time
of Departure (ATD) value at the raw database was used as input.
diqi,q ∀ 𝑖 ∈ 𝑉,∀ 𝑞 ∈ 𝑄. The ideal position of vessel i at berth q. The best position to
moor the vessel at each berth, based on the following considerations in order of
importance:
If a vessel´s length is more or equal than 250 m then vessel i ideal position is
{q1=(1240m-lii), q2=1, q3=1}. This means that considering the maneuvering
capabilities of bigger vessels, it is desirable to have them served on the northerly
border of berth 1. No constraints are expected for a big vessel in the wide areas of
berth 2 and 3, so any position is expected.
If a vessel´s reefer containers are more or equal than 100 units, then {q1=500, q2=1,
q3=1}. MIT moves 85% of the containers for transshipment purposes. This
consideration allows the port to utilize most of their yard for transshipment services,
the increased movement of reefer cargo that will reach values of 120 million tons in
2020 (Drewry, 2016) will attach a level of importance to the position at which vessels
are moored. The assumption of having vessels with an important amount of reefer
containers moored at the middle section of berth 1, follows the logic of moving reefer
containers out of electrical plugs as less as possible hence the distance to the quay
side should be the lowest. Plugs are assumed to be located in the middle section of
berth 1. Berth 2 and 3 as transversal berths does not follow this consideration; hence,
27
If a vessel´s dangerous cargo containers are more or equal than 100 units, then
{q1=1240m - lii, q2=1, q3=1}. The consideration of this assumption is based on safety.
Based on the terminal layout, in case of a fire or dangerous leak, the vessel must
ideally be isolated as far as possible from the port offices and gate of the free trade
zone at the south border.
If a vessel´s transshipment/import cargo is more or equal than a 2:1 ratio, then
{q1=500m, q2=1, q3=1}. The assumption following this assignment is that since
transshipment cargo is expected to be a short time at the yard. A connection to the
next vessel should be done from the closest location possible. Imports are expected
to be stored close to customs check points.
Otherwise {q1=1, q2=1, q3=1}. If any of the previous considerations are not met, the
vessel is not strictly forced to have an ideal position.
Cost
ciwi. ∀ 𝑖 ∈ 𝑉 . Cost per hour waiting for a berth. Cost of anchorage not included as
anchorage out of Panama Canal waters is utilized. Bunker consumption cost for
Diesel Oil (DO) electric generators calculated per hour, takes the assumption that a
vessel that is more than 3000 TEU could be considered as a deep-sea vessel with
7.9 MT of Intermediate Fuel Oil (IFO) 380 consumption per day at a price of $315.52
/MT for and hourly consumption of $103.80/hr. A vessel that is less than 3000 TEU
could be considered as a feeder vessel with 1.2 MT of Marine Gas Oil (MGO)
consumption per day at a price of $606.05 /MT for an hourly consumption of
$30.30/hr. The values of consumption were supplied by The Port of Rotterdam
Authority (2006) and the bunker cost was obtained from an average of values for the
last year obtained from Clarksons Research Limited Services (2017).
cidi∀ 𝑖 ∈ 𝑉. Cost per unit time delay with respect to the desired departure time. This
value includes the cost of bunker utilized at a port, having the same considerations
as the previous cost description. If the vessel has a reserved slot for a southbound
transit of the Panama Canal via the Pacific Ocean, the cost of cancelling the
reservation with short notice (less than 36 hours) is 100% of the reserve fee (Panama
Canal Authority, 2017) and is also added as cost of time delay with respect to desired
28
of vessels per liner service and an analysis of all the services transiting from MIT to
the Pacific Ocean for a next destination.
The price consideration for every case takes into account the following filter:
If a vessel´s length is less than 150m and transits the Panama Canal right after
completing operations at the terminal, then
cidi
= $30.30/hr. (feeder vessel DO hourlyconsumption) + $2,500 (Panama Canal reservation fee for vessels up to 92 m of
length overall (LOA)). Note that the vessel length is fixed in 150m, taking the
assumption that both vessels 92m and 150m are considered feeder vessels.
If a vessel´s beam is less than 24m, the length is more or equal than 150m and the
vessel is expected to transit the Panama Canal, then
cidi
= $103.80/hr. (deep seavessel Heavy Fuel Oil (HFO) hourly consumption) + $5,500 (Panama Canal
reservation fee for vessels less than 24 m beam and more than 92m LOA).
If a vessel´s beam is more or equal than 24m but less than 27m, the length is more
or equal to 150m and the vessel is expected to transit the Panama Canal, then
cidi
=$103.80/hr. (deep sea vessel HFO hourly consumption) + $10,500 (Panama Canal
reservation fee for vessels more than 24m beam but less than 27m and more than
92m LOA).
If a vessel´s beam is more or equal than 27m but less than 31m, the length is more
or equal than 150m and the vessel is expected to transit the Panama Canal, then
cidi
= $103.80/hr. (deep sea vessel HFO hourly consumption) + $18,500 (Panama Canal
reservation fee for vessels more or equal to 27m beam but less than 31m and more
than 92m LOA).
If a vessel´s beam is more or equal than 31m, the length is more or equal than 150m
and the vessel is expected to transit the Panama Canal, then
cidi
= $103.80/hr. (deepsea vessel HFO hourly consumption) + $35,500 (Panama Canal reservation fee for
vessels more than 24m beam but less than 27m and more than 92m LOA).
If a vessel not transiting the Canal has a length more or equal than 150m, then
cidi
=$103.80/hr. (deep sea vessel HFO hourly consumption)
If vessel not transiting the Canal has a length less than 150m, then
cidi
= $30.3029
caiqi,q. ∀ 𝑖 ∈ 𝑉, ∀ 𝑞 ∈ 𝑄. Cost of assigning a vessel i to a berth q. The default values
for this cost is 1 for every vessel in any berth. The adjustment to these values is
generated based on the case of a vessel being served after the 24th hour of the
planning horizon of a single day given the result of the BAQCASP. In case a vessel
is required to be processed in a time period exceeding the 24 hours planning horizon
limit, it is virtually introduced once again in the BAP problem as starting from time 0
at the specific same spot where it was served in the previous day at time 24. To force
the model to allocate the vessel in the exact same berth it was served, a dummy value
is created for a vessel, forcing it to have an extremely high cost of
caiqi,q
in this casewill be of $50,000 for the quays the vessel should avoid and $1 for the quay expected
to keep serving the vessel.
cpii ∀ 𝑖 ∈ 𝑉. Cost of unit deviation of vessel i from its ideal position at berth q. Every
vessel has a desired position based on the quantity and the characteristics of the
containers to be handled at every call as described in
diqi,q
(desired vessel i positionat berth q). Failing to be moored at the ideal position will represent an additional cost
to the trucks handling containers for more distance as planned. The cost takes the
consideration of a loaded Volvo truck with a trailer and the capacity to load up to 60
tons including chassis weight. A truck with these characteristics is expected to burn
43 lt. of Diesel Oil in 100kms (Volvo Trucks, 2014), tear and wear are not considered
in this assumption. For the purpose of this calculation it is assumed that a truck has
to be positioned below a quay crane and to the assigned area of the yard; hence, a
roundtrip is to be assigned as a cost for a vessel being moored away from the ideal
position (close to the assigned stacking yard area). Given the previous assumptions,
the cost of moving a truck away from it desired position is calculated as follows:
0.00043lts/meter x $1.50 (DO price per liter) = $0.000645 x 2 (Roundtrip)= $0.001
per container moved away from ideal position.
A vessel expected to be served beyond the 24th hour of the planning horizon will
create a dummy value that enables the vessel to be served in the exact same position
in the next day where it was served at the end of the previous day.
3.1.1.2 BAP Assumptions
30
Vessels will be processed as soon as they are moored; hence, maneuvering
time and mooring time is included in the arrival time
aii
∀ 𝑖 ∈ 𝑉. Once a process starts it cannot be interrupted. Vessels are not allowed to shift
position in a berth.
A vessel that could not complete her processing in the 24th hour of the planning
horizon will be forced to be assigned at the same position and berth where it
was processed the previous day.
Vessels are all assumed to have less or equal than 13.30m draft at arrival that is calculated from 14 m – 5% safe UKC margin alongside.
Handling times for the vessels are considered fixed and independent of the
berthing position. This assumption is reasonable if the quay has enough
machinery and workers for the loading/unloading task at any moment. (Lim,
1998) as cited by (Froja, Correcher, Valdes, Koulouris, & Tamarit, 2015).
3.1.1.3 BAP Variables, Objective Function and Constraints
The chosen variables for this problem could be described as follows:
Decision variables:
ti ∀ 𝑖 ∈ 𝑉= berthing time of vessel i
pi ∀ 𝑖 ∈ 𝑉= position of vessel i at assigned berth hi ∀ 𝑖 ∈ 𝑉=delay of vessel i in units (hours)
ei ∀ 𝑖 ∈ 𝑉 = deviation of vessel I from ideal position at assigned berth in meters
Binary variables:
mi,q
∀ 𝑖 ∈ 𝑉, ∀ 𝑞 ∈ 𝑄. 1 if vessel i is moored at berth q, 0 otherwise σij ∀ 𝑖 , 𝑗 ∈ 𝑉 .1 if vessel i is completely processed before vessel j, 0 otherwise δij ∀ 𝑖 , 𝑗 ∈ 𝑉 . 1 if vessel i is positioned completely below vessel j, 0 otherwise
The BAP goal is to find the optimal position and berth allocation of every served vessel
that could generate the minimum cost. However, it is of great interest to solely find
the feasible optimal combination of vessels in each berth. Based on this, the objective
function for this problem is:
𝑀𝑖𝑛 [∑(𝑐𝑖𝑤𝑖(𝑡𝑖− 𝑎𝑖𝑖) + 𝑖∈𝑉
𝑐𝑖𝑑𝑖ℎ𝑖+ ∑ ∑(𝑐𝑎𝑖𝑞𝑖,𝑞𝑚𝑖,𝑞+ 𝑐𝑝𝑖𝑖𝑒𝑖) 𝑖∈𝑉
𝑞∈𝑄
]
31
To avoid overlapping in time and space of vessels.
𝛿𝑖,𝑗+ 𝛿𝑗,𝑖+ 𝜎𝑖,𝑗+ 𝜎𝑗,𝑖 ≥ 𝑚𝑖,𝑞+ 𝑚𝑗,𝑞− 1 ∀ 𝑖 , 𝑗 ∈ 𝑉, 𝑖 ≠ 𝑗, ∀ 𝑞 ∈ 𝑄
o Time overlapping avoidance.
𝑡𝑗− (𝑡𝑖+ 𝑏𝑖𝑖) − (𝜎𝑖,𝑗− 1)𝐻 ≥ 0 ∀ 𝑖 , 𝑗 ∈ 𝑉, 𝑖 ≠ 𝑗
o Space overlapping avoidance.
𝑝𝑗− (𝑝𝑖+ 𝑙𝑖𝑖) − (𝛿𝑖,𝑗− 1)𝑙𝑚𝑎𝑥 ≥ 0 ∀ 𝑖 , 𝑗 ∈ 𝑉, 𝑖 ≠ 𝑗
The length of vessel i has to be less than the maximum length of selected
berth.
𝑝𝑖+ 𝑙𝑖𝑖 ≤ ∑ 𝑚𝑖,𝑞𝐿𝑞 ∀ 𝑖 ∈ 𝑉, ∀ 𝑞 ∈ 𝑄 𝑞 ∈ 𝑄
Every vessel has to be assigned only to one berth.
∑ 𝑚𝑖,𝑞 = 1
𝑞 ∈ 𝑄
∀ 𝑖 ∈ 𝑉
Vessel must be moored after arrival.
𝑡𝑖 ≥ 𝑎𝑖𝑖 ∀ 𝑖 ∈ 𝑉
A positive number is given to the delay time if it is later than desired departure
time.
ℎ𝑖 ≥ 𝑡𝑖+ 𝑏𝑖𝑖− 𝑠𝑖𝑖 ∀ 𝑖 ∈ 𝑉
Deviation of vessel from desired position at the assigned berth
o If the vessel is positioned above of her ideal position (graph
perspective).
𝑒𝑖 ≥ 𝑝𝑖− ∑ 𝑑𝑖𝑞𝑖,𝑞𝑚𝑖,𝑞 ∀ 𝑖 ∈ 𝑉 𝑞 ∈ 𝑄
o If the vessel is positioned below of her ideal position (graph
perspective).
𝑒𝑖 ≥ ∑ 𝑑𝑖𝑞𝑖,𝑞𝑚𝑖,𝑞− 𝑝𝑖 ∀ 𝑖 ∈ 𝑉 𝑞 ∈ 𝑄
Decision variables must all be non-negative.
𝑡𝑖, ℎ𝑖, 𝑒𝑖 ≥ 0 ∀ 𝑖 ∈ 𝑉
Vessel i should not be moored directly at the borders of the berth.
32
3.1.2 BAP expected solution
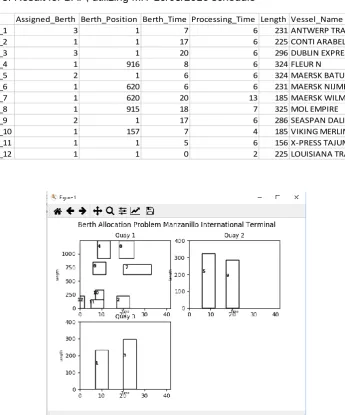
This problem solution will be provided with values to the decision variables of where
to position the vessels based on the previous constraints while trying to provide the
optimal minimum cost of vessels allocation (see Table 3 and Figure 4). These values
will be disregarded with the exception of
mi,q
which is a binary variable stating in whatberth does the vessel have a reserved spot and will be utilized as input for choosing
in what of the BAQCASP a vessel will be processed. i.e. in Table 3, Vessel_1 will be
assigned to BAQCASP for berth 3.
Table 3. Result for BAP, utilizing MIT 10/05/2016 schedule
Figure 4. Graphical representation of BAP solution for MIT 10/05/2016 schedule Vessel Assigned_Berth Berth_Position Berth_Time Processing_Time Length Vessel_Name
Vessel_1 3 1 7 6 231 ANTWERP TRADER
Vessel_2 1 1 17 6 225 CONTI ARABELLA
Vessel_3 3 1 20 6 296 DUBLIN EXPRESS
Vessel_4 1 916 8 6 324 FLEUR N
Vessel_5 2 1 6 6 324 MAERSK BATUR
Vessel_6 1 620 6 6 231 MAERSK NIJMEGEN
Vessel_7 1 620 20 13 185 MAERSK WILMINGTON
Vessel_8 1 915 18 7 325 MOL EMPIRE
Vessel_9 2 1 17 6 286 SEASPAN DALIAN
Vessel_10 1 157 7 4 185 VIKING MERLIN
Vessel_11 1 1 5 6 156 X-PRESS TAJUMULCO
33
3.2 BAQCASP Modeling
The BAQCASP is an optimization problem that aims to find the least cost from the
combination of vessels assignment at a continuous berth while allocating available
quay cranes at that berth.
Quay cranes are assigned considering the minimum and maximum allowance for
every vessel, which most of the time is agreed contractually by the liner shipping
company and the terminal. For the purpose of this model, a series of assumptions are
taken based on the size of the vessel to assign a minimum and maximum number of
cranes.
The processing time bii dynamically changes based on a number of cranes used to
serve the vessel. Hence, the model requires of additional constraints to help it
overcome the increased computational load. The same temporal and spatial
constraints affecting BAP affects BAQCASP. Vessels cannot be moored at a utilized
space.
An important difference with BAP is the fact that multiple quays are not enabled at
BAQCASP, which is the reason why it was chosen to process each berth with their
available cranes via individual BAQCASP. The inclusion of quay cranes adds difficulty
to the model, considering that all vessels/cranes combinations have to satisfy the
physical constraint of the vessel beam and crane reach constraint.
MIT quays follow a traditional construction where quay cranes move along the berth
in a rail designed for that purpose. The constraint of quay cranes unavailability to
transpose with other cranes is adapted in this model with the assumption that once a
vessel is assigned to a quay crane, it is kept fixed until the end of the vessel
processing time.
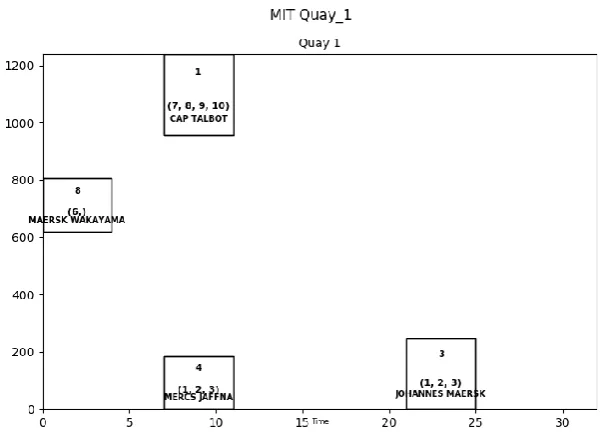
Results for BAQCASP, similar to BAP, are expected as a two-dimensional
temporal/spatial graph with the x axis representing the time from 0 up to the planned
horizon and the y axis representing the length of the berth. The main difference is that
the inclusion of non-overlapping quay cranes so as the name of the vessel is part of
34
Figure 5. BAQCASP solution graph of Berth 1 with 4 vessels and their assigned cranes
3.2.1 Problem formulation
The use of the initial values utilized for BAP will remain unchanged for BAQCASP and
the description of how they were obtained could be reviewed in section 3.1.1.1. From
the BAP input values, those required as input for BAQCASP are the arrival time,
desired departure time, vessel beam, vessel length, desired vessel position, cost of
delay prior berthing, cost of delay from desired departure time and cost of not being
located in the desired position (see Table 4). It should be noted the use of cost of
berth assignment (
caiqi,q
) and the fix processing time (bii) are no longer needed forBAQCASP. This model was created adapted from, A new mixed integer linear model
for the berth allocation and quay crane assignment problem published by Correcher,
Alvare-Valdes and Tamarit (2017)
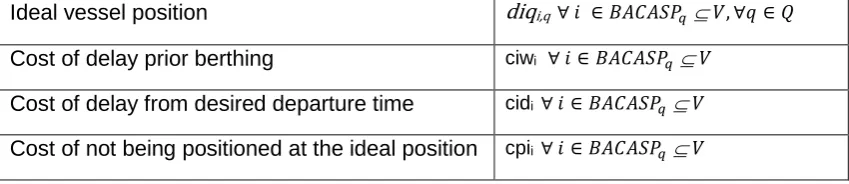
Table 4. BAP input values repeated as input for BAQCASP
Description Notation
Arrival Time aii ∀ 𝑖 ∈ 𝐵𝐴𝐶𝐴𝑆𝑃𝑞 𝑉
Desired departure time sii ∀ 𝑖 ∈ 𝐵𝐴𝐶𝐴𝑆𝑃𝑞 𝑉
Vessel´s Beam bi ∀ 𝑖 ∈ 𝐵𝐴𝐶𝐴𝑆𝑃𝑞 𝑉
35
Ideal vessel position diqi,q ∀ 𝑖 ∈ 𝐵𝐴𝐶𝐴𝑆𝑃𝑞 𝑉, ∀𝑞 ∈ 𝑄
Cost of delay prior berthing ciwi ∀ 𝑖 ∈ 𝐵𝐴𝐶𝐴𝑆𝑃𝑞 𝑉
Cost of delay from desired departure time cidi ∀ 𝑖 ∈ 𝐵𝐴𝐶𝐴𝑆𝑃𝑞 𝑉
Cost of not being positioned at the ideal position cpii ∀ 𝑖 ∈ 𝐵𝐴𝐶𝐴𝑆𝑃𝑞 𝑉
3.2.1.1 BAQCASP additional input elements
Additional to the above mentioned, a set of values is needed for the creation of this
model and this will be described as follows:
Quay cranes
𝑔 ∈ 𝑄𝐺. Set of crane groups elements of Quay Cranes Groups. Obtained from the
terminal description at (Georgia Tech Panama. Logistics and Innovation & Research
Center, 2017). Each existing combination from 1 to 4 consecutive cranes are assigned
to a specific group. i.e. g=1=group of cranes
(10,11) or g=39=group of cranes (8, 9, 10)
ng. ∀ 𝑔 ∈ 𝑄𝐺. Number of cranes in group g. The total number of cranes in group g
fg ∀ 𝑔 ∈ 𝑄𝐺 . Name of the first crane in the group g. i.e. crane 15
zg∀ 𝑔 ∈ 𝑄𝐺. Name of the last crane in the group g.
Vessels
𝑔𝑖𝑚𝑖𝑛, 𝑔
𝑖𝑚𝑎𝑥 ∀𝑖 ∈ 𝑉. Minimum and maximum quantity of quay cranes QC agreed to
serve a specific vessel i. This was created for the sole motivation of this dissertation
as it was not available from the supplied database. The assumption taken for the
assigned values is based on the vessels length which is shown in Table 5.
Table 5. QC assignment based on vessels length
Vessel LOA gmin gmax
Less than 100 m 1 1
100m-150m 1 2
150m-250m 1 3
36
𝑢𝑖𝑔 ∀𝑖 ∈ 𝑉, 𝑔 ∈ 𝑄𝐺: 𝑔 ∈ [𝑔𝑖𝑚𝑖𝑛, 𝑔𝑖𝑚𝑎𝑥] . Estimated processing time of vessel i if using
cranes from g group from where it is feasible. The value is calculated considering the
number of containers to be handled ci and the containers handled per hour of each
feasible combination of cranes that could serve vessel i based on her beam and the
quay cranes reach.
QCq. Total Number of quay cranesat berth q processed in BAQCASPq.
Berths
As every berth is processed separately, the value of each q will be the same as the
berth processed in the respective BAQCASP.
Lq. Length of processed berth q in BAQCASPq.
Time
𝑇 ∈ [0, 𝐻]. Set of time periods from 0 to planning horizon.
3.2.1.2 BAQCASP assumptions
This model will adopt all the assumptions described in section 3.1.1.2 BAP
assumptions, together with some additions created exclusively for the introduction of
quay cranes to the model.
Each berth q has a set of quay cranes QC assigned exclusively for that berth.
All quay cranes can move across the berth without transposing other quay
cranes in service.
Each vessel should be served by the same number of quay cranes for the
whole duration of her processing time.
Assigned cranes change the processing time of vessels based on the per hour
movement of its type.
Cranes can only be assigned with other cranes from the same type (same
movements per hour).
Each quay crane can be assigned at most to one vessel in each time period.
Each available crane combination, feasible with the previous assumptions, will
37
3.2.1.3 BAQCASP Variables, Objective Function and Constraints
With the use of BAP decision variables and binary variables described in section
3.1.1.3, the only change is that the maiqi will not be part of this model and the
introduction of riqtm as a binary variable will be very much needed.
riqtm. ∀ 𝑖 ∈ 𝐵𝐴𝐶𝐴𝑆𝑃𝑞 𝑉, ∀𝑔 ∈ 𝑄𝐺, 𝑡𝑚 ∈ [0, 𝐻]. A value of 1 is assigned if vessel i is
handled with cranes from group g at time tm, 0 otherwise. Note that H stands for
maximum time of the planning horizon.
This step has the final goal of providing with the values of the decision variables that
will position the vessels in optimal combinations that will return the minimum cost of
allocating those vessels in each berth. An objective function for BAQCASP is
generated for each berth following the vessels filtered according to the results of the
BAP. It is necessary to recognize that the constraints are adjusted depending on the
selected vessels for each berth/objective function. The overall minimum cost will then
be calculated as the sum of all the BAQCASP objective functions. Considering the
following, the BAQCASP objective function that has to be replicated for every berth
is:
𝑀𝑖𝑛 [ ∑ (𝑐𝑖𝑤𝑖(𝑡𝑖− 𝑎𝑖𝑖) + 𝑐𝑖𝑑𝑖ℎ𝑖+ 𝑐𝑝𝑖𝑖𝑒𝑖)] 𝑖 ∈𝐵𝐴𝑄𝐶𝐴𝑆𝑃𝑞 𝑉
The model is subject to the following constraints:
Only one time of handling commencement could be assigned to a vessel i.
∑ ∑ 𝑟𝑖𝑔𝑡𝑚= 1 ∀ 𝑖 ∈ 𝐵𝐴𝑄𝐶𝐴𝑆𝑃𝑞 𝑉 𝑔∈𝑄𝐺𝑖
𝐻
𝑡𝑚=𝑎𝑖𝑖
Processing time tiwill be equal to the assigned handling started time.
𝑡𝑖 = ∑ ∑ 𝑟𝑖𝑔𝑡𝑚∗ 𝑡𝑚 ∀ 𝑖 ∈ 𝐵𝐴𝑄𝐶𝐴𝑆𝑃𝑞 𝑉 𝑔∈𝑄𝐺𝑖
𝐻
𝑡𝑚=𝑎𝑖𝑖
To avoid overlapping in time and space of vessels.
𝛿𝑖,𝑗+ 𝛿𝑗,𝑖+ 𝜎𝑖,𝑗+ 𝜎𝑗,𝑖 ≥ 1 ∀ 𝑖, 𝑗 ∈ 𝐵𝐴𝑄𝐶𝐴𝑆𝑃𝑞 𝑉, 𝑖 ≠ 𝑗
o Time overlapping avoidance.
𝑡𝑗− 𝑡𝑖− ∑ ∑ (𝑟𝑖𝑔𝑡𝑚∗ 𝑢𝑖𝑔) − (𝜎𝑖,𝑗− 1)𝐻 ≥ 𝑂 ∀ 𝑖, 𝑗 ∈ 𝐵𝐴𝑄𝐶𝐴𝑆𝑃𝑞 𝑉, 𝑖 ≠ 𝑗 𝑔∈𝑄𝐺𝑖
𝐻
38 o Space overlapping avoidance.
𝑝𝑗− (𝑝𝑖+ 𝑙𝑖) − (𝛿𝑖,𝑗− 1)𝐿𝑞 ≥ 1 ∀ 𝑖, 𝑗 ∈ 𝐵𝐴𝑄𝐶𝐴𝑆𝑃𝑞 𝑉, 𝑖 ≠ 𝑗
The length of vessel i has to be less than the maximum length of the selected
berth.
𝑝𝑖+ 𝑙𝑖 ≤ 𝐿𝑞+ 1 ∀ 𝑖 ∈ 𝐵𝐴𝑄𝐶𝐴𝑆𝑃𝑞 𝑉
Utilized cranes can never be more than total number of available cranes at
any period.
∑ ∑ ∑ 𝑟𝑖𝑔𝜏𝑛𝑔 ≤ 𝑄𝐶𝑞 ∀𝑡𝑚 ∈ 𝑇
𝑡𝑚
𝜏=max (𝑎𝑖𝑖,𝑡𝑚−𝑢𝑖 𝑔
+1) 𝑔∈𝑄𝐺𝑖
∀ 𝑖∈𝐵𝐴𝑄𝐶𝐴𝑆𝑃𝑞 𝑉
In each period tm a crane group g can be assigned at most to one vessel.
∑ ∑ 𝑟𝑖𝑔𝜏 ≤ 1 ∀𝑡𝑚 ∈ 𝑇, ∀𝑔 ∈ 𝑄𝐺
𝑡𝑚
𝜏=max (𝑎𝑖𝑖,𝑡𝑚−𝑢𝑖𝑔+1)
𝑖|𝑔∈𝑄𝐺𝑖
If a vessel is above other vessel in the graphic, the highest vessel should have
at least the number of cranes assigned to the lower vessel.
∑ ∑ 𝑓𝑔𝑟𝑗𝑔𝑡𝑚− ∑ ∑ 𝑧𝑔𝑟𝑖𝑔𝑡𝑚 ≥ 1 − 𝑄𝐶𝑞(𝛿𝑗𝑖+ 𝜎𝑖𝑗+ 𝜎𝑗𝑖) 𝑔∈𝑄𝐺𝑖 𝐻 𝑡𝑚=𝑎𝑖𝑖 𝑔∈𝑄𝐺𝑗 𝐻 𝑡𝑚=𝑎𝑖𝑗 ∀ 𝑖, 𝑗 ∈ 𝐵𝐴𝑄𝐶𝐴𝑆𝑃𝑞 𝑉, 𝑖 ≠ 𝑗
A positive number is given to the delay time if it is later than desired departure
time.
ℎ𝑖 ≥ 𝑡𝑖− 𝑠𝑖𝑖+ ∑ ∑ (𝑟𝑖𝑔𝑡𝑚∗ 𝑢𝑖𝑔) − 1 𝑔∈𝑄𝐺𝑖
𝐻
𝑡𝑚=𝑎𝑖𝑖
∀ 𝑖 ∈ 𝐵𝐴𝑄𝐶𝐴𝑆𝑃𝑞 𝑉
Deviation of vessel i from the desired position at the assigned berth.
o If the vessel i is positioned above of her ideal position (graph
perspective).
𝑒𝑖 ≥ 𝑝𝑖− 𝑑𝑖𝑞𝑖,𝑞 ∀ 𝑖 ∈ 𝐵𝐴𝑄𝐶𝐴𝑆𝑃𝑞 𝑉
o If the vessel i is positioned below of her ideal position (graph
perspective).
𝑒𝑖 ≥ 𝑑𝑖𝑞𝑖,𝑞− 𝑝𝑖 ∀ 𝑖 ∈ 𝐵𝐴𝑄𝐶𝐴𝑆𝑃𝑞 𝑉
Decision variables must all be non-negative.
39
Vessel i should not be moored directly at the borders of the berth.
𝑝𝑖≥ 1
3.2.2 BAQCASP expected solution
This final step will provide the multistep optimization problem with a solution for each
vessel. From the amount of information handled in this problem the values to be used
are: the assigned berth, berth position, berthing time, dynamically created processing
time based on the selected quay cranes, quay cranes assigned, name of assigned
quay cranes group and the finishing time considering the processing time.
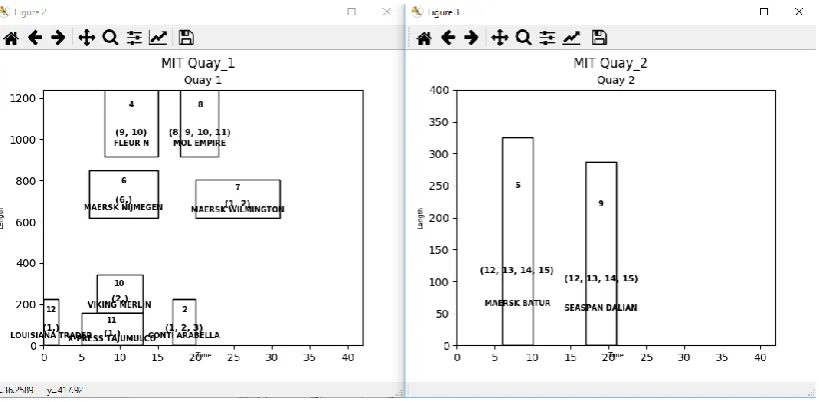
After solving the multistep MILP problem and adding together the minimum cost of
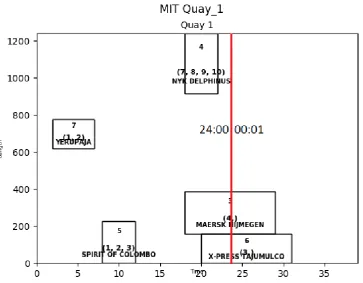
every BAQCASP, the python built code has the capability of creating individual graphs
for each BAQCASP/berths (see Figure 6) and an easy to distribute individual excel
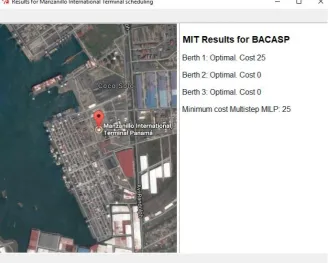
.csv files for each berth (see Figure 7). The final solution is displayed in a dialogue
box with the minimum cost of the optimization problem including a satellite image of
the terminal for easy comparison (see Figure 8). The full python code could be found
in Appendix B.
40
Figure 7. Excel .csv file with BAQCASP values of vessels assigned to Berth 1 at MIT to the 10/05/2016 schedule
Figure 8. Dialogue Box generated by python code with final multistep MILP for MIT 10/05/2016 schedule
The vessels schedule of 10th of May of 2016 used as an example provides with a
scenario where berth 1 has $25 as the assigned cost when the minimum desirable is
$0. This event trigger