Available online on 15.07.2019 at http://jddtonline.info
Journal of Drug Delivery and Therapeutics
Open Access to Pharmaceutical and Medical Research
© 2011-18, publisher and licensee JDDT, This is an Open Access article which permits unrestricted non-commercial use, provided the original work is properly cited
Open Access
Research Article
Bioanalytical Method Development and Validation for Estimation of
Daunorubicin and Cytarabine in Blood Plasma by Using RP-HPLC
Ashish Agrawal*
1, Manoj Sharma
2,
1 Research Scholar, Bhagwant University, Ajmer (Rajesthan), India
2 School of Studies in Pharmaceutical Sciences, Jiwaji University, Gwalior, India
ABSTRACT
A simple, sensitive and selective RP-HPLC method was developed for estimation of Daunorubicin and Cytarabine in combined formulation by isocratically using 20 mM KH 2 PO 4 : acetonitrile (pH 2.5) in the ratio of 20:80 v/v as mobile phase, Prontosil C-18 column (4.6 x 250mm, 5μparticle size) column as stationary phase and chromatogram was recorded at 254nm. The validation studies are carried out and it’s fulfilling ICH requirements. The method is found to be specific, linear, precise (including both intra- and inter- day precision), accurate and robust. This proposed method may represent a valuable aid in the laboratory monitoring of the toxicity of anticancer chemotherapy.
Keywords: RP-HPLC, Leukemia, Daunorubicin and Cytarabine, Linearity and Calibration curve
Article Info:Received 17 May 2019; Review Completed 24 June 2019; Accepted 30 June 2019; Available online 15 July 2019
Cite this article as:
Agrawal A, Sharma M, Bioanalytical Method Development and Validation for Estimation of Daunorubicin and Cytarabine in Blood Plasma by Using RP-HPLC, Journal of Drug Delivery and Therapeutics. 2019; 9(4):366-373 http://dx.doi.org/10.22270/jddt.v9i4.3061
*Address for Correspondence:
Ashish Agrawal, Research Scholar, Bhagwant University, Ajmer (Rajesthan), India
INTRODUCTION:
Leukemia is a malignant disorder of bone marrow and blood, and is the most widespread cancer in children and teenagers. It accounts for about 1/3rd of all cancers in children, acute
myelogenous leukemia (AML) being the most common type. Leukemia therapy relies generally on combination chemotherapy utilizing a number of different anticancer drugs1-20.
Extensive literature survey reveals that very few spectrophotometric and chromatographic methods have been reported. But still no method has been reported for the individual as well as simultaneous estimation of these drugs. So it goes very important to develop a simple, precise, and accurate, analytical method for estimation of Daunorubicin and Cytarabine individual as well as simultaneous in bulk and pharmaceutical dosage and Blood Plasma using RP-HPLC.21-43
MATERIAL & METHODS
Chemicals and ReagentsHPLC grade Acetonitrile, KH 2 PO 4 l and Acetic acid were purchased from Merck, while HPLC grade water was purchased from Qualigens, Mumbai (India). The drugs ATRA and MTX were received as gift samples. Marketed tablet wih
brand name Vyxeos is used for analysis having Daunorubicin – 44mg and Cytarabine – 100mg.
Identification of drugs
The identification as well as Authentification of both the procured drugs was done by melting point and FT-IR spectroscopy. The observed results of melting point are shown in Table 1 and for IR Spectra results shown in tablet 2, 3 and Fig. 1 & 2.
Determination of solubility of both drugs in different solvents.
Solubility of Daunorubicin and Cytarabinewas observed by dissolving them in different solvents and the observed results are shown in Table 4.
RP-HPLC method development for the Simultaneous estimation of both drugs
Selection of Chromatographic Method
Selection of Precipitating Agent
Selection of precipitation agent is based on the solubility of drug and good protein precipitation property. Daunorubicin and Cytarabine soluble in Acetonitrile and having good precipitating property so the Acetonitrile was selected as the protein precipitation and extraction agent
Selection of Mobile Phase
Initially to estimate Daunorubicin and Cytarabine in fix dosage form number of mobile phase in different ratio were tried. A result was shown in Table 5. Taking into consideration the system suitability parameter like RT, Tailing factor, No. of theoretical plates and HETP, the mobile phase found to be most suitable for analysis was 20 mM KH2PO4: acetonitrile (pH 2.5) in the ratio of 20:80 v/v. The
mobile phase was filtered through 0.45 filter paper to remove particulate matter and then degassed by sonication. Flow rate employed for analysis was 1.0 ml/min.
Selection of Diluent
Diluent used for preparation of sample were compatible with mobile phase and no any significant affect retention and resolution of analyte. After various trials Acetonitrile was used as diluents.
Extraction of drug sample
Accurately weighed 10 mg of Daunorubicin was transferred into 50 ml volumetric flasks separately and dissolved in 10 ml of plasma, then volume was made up to 50 ml with acetonitrile and vortex it to get complete precipitation of plasma protein. Stand it aside for few minute, precipitate of protein settled down then collect the supernatant layer and add 10 ml of acetonitrile in precipitate to complete removal of drug. Centrifuge the collected supernatant layer at 6000 rpm for 7 min at 4oC and then filtered by whatmann filter
paper (no.41). Concentration of Daunorubicin in acetonitrile was 200 µg/ml. (stock- A)
Preparation of Sub Stock Solution
5 ml of solution was taken from stock-A of Daunorubicin and transferred into 10 ml volumetric flask separately and diluted up to 10 ml with diluent (Acetonitrile) to give concentration of 100 µg/ml (Stock-B).
Preparation of Different Solution
0.1ml, 0.2ml, 0.3ml, 0.4ml and 0.5ml of stock-B was taken separately in 10 ml volumetric flask and volume was made up to 10ml with (Acetonitrile). This gives the solutions of 1µg/ml, 2µg/ml, 3µg/ml, 4µg/ml, 5µg/ml for drug. In same manner 2µg/ml, 4µg/ml, 6µg/ml, 8µg/ml, 10µg/ml of Cytarabine also prepared.
Linearity and Calibration Graph
To establish the linearity of analytical method, a series of dilution ranging from 5-25 g/ml was prepared. All the solution were filtered through 0.2m membrane filter and injected, chromatograms were recorded at 315 nm and it was repeat for three times. A calibration graph was plotted between the mean peak area and respective concentration and regression equation was derived. Graphs shown in fig 3-6.
System Suitability Parameters
Separation variables were set and mobile phase was allowed to saturate the column at 1.00 ml/min. After complete saturation of column, three replicates of working standard of Daunorubicin 2g/ml and 4g/ml Cytarabine was injected
separately. Peak report and column performance report were recorded for all chromatogram. (Table No. 6)
Laboratory Sample Analysis
The commercial tablet formulation of Daunorubicin is available in the strength of 10 mg. Based on this different standard solutions were prepared for quantitative analysis, which gives satisfactory results. Stock solution was prepared in the same manner. Further dilutions were made to prepare the mixed standard of desired concentration. (Table No. 7)
Method Validation
On the basis of fixed parameters the method of estimation was validated for following parameters.
Linearity
The calibration plot was contracted after analysis of five different (from 1 to 5 µg/ ml) and (2 to 10µg/ ml) concentrations and areas for each concentration were recorded three times, and mean area was calculated. The regression equation and correlation coefficient of curve are given and SD and RSD were calculated and results shows in table 8.
Specificity
Specificity of the method was carried out to assess unequivocally the analyte presence of the components that might be expected to be present, such as impurities, degradation products and matrix components. Results show in figure 7 and 8.
Accuracy
Recovery studies were performed to validate the accuracy of developed method to preanalysed sample solution, a definite concentration of standard drug (80%, 100%, and 120%) was added and then its recovery was analyzed. Results shown in table 9.
Precision
The stock solution was prepared. The precision are established in three differences: (Table No. 10)
1. Repeatability
2. Intermediate precision a) Day to Day
b) Analyst to Analyst 3. Reproducibility
Repeatability
The repeatability was performed for five replicate at five concentrations in linearity range 1, 2, 3, 4 and 5g/ml for Daunorubicin and 2, 4, 6, 8 and 10g/ml Cytarabine for indicates the precision under the same operating condition over short interval time. Results of repeatability are reported in table respectively.
Intermidiate Precision Day To Day Precision
Robustness
As per ICH norms, small, but deliberate variations in concentration of the mobile phase were made to check the method’s capacity to remain unaffected. The ratio of mobile phase was change from, 20mM Phosphate Buffer: acetonitrile (20:80 % v/v), to (15:85 % v/v).Results of robustness are reported in table 11.
Detection Limit and Quantitation Limit
The LOD and LOQ of developed method was calculated based on the standard deviation of response and slope of the linearity curve. (Table No. 12)
Analysis of Injectable formulation
Amount equal to 10 mg of CYTA was taken in 100-ml volumetric flask. This was than dissolve in 13 ml of plasma by sonication for about 10 minutes. The volume is made up
to the mark by mobile phase and filtered by whatmann filter paper (no.41) and the filtrate was used to prepare samples of different concentration. Results of tablet analysis are reported in table no. 13.
RESULS
Identification of drugs by Melting point determination and IR Spectroscopy
Melting point of drugs was determined by using Digital melting point apparatus.
Table 1: Melting Point of Drugs
Drug Name Melting Point Standard Value Cytarabine 211-214°C 212-213°C Daunorubicin 206-210°C 208-209°C
IR Spectra of Daunorubicin
Figure No. 1 FT-IR Spectra of Daunorubicin
Table 2: IR interpretation of Daunorubicin
Group Observed Frequency (cm -1) Standard Range (cm-1)
O–H s at c ring 3324.77 3300-3010
C=O s at b ring 1667.97 1744-1650
NH2 sc 1601.51 1661-1550
IR Spectra of Cytarabine
Figure No.2 FT-IR Spectra of Cytarabine
Table 3: IR interpretation of Cytarabine
Group Observed Frequency (cm -1) Standard Range (cm-1)
NH and OH stretching 3489.47 3300-3500
CH stretching 2917.33 2800-3000
C=O stretching 1577.72 1550-1650
C=N and C=C stretching 1501.27 1500-1400
C-O stretching 1268.41 1220-1300
Determination of solubility of both drugs in different solvents
Solubility of Daunorubicin and Cytarabinewas observed by dissolving them in different solvents and the observed results are shown in Table.
Table 4: Solubility of drugs in different solvents Solvent Daunorubicin Cytarabine Water Sparingly soluble Soluble
Methanol/ Ethanol Soluble Sparingly soluble
Acetonitrile Sparingly soluble Sparingly soluble
Ether sparingly soluble Sparingly soluble
0.1 N HCl Soluble Sparingly soluble
0.1 N NaOH Soluble Sparingly soluble
chloroform Insoluble Sparingly soluble
Selection of Chromatographic Method:
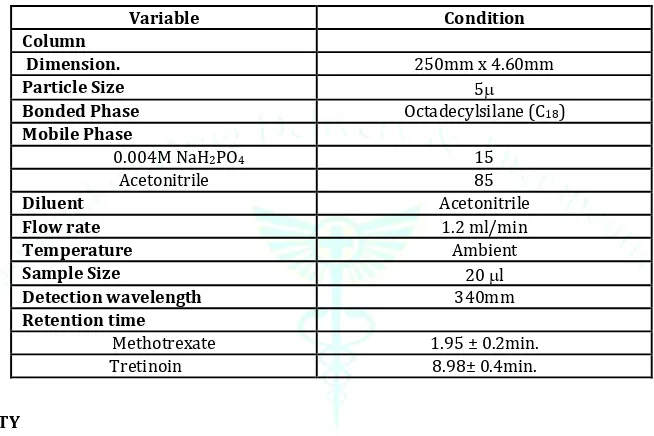
Optimized chromatographic conditions were obtained shown in Table.
Table 5: Optimized chromatographic conditions
Variable Condition
Column
Dimension. 250mm x 4.60mm
Particle Size 5
Bonded Phase Octadecylsilane (C18) Mobile Phase
0.004M NaH2PO4 15
Acetonitrile 85
Diluent Acetonitrile
Flow rate 1.2 ml/min
Temperature Ambient
Sample Size 20 l
Detection wavelength 340mm
Retention time
Methotrexate 1.95 ± 0.2min.
Tretinoin 8.98± 0.4min.
SYSTEM SUITABILITY
The system suitability parameter was carried out to verify that the analytical system was working properly and could give accurate and precise result. The six replicates of reference standard, 5g/ml of Daunorubicin and Cytarabine were injected separately and chromatogram was recorded. The result of system suitability parameter is reported in table.
TABLE 6: Results of System Suitability Parameters
PARAMETERS Daunorubicin Cytarabine No. of Theoretical Plates 3561.833±8.377 3546.667±9.668
Tailing Factor 1.163±0.045 1.195±0.059
Retention time 7.924±0.001 11.185±0.045
Laboratory Sample Analyses
The commercial tablet formulation of Daunorubicin is available in the strength of 10 mg. Based on this different standard solutions were prepared for quantitative analysis, which gives satisfactory results, shows in table.
Table 7: Laboratory Sample Analyses
Standard Number Concentration of DAUN (g/ml)
Concentration of CYTA (g/ml)
1. 1 2
2. 2 4
3. 3 6
4. 4 8
Method Validation Linearity
Different levels of standard solutions were prepared and injected into the HPLC and the chromatogram was recorded. The results of linearity are reported in table.
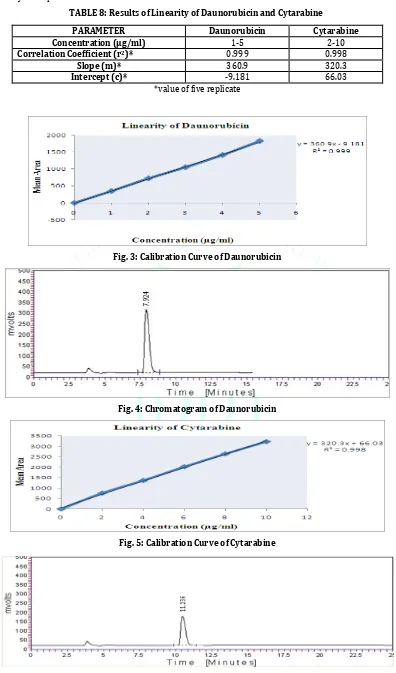
TABLE 8: Results of Linearity of Daunorubicin and Cytarabine
PARAMETER Daunorubicin Cytarabine
Concentration (μg/ml) 1-5 2-10
Correlation Coefficient (r2)* 0.999 0.998
Slope (m)* 360.9 320.3
Intercept (c)* -9.181 66.03
*value of five replicate
Fig. 3: Calibration Curve of Daunorubicin
Fig. 4: Chromatogram of Daunorubicin
Fig. 5: Calibration Curve of Cytarabine
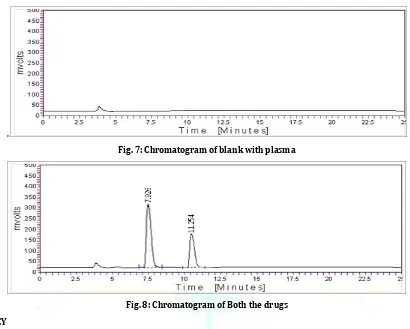
SPECIFICITY
Specificity of the method was determined and the peaks of plasma, diluent, mobile phase and excipient of physical mixture did not interfere with standard peaks of Daunorubicin and Cytarabine.
.
Fig. 7: Chromatogram of blank with plasma
Fig. 8: Chromatogram of Both the drugs ACCURACY
The validity and reliability of proposed methods were assessed by recovery studies. The recovery of added standards (80%, 100% and 120%) was found at three replicate and three concentrations level. The value of % means just close to 100, SD and % RSD are less than 2 indicate the accuracy of method. Result of recovery study shown in table.
TABLE 9: RESULTS OF RECOVERY STUDY
% LEVEL % MEAN±SD*
Daunorubicin Cytarabine
80% 98.96±0.325 99.491±0.402
100% 99.237±0.454 100.472±0.142
120% 98.651±0.916 99.892±0.153
* Value of three replicate and three concentrations.
PRECISION
Precision was determined by repeatability and Intermediate precision of drug. Repeatability result indicates the precision under the same operating condition over short interval time. The intermediate precision study is expressed within laboratory variation on different days and analyst to analyst variation by different analyst. The value of SD and %RSD are less than 2 indicate the precision of method. Result of precision shown in table.
TABLE 10 RESULTS OF PRECISION
PARAMETER % MEAN±SD*
Daunorubicin Cytarabine Repeatability 100.198±0.045 99.778±0.029
Intermediate precision
Day to day precision 99.781 ±0.041 99.862±0.035
ROBUSTNESS
The robustness of developed method was checked by changing in the deliberate variation in solvent. Result of robustness shown in table.
TABLE 11: RESULTS OF ROBUSTNESS
PARAMETER Daunorubicin % MEAN±SD* Cytarabine
Robustness 99.158±1.687 99.844±0.051
* Value of five replicate and five concentrations
LOD AND LOQ
Detection limit and quantitation limit of described method were observed as 0.12g/ml and 0.35 g/ml respectively and quantitation limit 0.36g/ml and 0.95g/ml respectively based on the SD of response and slope, which meet the requirement of new method. Result shown in table.
TABLE 12: LOD and LOQ of DAUN and CYTA
Name LOD (g/ml) LOQ (g/ml)
DAUN 0.12 0.35
CYTA 0.36 0.95
ASSAY OF TABLET FORMULATION
The results of the analysis of Injectable formulation were reported. The assay value of drugs was close to 100, SD and % RSD are less than 2 indicate the no interference of excipient in the estimation of drugs.
TABLE 13: Analysis of Injectable Sample DAUN* CYTA*
Label Claim (mg) 44mg 100mg
% Found (mg) 43.45 99.85
% Assay 98.75 99.85
% RSD 1.365 1.112
*Average of three determination
DISCUSSION:
.A simple, rapid, accurate and precise Bioanalytical Method
Development and Validation for Estimation of Daunorubicin and Cytarabine in Blood Plasma by Using RP-HPLC.The RP-HPLC method was developed for estimation of Daunorubicin and Cytarabine in combined formulation by isocratically using 20 mM KH2PO4: acetonitrile (pH 2.5) in the ratio of
20:80 v/v as mobile phase, Prontosil C-18 column (4.6 x 250mm, 5μparticle size) column as stationary phase and chromatogram was recorded at 254nm. Then developed method was validated by using various parameters. Precision studies were carried out using parameters like repeatability, interday and intraday precision for both drugs. SD, %RSD of RP-HPLC method was under limit which shows that method was precise. For accuracy studied three replicate injections, each of three different test concentrations in the range of 80, 100 and 120% of labeled claim of formulation under study has % recovery. The results for recovery studies showed that results were within acceptable limits, above 99% and below 101%. Robustness studies were carried out using different analyst parameter. Results of robustness showed that no significant change in
Retention time and Area under curve by small variation in method parameter.
System suitability test were carried out as per USP-24 and all suitability parameter of both comes under acceptable limit.
CONCLUSION
In the present research work, a successful attempt was made for bioanalytical method development and validation for the estimation of Daunorubicin and Cytarabine in blood plasma by using RP-HPLCwhich was developed by experimentation based on thorough literature survey and ascertained by statistical parameters of sampling. The simplicity, rapidity, accurate and reproducibility of the proposed methods completely fulfill the objective of the research work of estimation of the drug in blood plasma.
Selection of precipitating was based on solubility of drug in solvent; acetonitrile was selected as the precipitating agent. Liquid chromatographic system from waters comprising of manual injector, waters 515 pump for constant flow and constant pressure delivery and U.V. Vis. Detector connected to data ace software for controlling the instrumentation as well as processing the data generated was used. Drug sample was extracted by precipitating method using 5ml of methanol for each ml of plasma sample. The proposed methods were found to be linear with correlation coefficient close to one. Precision was determined by repeatability, Intermediate precision and reproducibility of the drugs. The robustness of developed method was checked by changing in the deliberate variation in solvent.
The result obtained shows the developed methods to be Cost effective, Rapid (Short retention time), Simple, Accurate (the value of SD and %RSD less than 2), Precise and can be successfully employed in the routine analysis of these drugs in bulk drug as well as in tablet dosage form. The Simplicity, Rapidly and Reproducibility of the proposed method completely fulfill the objective of this research work.
REFERNCES
1. Skoog, D. A., West, D. M., and Holler, J. F.,Eds., In; Analytical Chemistry- An Introduction, 6 th Edn., Saunders college Publishing, 1994, 1,724-726.
2. Ewing, G. W., Eds., Liquid Chromatography;In; Instrumental Methods of Chemical Analysis, 2nd Edn., McGraw Hill Book company,Inc,New York, 1960, 2-3, 377-380.
3. Corners, K. A., Eds., In; A Text Book of Pharmaceutical Analysis, 3rd Edn., JohnWiley and Sons, NJ, 2002,581,620-622. 4. Sharma, M., Edt., Sharma, B.K., Spectroscopy; In; Instrumental
Methods of Chemical Analysis, 18th Edn., Goel Publishing Housing, Meerut, 1999, 1-77.
5. Snyder, L. R., Kirklad, J. J., Glajch, L. J., and Limbird, L. E. Practical HPLC Method Development, John Willey and Sons, Inc, New York, 2nd end., 1997, 1,3,5-17, 77-95,110,119, 233-291, 631.
6. Sherman, R.E., Edt., Rhodes, L.J., Analytical Instrumentation; Practical Guides for Measurement and Control, Instrument Society of America.1996, 647-648.
7. Scott, R. P.W.,Eds., In; Liquid Chromatography for thr Analyst, Vol.67, Marcel Dekker,Inc., New York, 1994, 1,4,1140-1153,1172-1198.
8. Gennaro,A.R.,Edt., Karen, B.M., and Medwick,T., Remington ;The Science and Practice of Pharmacy, Mach Publishing Company, Pennsylvania, 19th edn., 1995,vol-1,437-490.
9. Verma, R.M.,Importance, Application, Nature, Growth and scope of Analytical chemistry; Analytical chemistry Theory and practice, CBS Publishers and Distribution, New Delhi, 3rd edn.,1994,3-12.
11. Sharaf, M.A., Assessment of Chromatographic Peak Purity; In Advances in Chromatography, Market Dekker, Inc, New York, 1997, Vol- 37, 1-6.
12. Sadek, P.C., Troubleshootings HPLC Systems;In A Bench manual, John Wiley and Sons, Linc, New York, 2000,109-190. 13. Troubleshootings, Cause and solution, www.hplcsystems.com. 14. A fitness for Purpose of Analytical method; a laboratory Guide
to method validation and Related Topics, Eurachem, 1998. 15. Code Q2A-Text on validation of analytical procedure Step-3
Consensus Guideline, 1994, ICH Harmonised Tripartite Guideline.
16. Code Q2B- validation of analytical procedure Methodology Step-4 Consensus Guideline, 1994, ICH Harmonised Tripartite Guideline.
17. Validation of Analytical Procedure- Definition and Terminology, FDA Center for Veterinary Medicine Guidance Document. 63, 1999.
18. Guideline for industry, Analytical Procedure and method validation, FDA, 49Aug, 2000.
19. Singh, S. and Garg. S., Understanding; Analytical Method Validation, Pharma Times, Aug, 1999, 15-20.
20. Huber, L., Validation of Analytical Methods; Review and Strategy, LC-GC International Feb, 1998, 99-105.
21. https://en.wikipedia.org/wiki/Bioanalysis
22. Committee for Medicinal Products for Human Use, Guideline on Validation of Bioanalytical Methods, EMEA, London, 2010. 23. Bruce P, Minkkinen P, Riekkola ML. Mikrochim Acta 1998; 128:
93- 106.
24. Hartmann C, Smeyers-Verbeke J, Massart DL, McDowall RD. J Pharm Biomed Anal 1998; 17: 193-218.
25. Shah VP, Midha KK, Dighe S, McGilveray JI, Skelly PJ, Yacobi A, Layloff T, Viswanathan CT, Cook EC, Mcdowall RD, Pittman AK, Spector S. J Pharm Sci 1992; 81: 309-312.
26. Wieling J, Hendriks G, Tamminga WJ, Hempenius J, Mensink CK, Oosterhuis B, Jonkman JHG. J Chromatogr A 1996; 730: 381-394.
27. Causon R. J Chromatogr B 1997; 689: 175-180.
28. Lindner W, Wainer IW. Requirements for initial assay validation and publication in J. Chromatography B. J Chromatogr B Biomed Sci Appl. 1998; 707: 1-2.
29. Miller KJ, Bowsher RR, Celniker A, Gibbons J, Gupta S, Lee JW, et al. Workshop on bioanalytical methods validation for macromolecules: summary report. Pharm Res. 2001; 18: 1373-1383.
30. Kringle R, Hoffman D. Stability methods for assessing stability of compounds in whole blood for clinical bioanalysis. Drug Info J. 2001; 35: 1261–1270.
31. Thompson M, Ellison SLR, Wood R. Harmonized Guidelines for Single Laboratory Validation of Method of Analysis. Pure Appl Chem. 2008; 74: 835–855.
32. Wood R. How to Validate Analytical Methods. Trends Analyt Chem. 2005; 18: 624–632.
33. McDowall RD. The Role of Laboratory Information Management Systems LIMS in Analytical Method Validation. Anal. Chim. Acta. 2007; 54: 149–158.
34. Vander Heyden Y, Nijhuis A, Smeyers-Verbeke J, Vandeginste BG, Massart DL. Guidance for robustness/ruggedness tests in method validation. J Pharm Biomed Anal. 2001; 24: 723-753. 35. Puluido A, Ruusanches I, Boque R, Rius FX. Uncertainty of
results in routine Qualitative Analysis in Analytical Chemistry. J Pharm Biomed Anal. 2005; 22: 647–654.
36. Sima Mozafari, Nahid Einollahi, Elham Shahgholi, Safoura Vardasbi, Abolfazl Golestani. Thiopurine S-Methyltransferase Assay by HPLC in Acute Lymphoblastic Leukemia Patients and a Healthy Iranian Population. Acta Medica Iranica. 2018; 56(5):301-307.
37. Yahdiana Harahap, Nurul Azizah, Rizka Andalusia, Supandi. Simultaneous Analytical Method Development of 6-Mercapto-purine and 6-Methylmercapto6-Mercapto-purine in Plasma by High Performance Liquid Chromatography-Photodiode Array. J Young Pharm. 2017; 9(1): 29-34.
38. Supandi, Yahdiana Harahap, Harmita, Rizka Andalusia, Marlina Ika, Nurul Azizah. Simultaneous Analytical Method of 6-Mercaptopurine and 6-Methylmercaptopurine In-vitro Study with Bio-Sampling Venipuncture and Dried Blood Spot. Journal of Global Pharma Technology. 2017; 5(9):77-84. 39. B.M. Oliveira, A.J. Romanha, T.M.A. Alves, M.B. Viana and C.L.
Zani. An improved HPLC method for the quantitation of 6-mercaptopurine and its metabolites in red blood cells. Braz J Med Biol Res.2004; 37(5): 649-658.
40. Thierry Dervieux, Yaqin Chu, Yi Su, Ching-Hon Pui, William E. Evans, and Mary V. Relling. HPLC Determination of Thiopurine Nucleosides and Nucleotides in Vivo in Lymphoblasts following Mercaptopurine Therapy. Clinical Chemistry. 2002; 48(1):61–68.
41. Tang J, Zhou S, Huang L, Huang Y, Zhang H. Determination of azathiopurine and 6-mercaptopurine in serum by reversed phase high performance liquid chromatography. 1998; 16(6):513-515.
42. Ashish Agrawal, Manoj Sharma. RP-HPLC Estimation of Methotrexate and Tretinoin in bulk and pharmaceutical dosage forms. Journal of Drug Discovery and Therapeutics. 2017; 5 (3): 09-20.