ISSN: 2149-214X
www.jeseh.net
Does Hands-on Science Practices Make
an Impact on Achievement in Science? A
Meta-Analysis
Serdar Caglak
Eskisehir Osmangazi University
To cite this article:
Caglak, S. (2017). Does hands-on science practices make an ımpact on achievement in
science? A meta-analysis.
Journal of Education in Science, Environment and Health
(JESEH), 3
(1), 69-87.
This article may be used for research, teaching, and private study purposes.
Any substantial or systematic reproduction, redistribution, reselling, loan, sub-licensing,
systematic supply, or distribution in any form to anyone is expressly forbidden.
Authors alone are responsible for the contents of their articles. The journal owns the
copyright of the articles.
Does Hands-on Science Practices Make an Impact on Achievement in
Science? A Meta-Analysis
Serdar Caglak
Article Info
Abstract
Article History
Received: 08 August 2016
This study aimed to investigate to what extent the use of hands-on science activities influences on students‟ academic achievement in science. Review of literature revealed several research studies focusing upon such aim and thus, a meta-analysis of these researches was carried out to obtain an overall effect size estimate of hands-on science activities on science achievement. Of the available studies, 15 with multiple outcomes satisfied the pre-determined inclusion criteria. In addition to the estimation of overall effect size using fixed- and random-effects models, subgroup analyses were also run through a mixed-effect model to determine whether heterogeneity in effect size estimates is due to the influence of moderator variables. Results showed that the estimated effect size was statistically significant (Z=8.57, p < .01). The magnitude of the overall effect size estimate indicated that the hands-on activities had a very large impact on students‟ science achievement (Hedge`s g = 1.55, 95% CI= [1.20-1.91]). The effect size estimates for each moderator variable was also statistically significant at alpha level of .01, but no difference was found within sub-categories of moderator variables.
Accepted: 21 November 2016
Keywords
Hands-on science Meta-analysis Effect size
Science achievement Random-effects model Mixed-effects model
Introduction
High quality science education is very important for nations to shape their future in accordance with the current global trend and development in science and technology (Kalender & Berberoglu, 2009). Many nations therefore desire individuals with high proficiency levels in science disciplines to cultivate scientifically literate citizens in order to accomplish their national goals, such as having advanced industrial technology and high heels in the global economy (Dillon, 2009). Reform documents in many countries emphasize the importance of facilitating students‟ learning in science and developing scientifically literate citizens (American Association for the Advancement of Science [AAAS], 1994; Ministry of National Education of Turkey [MoNET], 2006, 2013; National Research Council [NRC], 2012).
Those reform documents and attempts also put emphasize on the students in various level to be active learners and problem solvers though learning by doing in order to achieve the goals of scientific literacy desired for all citizens. In order to investigate and understand real-life phenomena and develop scientific skills and attitudes, science classes should be enhanced with experimental procedures and scientific reasoning (AAAS, 1994). However, traditional classes could not be seen as to promote to this aim. Alternative or complimentary ways are needed. In this regard, hands-on activities in science classes could be complimentary to the direct instruction to encourage students participate in active learning settings in order to achieve the aim of scientific literacy. Hands-on activities particularly present an avenue for facilitating and richening students‟ success and attainments in science. It allows students to be more active and engaged in science classrooms. As a result, hands-on is appeared as the key component of science education to promote students‟ interest in science, conceptual understanding, and scientific literacy.
Hands-on can be defined as “educational experience that actively involves people in manipulating objects to gain knowledge or understanding” (Haury & Rillere, 1994, p.11). It encompasses learning by experiences and
Students are expected to gain deep understanding of subject matters and be able to do science through those activities. When students are able to work subject materials and manipulate some variables in hands-on activities, they would be able to carry out their own scientific investigations so that science concepts become less abstract and students can have the opportunity for getting deeper understanding along with more open-ended questions. Students‟ involvement through hands-on activities contribute to develop their discovery, critical thinking, and problem solving skills because students have to rely on the data and evidence obtained from their own investigations (Flick, 1993).
Researchers have acknowledged that hands-on approach is an important specific instructional strategy which aims at engaging students in teaching practices to facilitate students‟ active learning process (Flick, 1993; Haury, & Rillero, 1994). Within this context, many studies have been conducted to examine the effectiveness of hands-on strategy on students‟ achievement in science (Ates & Eryılmaz, 2011; Bigler & Hanegan, 2011; Costu, Unal, & Ayas, 2007; Ekmekci & Gulacar, 2015; Gaitano & Bogner, 2011; Glasson, 1989; Randler & Hulde, 2007). The results of these studies have revealed that in general hands-on activities increased student‟s science achievement levels. For example, a report on science achievement of elementary students in the United States indicated that “students whose teachers reported that their students do hands-on projects every day or almost every day scored higher on average than students whose teachers reported students did hands-on projects in class less frequently” (NCES, 2011, p.10). On the other hand, results from a recent meta-analysis on control-of-variables strategy (CVS) revealed that the utilizing of the CVS had not significantly different compared to studies that did not use hands-on training (Schwichow, Croker, Zimmerman, Höffler, & Härtig, 2015). In an intervention research conducted by the same research team (Schwichow, Zimmerman, Croker, & Härtig (2016), it was found that hands-on tasks did not differ significantly eight grade students‟ achievement compared to paper-and-pencil training tasks.
Many research have also been conducted to explore the impact of hands-on activities on other outcome variables including attitude (Bilgin, 2006; Koc, & Boyuk, 2012; Sadi & Cakiroglu, 2011), interest (e. g., Holstermann, Grube, & Bogeholz, 2010; Randler & Hulde, 2007; Paris, Yambor, & Packard, 1998), and science process skills (Bilgin, 2006). Results of these studies briefly revealed that the use of hands-on activities in science instruction is an effective way of promoting students‟ attitudes towards science including both cognitive and affective skills. Additionally, findings from the literature also showed that the use of hands-on activities is a useful and an enjoyable way to teach and learn science compared with traditional or teacher-centered learning activities while mastering the science coursework. Hands-on science activities were observed to associate with students‟ interest (Bulunuz, 2012; Holstermann et al., 2010). What is missing in science education literature, however, is the systematic review of studies investigating to what extend hands-on activities improves students‟ academic achievement. Although a large body of studies on hands-on has been conducted in the science education literature, no meta-analysis study exists which examines the overall effectiveness of hands-on activities in developing achievement in science. Available studies mainly focus on the effects of hands-on activities on a science achievement, but individual research of testing the impacts of hands-on using is less concerned without an overall conclusion drawn from a meta-analysis. In this regard, the present study is designed to fill out this gap in the literature by compiling studies and analyzing them to draw an overall conclusion on effectiveness of hands-on activities on academic achievement. Generally speaking, the main purpose of a systematic review is to answer a defined research question using all kind of empirical evidences collected and summarized from studies which satisfy pre-determined inclusion criteria (Borenstein & Higgins, 2009). A meta-analysis is therefore actually a general name of all statistical procedures or methods used to combine and summarize those findings from all available studies in a way that an overall conclusion can be drawn about the effectiveness of an intervention or an experiment (Higgings & Greens, 2008). In this study, the outcome measure is the science achievement of students, but the effectiveness of hands-on science instruction is considered as the treatment or the intervention. Hence, a meta-analysis of research on hands-on activities in Turkish literature becomes the central focus of this study. Even though many studies exist in the literature which investigates the effectiveness of different instructional strategies, the number of studies focusing on the use of hands-on activities and conducted in Turkey is very limited. Within this limitation, this study was conducted to examine to what extent hands-on science instruction is effective and how it influences students‟ science achievement in Turkey. Hence, findings from this meta-analysis study may be interesting for teachers, researchers, and educational policy makers.
Method
Meta-analysis is known as a statistical technique used to determine a common statistical measure - typically an effect size measure - in order to draw an overall conclusion about the effectiveness of an intervention, a treatment, or an experiment (Borenstein et al., 2009; Glass, 1976). Fixed-effects and random-effects models are commonly used in meta-analysis research to obtain a summary effect. In this study, both statistical models were considered, but the most appropriate model was applied to data. Further analyses were conducted using mixed-effects modeling to examine whether the overall effect size estimates show any statistical difference within- and between-levels of study-level (moderator) variables, such as treatment time, grade levels, and so forth. In other words, a mixed-effects model can be used to determine if there is any influence of moderator variables on the heterogeneity in the effect size estimates by taking the all levels of the moderator variables into consideration at once (Viechtbauer, 2010). The R 3.2.3 (R Core Team, 2015) software and a package called metaphor 1.9-8 (Viechtbauer, 2015) were used for all meta-analytic procedures and further statistical analyses in this study.
Acquisition of Studies
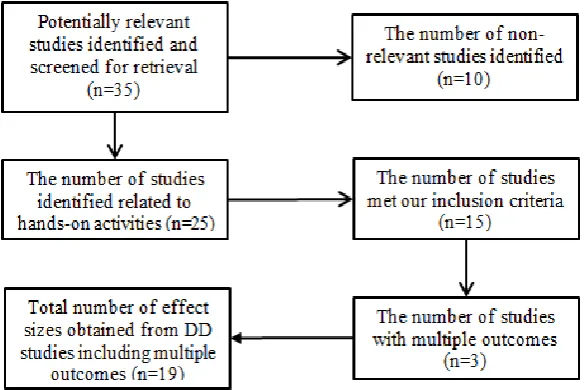
Despite the fact that a great amount of research exists in the literature focusing on the effects of different instructional strategies, the number of the experimental studies which used hands-on activities as intervention to teach science has been limited. Even though two studies are enough to conduct a meta-analysis, this quantity may yield a bias estimation of the population effect size (Valentine et al., 2010). Of the available research, a total of 15 studies were found to satisfy the pre-determined inclusion criteria. Three studies included more than one treatment outcomes (e.g. effect size). Thus, a total of 19 individual effect size estimates were considered for computation and used in this meta-analysis.
Inclusion Criteria
Since the literature reveals large amount of research studies, the inclusion criteria below were determined to eliminate the non-relevant studies to be more focused upon. To be included in the meta-analysis, a study must
be an experimental study
include treatment and control groups with pre/post-tests or post-tests only design assign students randomly to the treatment and control groups
assess students` achievement (or success, performance, etc.) regarding sub-disciplines of science (e.g., biology, chemistry, and physics)
manipulate hands-on activities as an intervention or a treatment must provide adequate statistical outcomes for effect size computation be undertaken with Turkish students between the years of 2000 and 2015
Considering the criteria above, reliable databases such as Web of Science, ERIC, ULAKBIM and National Thesis Archive of the Council of Higher Education of Turkey were firstly selected and they were carefully scanned in March 2015 using the keywords of “hands-on”, “hands-on activities”, hands-on science” “hands-on science teaching and learning”, “hands-on science instruction”, and “learning science with hands-on activities”. A comprehensive review of the literature in these databases resulted in a total of 25 studies. Since full-text of three studies could not be accessed in the search, these studies were obtained via direct communication to the corresponding authors. Close examination of the studies revealed that 10 were not in line with the pre-determined criteria, and thus excluded for the analysis. The total number of the studies used in the meta-analysis was reduced to 15. A flow chart is presented below to indicate how the inclusion process was carried out.
Coding Procedure
Figure 1. A flow chart for the selection of studies Demographics and Methods of the Selected Study
In this part of the coding process, some of the important information about the selected studies was recorded such as the number of authors, name(s) of the author(s), title of the study, publication year, the location where the study took place, and also the identification numbers given to the studies.
Subjects
The characteristics and demographics of the samples used in the experiments and treatments may show differences. Since number of the studies on the selected theme was limited in the context of Turkey, the subjects of the selected studies could vary in terms of level and grade (e.g., 6th, 7th, 10th grade etc). Therefore, the effect size estimates must be evaluated based on those differences introduced by the moderator variables. In this part of the coding process, the demographic information about the participants and schools were reported such as grade levels, school type and location, and geographical region.
Sampling
This section provided information about the samples, sampling procedures, and the way used to assign the participants to the experiment and the control groups. In addition, even though external validity referring to generalizability of the findings in the experimental studies are limited and sometimes meaningless, the population of interest in each of the selected studies was also reported to better identify what grade or school level was the target group of interest.
Methodology
The selected studies were categorized based on their type of research (i.e., dissertation, journal article, etc.). In addition, some information, such as reliability and validity, was also obtained based on whether an instrument used to measure the outcome variable of interest, psychometric properties of that instrument if provided.
Treatment Time and Statistical Outcomes
Subject Area
Science is a very broad name used for several subject areas at different grade levels. Therefore, those subject areas and grade levels of interest in this study would be an important factor to be examined in order to discuss the potential reason why the hands-on activities took place on a specific subject area at most. In addition, the variation in different subject areas may also contribute to the heterogeneity in the effect size estimates across studies. However, science subjects are taught in an integrated science curriculum for the elementary and middle school students in Turkey. Therefore, instead of specifying the subject areas separately, such as biology chemistry, and physics, we classified them as elementary school science, middle school science, and so on to use them in the moderator analysis.
Dependent Variable
In this study, the dependent variable of interest was the students‟ academic achievement, which could be expressed as success, performance, and learning outcomes interchangeably in different contexts. Researchers generally preferred using achievement tests to assess the academic achievement in their studies. Some of them developed their own instruments to measure students‟ proficiencies on the selected subject area of interests. Test scores obtained from those measurements were typically reported and also compared for both treatment and control groups to evaluate the effectiveness of the experiment or intervention in those studies.
Independent Categorical Variables
As mentioned earlier, the characteristics of the selected studies were taken into account by several variables identified by the researchers during the coding procedure. Therefore, the authors believed that those participants and experiment related variables might have contributed to the variation in the outcome measures. Eventually, the magnitude of heterogeneity in effect size estimates across studies might have occurred due to the variation in the sample and design characteristics of the experiments taken place in those selected studies. Hence, the potential effects of the independent categorical or moderator variables on the overall effect size estimate were investigated in this study.
Data Analysis
The first stage in a meta-analysis is to estimate the mean effect size and its variance, and also to determine if there is any significant variation in effect size estimates across studies (Pigott, 2012). When the mean effect size estimate is obtained through the fixed-effects model, it is assumed that the studies share a common true effect size, but the differences in effect size estimates are only due to the sampling error. However, the central focus of random-effects model is that it examines the variation in effect size estimates based on the differences across studies. Researchers therefore have a tendency to use the random-effects model since there are multiple sources which may contribute not only to the sampling error, but also to the differences across studies. In other words, studies typically show differences in terms of their methods and/or the characteristics of the samples which potentially affect the heterogeneity among studies (Viechtbauer, 2010). However, statistical evidences are always required to reach this conclusion in order to support such claims.
Restricted Maximum Likelihood (RML) was specified as the between-studies heterogeneity 2
( ) estimator since it is approximately unbiased and quite efficient among the other estimation methods (Viechtbauer, 2005). The statistical significance of the heterogeneity can be determined using the Q-statistic, but it does not provide accurate information about the extent of true heterogeneity since its statistical power depends mainly on the number of the studies. Thus, in addition to the Q-statistic, differentstatistical indices (I2 and H2) were also utilized in this study to assess the total amount of heterogeneity. The I2 index was proposed by Higgins and Thompson (2002) to better quantify the true heterogeneity from a collection of effect size measures by comparing the Q-value with its expected value (its degrees of freedom) by which the homogeneity is assumed across effect size measures. The I2 is interpreted as a percentage of heterogeneity, that is, 25% indicates a low, 50% represents a moderate, and 75% poses a high heterogeneity across effect size estimates (Huedo-Medina et al., 2006). In addition, H2, also known as Birge‟s ratio (Birge, 1932), was proposed by Higgins and Thompson
Results
Our data analysis showed that there was a great amount of heterogeneity in the observed effect size estimates obtained from the selected studies [Q (18) = 175.12, p < .01]. In addition,the I2 value also shows that 90.45% of the total variability was due to the total heterogeneity across effect size measures. Moreover, the H2 value showed that the total variability was approximately 10 times larger than the sampling variability in the effect size measures. Several plots of influence diagnostics were also used (a) to verify that observed effect size measures were heterogeneous, (b) to determine if there was any outlier in the data, (c) to detect if the non-normality concern exists, (d) to check whether the model-data fit was adequate, (e) and to investigate whether publication bias exists (Wang and Bushman, 1998).
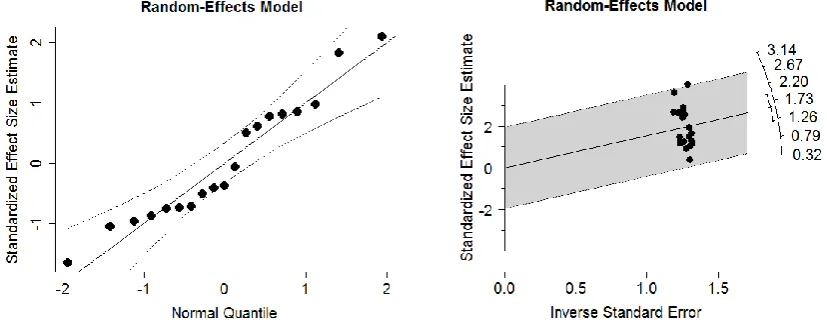
Figure 2. Normal Q-Q and radial (galbraith) plots
Quantile-by-quantile (Q-Q) plots with 95% confidence bands can be useful in meta-analyses to check various aspects and assumptions of the data by plotting the sample quantiles or percentiles of observed effect size measures versus theoretical or predicted quantiles. It is assumed that both measures come from Gaussian distribution, and thus, the quantiles of both the sample and predicted values are supposed to be linearly laid on a 45 degree line on the coordinate axes and which is considered as an indication of normality of the data. Deviations from the 95% confidence bands indicates that the residual heterogeneity in the true effects is non-normally distributed, which means that the observed data do not come from a single normal population. However, the Q-Q plot of the meta-analytic data used in this study did not violate the normality assumption as seen on the left hand side in Figure 2. In addition, the radial (Galbraith) plot (on the right hand side) also showed that the total sample size in each individual study was similar to each other, but the heterogeneity in the effect size estimates across studies was present as also indicated with several statistical indices. One of the effect size estimates seemed to be an outlier in the meta-analytic data since the standardized estimate overlapped with the upper level confidence interval band as seen in Figure 2. Several diagnostic procedures (e.g., DFBETAs, Cook‟s Distance, Covariance Ratios, etc.) were adopted from Viechtbauer and Cheung (2010) to detect the potential outliers in the data. Statistical findings from those diagnostic procedures indicated that no significant outliers were detected as seen in Figure 3, and thus, the statistical analysis was completed using the initial data obtained from the studies which met the inclusion criteria.
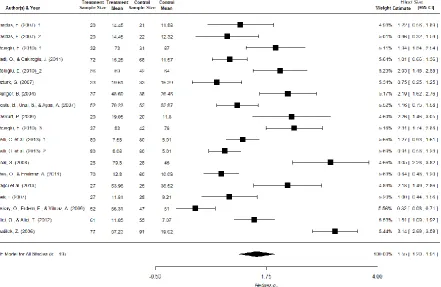
Computation of Overall Effect Size
Figure 3. Diagnostics for the outlier detection
classification, its magnitude is very large (Hedge`s g = 1.55, 95% CI = [1.20-1.91]). In other words, the magnitude of the true effect is very large, referring that the use of hands-on activities in science teaching has a very large impact on students‟ academic achievement.
Subgroup Meta-Analysis and Comparison of Effect Size Estimates
Even though an individual effect size estimate is obtained from a single study, the weighted mean effect size is obtained from an array of studies in a meta-analysis (Borenstein & Higgins, 2013). The individual effect size estimates however may show similarities based on the common characteristics of subject or/and studies which eventually affect the effect size estimates. Therefore, subgroup analysis is an important part of the meta-analytic process to examine whether an intervention is differentiated by each level of the subgroups. One can also statistically compare the mean effect size estimates from the studies that used one variant of the intervention and the other studies that used another variant via mixed-effects modeling approach.
As aforementioned, a great amount of the heterogeneity exists in the individual effect size estimates obtained from the selected studies. Thus, several study-level variables were used to classify the studies in different subgroups in order to explore whether the mean effect size estimates show statistically significant differences across subgroups. Those subgroups were treated as moderators and created based on the study-level variables such as study type, school level, treatment time, geographical region, treatment location and grade level. In total, six different characteristics of the studies were considered for the subgroup meta-analysis. Either the fixed-effects model or the random-fixed-effects model was implemented based on the degree of the heterogeneity exists within subgroups to estimate the mean effect size and its variance for each subgroup. Then, the mean effect sizes were statistically compared through the mixed-effects analyses. Effect size estimates (see Table 3) and forest plots (see Figures 6-11) associated with each of the subgroup analyses were given in Appendix A.
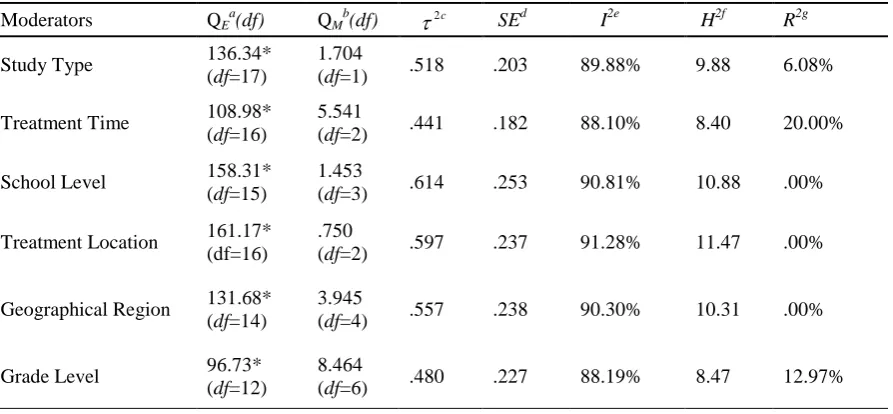
Table 1 shows some of the outputs from the mixed-effects analysis. The mean effect size estimates were estimated for each of the subgroups. The within-groups heterogeneities (QE) were statistically significant across
all of the moderators; the between-groups heterogeneities (QM) were not significant at alpha level .05. This
omnibus tests indicated that the effect size estimate for each level of the moderator variables were not statistically different from each other. I2 and H2 indices also showed that the amount of the heterogeneity across effect size estimates for each moderator variables were quite large. However, the amount of the heterogeneity accounted for by the each level of the moderator variables was not large enough to be statistically significant at alpha level of .05. Except for the treatment time and grade level, the other moderator variables in the model did not explain significant amount of variation in the effect size heterogeneity. These results refer that the differences in the study type, school levels, treatment location, and the geographical region where the experiments or intervention took place are not good predictors of the heterogeneity in the effect size estimates.
Table 1. Moderator analyses through mixed-effects modeling
Moderators QEa(df) QMb(df)
2c SEd I2e H2f R2gStudy Type 136.34*
(df=17)
1.704
(df=1) .518 .203 89.88% 9.88 6.08%
Treatment Time 108.98* (df=16)
5.541
(df=2) .441 .182 88.10% 8.40 20.00%
School Level 158.31*
(df=15)
1.453
(df=3) .614 .253 90.81% 10.88 .00%
Treatment Location 161.17* (df=16)
.750
(df=2) .597 .237 91.28% 11.47 .00%
Geographical Region 131.68* (df=14)
3.945
(df=4) .557 .238 90.30% 10.31 .00%
Grade Level 96.73*
(df=12)
8.464
(df=6) .480 .227 88.19% 8.47 12.97%
*.Estimate is significant at alpha level .05. a
. Test for residual heterogeneity. b
. Overall omnibus test for moderators. c
. Estimated amount of residual heterogeneity. d
. Standard error for QE.
e
. Residual heterogeneity/accounted variability. f
. Unaccounted variability/sampling variability. g
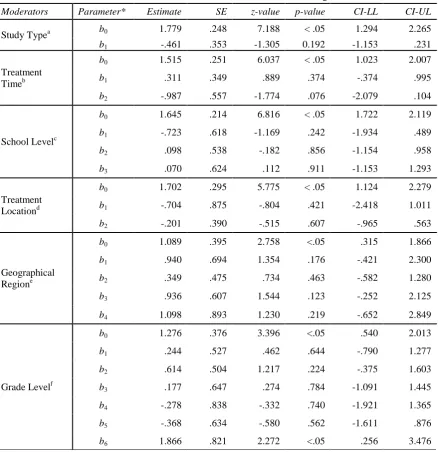
Even though the mean effect size estimates for the reference groups were statistically significant, the difference between the reference groups and the other groups of interests in each moderator variable were not statistically significant (see Table 2). 95% of CI estimates for the slope parameters captured the zero point and indicating that those estimates were not also statistically significant. The mean effect size estimates obtained from the dissertation and journal articles, for example, did not show statistical difference from each other since the estimate of the slope parameter (b1) was between -1.153 and .231. However, the mean effect size estimate obtained from the studies conducted in college or university showed some statistical difference from the other school levels since the associated slope parameter was statistically significant.
Table 2. Parameter estimates in mixed-effects modeling
Moderators Parameter* Estimate SE z-value p-value CI-LL CI-UL
Study Typea b0 1.779 .248 7.188 < .05 1.294 2.265
b1 -.461 .353 -1.305 0.192 -1.153 .231
Treatment Timeb
b0 1.515 .251 6.037 < .05 1.023 2.007
b1 .311 .349 .889 .374 -.374 .995
b2 -.987 .557 -1.774 .076 -2.079 .104
School Levelc
b0 1.645 .214 6.816 < .05 1.722 2.119
b1 -.723 .618 -1.169 .242 -1.934 .489
b2 .098 .538 -.182 .856 -1.154 .958
b3 .070 .624 .112 .911 -1.153 1.293
Treatment Locationd
b0 1.702 .295 5.775 < .05 1.124 2.279
b1 -.704 .875 -.804 .421 -2.418 1.011
b2 -.201 .390 -.515 .607 -.965 .563
Geographical Regione
b0 1.089 .395 2.758 <.05 .315 1.866
b1 .940 .694 1.354 .176 -.421 2.300
b2 .349 .475 .734 .463 -.582 1.280
b3 .936 .607 1.544 .123 -.252 2.125
b4 1.098 .893 1.230 .219 -.652 2.849
Grade Levelf
b0 1.276 .376 3.396 <.05 .540 2.013
b1 .244 .527 .462 .644 -.790 1.277
b2 .614 .504 1.217 .224 -.375 1.603
b3 .177 .647 .274 .784 -1.091 1.445
b4 -.278 .838 -.332 .740 -1.921 1.365
b5 -.368 .634 -.580 .562 -1.611 .876
b6 1.866 .821 2.272 <.05 .256 3.476
*.b0 is defined as the model intercept which indicates the mean effect size estimate for the reference group. bk (k = 1, 2, …, 6) is the
slope parameter for the other levels of moderator variables, which indicates the difference in the mean effect size estimate between the reference group and the other levels of the moderator variables. See, Table 3 in Appendix A for the levels of the each moderator variables.
a
. In study type, journal is specified as the reference group and the dissertation is the other level of the study type variable. b
. Studies with less than 30 days treatment time is the reference group. c
. Elementary school level is specified as the reference group. d
. Studies conducted in rural areas are classified in the reference group. e
Publication Bias
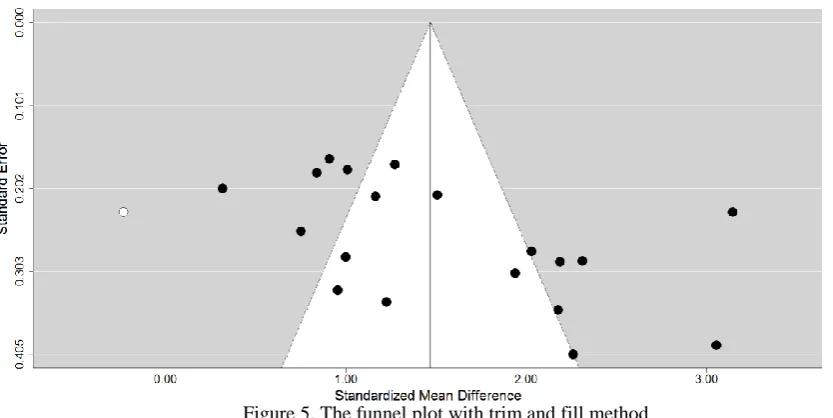
Publication bias is an indication of unrepresentative findings from a readily available study of that population of completed research, which typically puts readers and researchers in danger of drawing wrong conclusion about the actual findings that can be found in that body of research, and thus, becomes a threat to validity of research findings (Rothstein, Sutton, & Borenstein, 2005). Funnel plots are primarily used in meta-analysis for the investigation of publication bias even though it is one of the potential reasons of asymmetry seen in funnel plots (Sterne, Becker, & Egger, 2005). Several measures – standard error, sampling variance, or inverse of those measures – can be plotted against the effect size of interests, and then, asymmetry in the plots is inspected to determine certain forms of publication bias (Viechtbauer, 2010).
Presence of publication bias can be investigated using several diagnostic procedures which assess the degree of asymmetry in the funnel plots, such as regressions test (Egger et al., 1997), trim and fill method (Duval & Tweedie, 2000a; 2000b), file drawer analysis (Fail-Safe N) computation using Rosenthal (1979)‟s, Orwin
(1983)‟s, and Rosenberg (2005)‟s methods. Sterne and Egger (2010) recommended use of standard error against standardized mean differences in funnel plots if the main objective of a meta-analysis is to examine the treatment effects. Therefore, the existence of publication was examined by taking their recommendation into consideration in this study. The funnel plot was created with trim and fill method. As seen in Figure 5, only one study was missing on the left side of the funnel plot which makes the funnel plot approximately symmetric. Since the moderator analysis showed non-significant results as presented in Table 1, the trim and fill method was only applied to the initial random-effects meta-analytic model from which the overall effect size estimate was found 1.55 [1.20-1.91]. Using Rosenthal (1979)‟s file drawer analysis, we found that a total of 4646 studies that would average the null results should be added to this meta-analysis in order to reduce the combined significance level of the effect size to the pre-defined alpha level of .05.
Figure 5. The funnel plot with trim and fill method
Tendency in publishing studies with significant result is the main reason of publication bias. From the selected studies for this meta-analysis, we have found only one study from which the effect size estimate was not significantly different from 0. Significant effect size estimates with large magnitudes were obtained from the rest of the studies. However, this result can be understood at some degree since many of them were either master thesis (n = 8) or doctoral dissertations (n = 7). It is expected that thesis and dissertations tend to show significant results to be approved by the review committee. Therefore, it may be practically hard to control this situation since published studies are reachable after they are published. Journal editors and reviewers may stop publication bias by encouraging authors or researchers for submitting their work with or without significant statistical results. In ideal case, registering every study undertaken regardless of looking for significant results may resolve this problem at some degree (Thorton & Lee, 2000).
Discussion and Conclusion
statistically significant at the pre-determined alpha level. The magnitude of the overall effect size estimate (Hedge`s g = 1.55, 95% CI = [1.20-1.91]) indicated that hands-on activities had a very large impact on students‟ science achievement. While the effect size estimates for each moderator variable was also statistically significant, the differences within sub-categories of moderator variables (e.g., study type, treatment duration, etc.) did not show any statistically significant impact on the variation in mean effect size estimates.
Based on our investigation of the selected studies, students in an environment where science was taught using hands-on activities during their coursework shows better academic performance than those who were taught science in a teacher-centered or solely lecture-based atmosphere. This finding is parallel with those of the previous studies showing that hands-on activities promoted students` science achievement level compared to students participated in the lecture-based traditional training (Ates & Eryilmaz, 2011; Bigler & Hanegan, 2011; Costu, Unal, & Ayas, 2007; Ekmekci & Gulacar, 2015; Gaitano & Bogner, 2011; Glasson, 1989; Randler & Hulde, 2007). During hands-on activities, students are expected to complete many tasks including manipulating variables, performing an experiment, making observation, collecting and recording data, reasoning, generating inferences, and sharing their findings with others. Along with these scientific skills, students are able to participate in activities directly. This way of teaching creates such an environment that students can gain skills with high cognitive complexity level, which is one of the characteristics of scientifically literate citizens (Schroeder, Scott, Tolson, Huang, & Lee, 2007). In case of giving students a chance to be actively involved in inquiry through hands-on activities, it should not be surprising to see that students who have the high cognitive skills show better academic performance than the others. It should be noted here that the use of hands-on activities, of course, is not the only way to teach science, but the present study based on overall effect science estimate indicated that hands-on science is one of the effective ways for students to learn science by touching and playing with materials, testing their hypothesis through experiments, sharing their observations and findings to get better understating of subject matters.
Project-based learning (PBL) creates an environment in which students take responsibility of their own learning, get motivated to work in groups, and exchange ideas with others, and draw conclusion based on their own observation in order to reach solution to real world problems (Korkmaz & Kaptan, 2001; 2002). Therefore, it should not be surprising to see hands-on activities mainly take place in this learning process to promote students‟ understating of subject matters in science and positively affects their academic achievement. A most recent study conducted by Ayaz and Soylemez (2015) confirms that the PBL has a large impact on students‟ science academic achievement (ES = 0.997). Our findings also suggest that hands-on activities be used for effective science teaching. Despite the fact that hands-on science activities make significant contributions to achievement in science education which is clear in the present meta-analysis study, still some results of previous studies did not show the value of hands-on science over virtual experimental materials (Klahr, Triona, & Williams, 2007; Smetana & Bell, 2012; Tirona & Kalhr, 2003) and paper-and-pencil tasks (Schwichow et al., 2015; Schwichow et al., 2016). Results from Schwichow et al.‟s (2015) meta-analysis on control-of-variables (CVS) indicated that manual and virtual manipulation of variables did not directly impact on students understanding of CVS. In a recent study, Schwichow et al. (2016) emphasized the importance of “cognitive manipulation” in hands-on and paper-and-pencil tasks instead of physical and virtual manipulation. They implied that thinking about manipulating variables is crucial for learning CVS in hands-on tasks. For cognitive manipulation, they indicated that “a teacher can utilize hands-on, virtual, or paper-and-pencil tasks as long as the task requires thinking about the manipulation of variables and the consequences of those manipulations” (Schwichow et al., 2016, p. 18). As a result, our findings bring a new question into researchers` agenda to debate on the effectiveness of the hands-on activities in science teaching. We observed a statistically significant and also positive effect of hands-on science practices on students‟ academic achievement in all of the studies (articles and dissertations) selected for the meta-analysis study in favor or experimental group. Negative impact or no impact was not reported in the selected studies. This might be a reason why the magnitude of the overall effect size estimate is found to be too large in this study. We therefore feel a necessity to mention here that authors, academic journals, journal editors, and reviewers have the tendency of publishing manuscripts with significant results, which basically the main reason of publication bias. The only solution to prevent publication bias is that unpublished studies might have been included to this meta-analysis to obtain a more precise estimate of the effect size in the population of the relevant research on hands-on science. We therefore encourage researchers publish their manuscripts even if no statistically significant results are found.
Limitations of Study
model for further investigations and obtain a more precise estimate of the overall effect size estimate. This analysis was limited with studies conducted only in Turkey and does not include all research on hands-on instruction in other countries. Because we analyzed studies that met our analysis criteria, studies in which no control groups were used and/or in which no adequate statistics reported were not included into this meta-analysis. Another limitation was that we focused on hands-on activities and science achievement. However, we could not use other variables such as interest, motivation, science process skills and so on in this analysis since the number of those studies focusing on other variables was not adequate to run meta-analysis with a different outcome variable.
Implications
Since this study has been conducted using the available studies in Turkey, further studies should investigate the same inquiry in other countries to compare the findings with this study. Even, the trend of such research area could also be investigated through sampling of the studies on Hands-on Science from the international literature to draw general picture. The reform attempts in Turkish Education System since 2004 put a considerable attention on student-centered teaching, constructivism, hands-on and minds-on activities, and inquiry based science practices. Results of this study point out to what extend hands-on activities are affective in increasing science achievement and in reaching scientific literacy which present results confirm the value of this step in the general reform. Results that will be obtained from further studies will add new evidences to the debate of the effectiveness of hands-on science in achievement. Thus, educators and teachers would get a better picture of the effectiveness of hands-on activities in science teaching and how it impacts the students` academic achievement. In this study, we could not include the effects of hands-on activities on some variables including interest, motivation, science process skills on the science achievement due to the lack of adequate research. Further studies are required to report the effects of hands-on on academic achievement through those variables. Since it has been indicated by several studies (Holstermann et al., 2010; Ozel, Caglak, & Erdogan, 2013; Randler & Hulde, 2007) that students` interest in science is an important factor that affects their achievement and science-related future career plans, the use of hands-on activities may help to increase students` interests in subject matters. As for the student group, even though variety of student group was included in the selected studies, no study was observed undertaken with the elementary school students. Unfortunately, it seems that hands-on activities are not frequently used in elementary schools even though students may develop more interest in science at their early ages. However, the results of the present study is the evidence of that the use of hands-on activities should be considered as an effective science teaching strategy to prepare the scientifically literate citizens for the future. In other words, as educators we are responsible to employ, or at least to encourage others for the use of hands-on activities during science teaching in order to accomplish the goal of the science literacy. Therefore, not only the use of hands-on activities in science teaching, but also any other strategy or activity that helps students to develop interests in science and also help them improve their cognitive skills should be included in school curricula in order to prepare our students for the future.
References
American Association for the Advancement of Science (AAAS). (1994). Benchmarks for science literacy. New York: Oxford University Press.
Ateş, Ö., & Eryılmaz, A. (2011). Effectiveness of hands-on and minds-on activities on students „achievement and attitudes towards physics. Asia-Pacific Forum on ScienceLearning and Teaching, 12(1), 3-22. Ayaz, M. F., & Soylemez, M. (2015). The effect of the project-based learning approach on the academic
achievements of the students in science classes in turkey: A meta-analysis study. Education and Science, 40 (178), 225-283.
Bigler, A. M., & Hanegan, N. L. (2011). Student content knowledge increases after participation in a hands-on biotechnology intervention. Journal of Science Education and Technology, 20(3), 246-257.
Bilgin, I. (2006). The effects of hands-on activities incorporating a cooperative learning approach on eight grade students' science process skills and attitudes toward science. Journal of Baltic Science Education, 1(9), 27-37.
Birge, R. T. (1932). The calculation of errors by the method of least squares. Physical Review, 40, 207–227. Borenstein, M., & Higgins, J. P. T. (2013). Meta-analysis and subgroups. Prevention Science, 14(2), 134-143. Borenstein, M., Hedges, L. V., Higgins, J. P. T, & Rothstein, H. R. (2009). Introduction to Meta- Analysis. UK:
Bulunuz, M. (2012). Motivational qualities of hands-on science activities for Turkish pre-service kindergarten teachers. Eurasia Journal of Mathematics, Science & Technology Education, 8(2), 73-82
Costu, B., Ünal, S., & Ayas, A. (2007). A hands-on activity to promote conceptual change about mixtures and chemical compounds. Journal of Baltic Science Education, 6(1), 35-46.
Duval, S. J., & Tweedie, R. L. (2000a). A nonparametric `Trim and Fill' method of accounting for publication bias in meta-analysis. Journal of the American Statistical Association, 95(449), 89-98.
Duval, S. J., & Tweedie, R. L. (2000b). Trim and fill: A simple funnel-plot-based method of testing and adjusting for publication bias in meta-analysis. Biometrics, 56(2), 455-463.
Egger, M., Smith, G. D., Schneider, M., & Minder, C. (1997). Bias in meta-analysis detected by a simple, graphical test. British Medical Journal, 315(7109), 629-634.
Ekmekci, A., & Gulacar, O. (2015). A case study for comparing the effectiveness of a computer simulation and a hands-on activity on learning electric circuits. Eurasia Journal of Mathematics, Science & Technology Education, 11(4), 765-775.
Erentay, N., & Erdogan, M. (2009). 22 adımda doğa eğitimi. Ankara: ODTÜ yayıncılık.
Flick, L. B. (1993). The meanings of hands-on science. Journal of Science Teacher Education, 4(1), 1-8. Haury, D. L. & Rillero, P. (1994). Perspectives of hands-on science teaching. Columbus, OH: ERIC
Clearinghouse for Science, Mathematics, and Environmental Education.
Higgins, J.P.T. & Green, S. (2008). Cochrane Handbook for Systematic Reviews of Interventions. Chichester, UK: John Wiley & Sons, Ltd.
Higgins, J. P. T., & Thompson, S. G. (2002). Quantifying heterogeneity in a meta-analysis. Statistics in Medicine, 21, 1539–1558.
Holstermann, N., Grube, D., & Bögeholz, S. (2010). Hands-on activities and their influence on students‟ interest. Research in Science Education, 40(5), 743-757.
Huedo-Medina, T.B., Sánchez-Meca, J., Marín-Martínez, F., & Botella, J. (2006). Assessing heterogeneity in meta-analysis: Q statistic or I2 index? Psychogical Methods, 11(2), 193-206.
Glass,G.V. (1976). Primary, secondary and meta-analysis. Educational Researcher, 5, 3-8.
Glasson, G. E. (1989). The effects of hands-on and teacher demonstration laboratory methods on science achievement in relation to reasoning ability and prior knowledge. Journal of Research in Science Teaching, 26, 121–131.
Gaitano, F., & Bogner, F. X. (2011). Cognitive influences of students‟ alternative conceptions within a hands-on gene technology module. The Journal of Educational Research, 104(3), 158-170.
Kalender, I., & Berberoglu, G. (2009). An assessment of factors related to science achievement of Turkish students. International Journal of Science Education, 31(10), 1379-1394.
Klahr, D., Triona, L. M., & Williams, C. (2007). Hands on what? The relative effectiveness of physical versus virtual materials in an engineering design project by middle school children. Journal of Research in Science Teaching, 44, 183-203.
Koç, A., & Böyük, U. (2012). The effect of hands-on science experiments on attitude towards science. Journal of Turkish Science Education, 9(4), 102-118.
Konstantopoulos, S., & Hedges, L.V. (2009). Analyzing effect sizes: Fixed-effects models. In H. Cooper, L. V. Hedges, & J. C. Valentine (Ed.). The handbook of research synthesis and meta-analysis 2nd Ed. (pp. 17-37). Russell Sage Foundation: New York, NY.
Korkmaz, H., & Kaptan, F. (2001). Fen eğitiminde proje tabanlı öğrenme yaklaşımı. Hacettepe Üniversitesi Eğitim Fakültesi Dergisi, 20, 193-200.
Korkmaz, H., & Kaptan, F. (2002). Fen eğitiminde proje tabanlı öğrenme yaklaşımının ilköğretim öğrencilerinin akademik başarı, akademik benlik kavramı ve çalışma sürelerine etkisi. Hacettepe Üniversitesi Eğitim Fakültesi Dergisi, 22, 91-97.
Ministry of National Education of Turkey (MoNE)(2006). Science and technology curriculum of elementary students (6th-8th grades). Board of Education, Ankara.
Ministry of National Education of Turkey (MoNE)(2013). Science curriculum of elementary students (3rd-8th grades). Board of Education, Ankara.
National Research Council (2012). A framework for K-12 science education: Practices, crosscutting concepts, and core ideas. Washington, DC: The National Academies.
NCES (National Center for Education Statistics). (2011). The nation‟s report card: Science 2011 (NCES 2012-465). Washington, DC: National Center for Education Statistics, Institute of Education Sciences, U.S. Department of Education.
Paris, S. G., Yambor, K. M., & Packard, B. W. L. (1998). Hands-on biology: A museum-school-university partnership for enhancing students' interest and learning in science. The Elementary School Journal,
98(3), 267-288.
Pigott. T. D. (2012). Advances in meta-analysis. New York, NY: Springer Science+Business Media, LLC. Randler, C., & Hulde, M. (2007). Hands‐on versus teacher‐centered experiments in soil ecology. Research in
Science & Technological Education, 25(3), 329-338.
R Software Core Team (2015). R: A language and environment for statistical computing [Computer software].
R Foundation for Statistical Computing, Vienna, Austria. Retrieved from http://www.R-project.org/ Rosenberg, M. S. (2005). The file-drawer problem revisited: A general weighted method for calculating fail-safe
numbers in meta-analysis. Evolution, 59, 464-468.
Rosenthal, R. (1979). The "file drawer problem" and tolerance for null results. Psychological Bulletin, 86, 638-641.
Rothstein, H. R., Sutton, A. J., & Borenstein, M. (2005). Publication bias in meta-analysis: Prevention, assessments and adjustments. Hoboken, NJ: John Wiley & Sons, Ltd.
Sadi, Ö., & Cakiroglu, J. (2011). Effects of hands-on activity enriched instruction on students' achievement and attitudes towards science. Journal of Baltic Science Education, 10(2), 87-97.
Scharfenberg, F. J., & Bogner, F. X. (2011). A new two-step approach for hands-on teaching of gene technology: effects on students‟ activities during experimentation in an outreach gene technology lab.
Research in Science Education, 41(4), 505-523.
Schroeder, C. M., Scott, T. P., Tolson, H., Huang, T. Y., & Lee, Y. H. (2007). A meta-analysis of national research: Effects of teaching strategies on student achievement in science in the United States. Journal of Research in Science Teaching, 44(10), 1436-1460.
Schwichow, M., Croker, S., Zimmerman, C., Höffler, T., & Härtig, H. (2015). Teaching the control-of-variables strategy: A meta-analysis. Developmental Review, 39, 37-63.
Schwichow, M., Zimmerman, C., Croker, S., & Härtig, H. (2016). What students learn from hands-on activities?
Journal of Research in Science Teaching, 53(7), 980-1002.
Smetana, L. K., & Bell, R. L. (2012). Computer simulations to support science instruction and learning: A critical review of the literature. International Journal of Science Education, 34(9), 1337-1370.
Sterne, J. A. C., & Egger, M. (2010). Funnel plots for detecting bias in meta-analysis: Guidelines on choice of axis. Journal of Clinical Epidemiology, 54(10), 1046-1055.
Sterne, J.A.C., Becker, B. J., & Egger, M. (2005). The funnel plot. Publication Bias in Meta-analysis – Prevention, Assessment, and Adjustment. R. Rothstein, A.J. Sutton, and M. Borenstein (Ed.). Hoboken, NJ: John Wiley & Sons, Ltd.
Thorton, A., & Lee, P. (2000). Publication bias in meta-analysis: Its causes and consequences. Journal of Clinical Epidemiology, 53, 207–216.
Triona, L. M., & Klahr, D. (2003). Point and click or grab and heft: Comparing the influence of physical and virtual instructional materials on elementary school students' ability to design experiments. Cognition and Instruction, 21(2), 149-173.
Viechtbauer, W. (2005). Bias and Efficiency of Meta-Analytic Variance Estimators in the Random-Effects Model. Journal of Educational and Behavioral Statistics, 30(3), 261–293.
Wang, M. C., & Bushman, B. J. (1998). Using the normal quantile plot to explore the meta-analytic data sets.
Psychological Methods, 3(1), 46-54.
Wiechtbauer, W. (2010). Conducting Meta-Analysis in R with the metafor package. Journal of Statistical Software, 3(36), 1-48.
Appendix A
1. Effect Size Estimates for Each Subcategory Variable and
Subgroups
Parameter a
N
b ESc SEd LLe ULf
Variable and Subgroups
Parameter a
N
b ESc SEd LLe ULf
Study Type
Geographica
l Region
Journal b0 9
1.3 2
.25 0 .83
1.8 1
The Mediterranea
n b0 1
2.1 9
.29 1
1.6 2 2.76 Dissertati
on b1
1 0 1.7 8 .25 0 1.2 9 2.2 7 The
Marmara b1 3
2.0 2
.70
4 .64 3.40
The Central
Anatolia b2 9
1.4 3
.23
5 .97 1.89
School Level
The
Black Sea b3 2
2.0 8
.94
4 .23 3.93 Middle
School b0
1 3 1.5 8 .18 9 1.2 1 1.9 5 The
Aegean b4 4
1.0 8
.17 0 .85
1.52 High
School b1 5
1.1 3
.30 6 .54
1.7 3
College or
University b2 1
3.1 4 .23 0 2.6 9 3.5
9 Grade Level
Sophomo
re b0 1
3.1 4
.23 0
2.6 9 3.59
Treatment Time
Grade 11 b1 2 .91
.59
2 -.26 2.07 Less than
30 Days b0 8
1.5 2 .26 5 1.0 0 2.0
4 Grade 10 b2 1
1.0 0
.28
6 .44 1.56 Between
30 and 60
Days b1 9
1.8 3 .24 0 1.3 5 2.3
0 Grade 9 b3 2
1.4 7
.66
8 .16 2.78 More than
60 days b2 2 .51
.21
4 .08 .93 Grade 8 b4 5
1.9 1
.38 8
1.1 4 2.67
Grade 7 b5 4
1.5 2
.34
2 .85 2.19
Treatment Location
Grade 6 b6 4
1.2 2
.24
5 .82 1.70
Urban b0
1 0
1.5 1
.29 6 .93
2.0 9
Suburban b1 1
1.0 0
.28 6 .44
1.5 6
Rural b2 8
1.7 0 .22 4 1.2 6 2.1 4 a.
Parameter estimated in Mixed-effects Model b. Number of studies in each subcategory
c. Hedge‟s g effect size estimate
d. Standard errors of effect size estimation
e. Lower limit of 95% CI of effect size estimate
2. Forest Plot for the Moderator Variable Study Type
4. Forest Plot for the Moderator Variable Treatment Time
6. Forest Plot for the Moderator Variable Treatment Location
Appendix B
Included Studies in the Meta-Analysis
Ateş, Ö., & Eryılmaz, A. (2011). Effectiveness of Hands-on and minds-on activities on students' achievement and attitudes towards physics. Asia-Pacific Forum on Science Learning and Teaching, 12(1), 3-22. Atıcı, Ö. ve Atıcı, T. (2012). Fotosentez konusunun öğretiminde uygulanan laboratuvar yönteminin öğrenci
tutum ve başarısına etkisi. The Journal of Turkish Educational Sciences, 10(1), 143-166.
Başdaş, E. (2007). İlköğretim fen eğitiminde, basit malzemelerle yapılan fen aktivitelerinin bilimsel süreç becerilerine, akademik başarıya ve motivasyona etkisi. (Unpublished Master Thesis). Celal Bayar University, Manisa, Turkey.
Başkurt, P. (2009). İlköğretim 8. sınıf fen ve teknoloji dersi kuvvet ve hareket ünitesinin basit malzemelerle yapılan fen aktiviteleri ile öğretilmesinin başarıya, kalıcılığa ve tutuma etkisi. (Unpublished Master Thesis). Gazi University, Ankara Turkey.
Costu, B., Unal, S., & Ayas, A. (2007). A hands-on activity to promote conceptual change about mixtures and chemical compounds. Journal of Baltic Science Education, 6(1), 35-46.
Etcioğlu, Ö. (2010). Kuvvet ve hareket ünitesine yönelik basit araç gereçlerle geliştirilen rehber materyal kullanmanın öğrenmeye etkisi ve öğrenilenlerin günlük hayata aktarılma düzeylerinin incelenmesi. (Unpublished Master Thesis). Erzincan University, Erzincan, Turkey.
Güngör, B. (2004). “Yönetici moleküller” konusunun öğretilmesinde deneysel yönteme göre geliştirilen öğretim tekniğinin uygulanması ve geleneksel öğretimle karşılaştırılması. (Unpublished Master Thesis). Balıkesir University, Balıkesir, Turkey.
Hardal, Ö. (2003). The effects of hands-on activities on ninth grade students’ achievement and attitudes towards physics. (Unpublished Master Thesis). The Middle East Technical University, Ankara, Turkey.
Inciser, I. (2007). Implementation of conceptual change oriented instruction using hands on activities on tenth grade students’ understanding of gases concepts. (Unpublished Master Thesis). The Middle East Technical University, Ankara.
Oskay, Ö. Ö., Erdem, E. ve Yılmaz, A. (2009). Kimya laboratuvar uygulamalarının öğrencilerin kimyaya yönelik tutum ve başarılarına etkisi üzerine bir çalışma. Electronic Journal of Social Sciences, 8(27), 222-321.
Öztürk, G. (2007). Öğrencilerin basit malzemelerle yaptıkları deneylerin kuvvet-enerji kavramını öğrenmelerine ve fene karşı tutumlarına etkisi. (Unpublished Master Thesis). Marmara University, Istanbul, Turkey. Selli, C., Yıldırım, G., Kaymak, A., Karacicek, B., Ogut, D., Gungor, T., Erem, E., Ege, M., Bumen, N. &
Tosun, M. (2014). Introducing basic molecular biology to Turkish rural and urban primary school children via hands-on pcr and gel electrophoresis activities. Biochemistry and Molecular Biology Education, 42(2), 114-120.
Telli, A., Yıldırım, H. İ., Şensoy, Ö. ve Yalçın, N. (2004). İlköğretim 7. sınıflarda basit makinalar konusunun öğretiminde laboratuar yönteminin öğrenci başarısına etkisinin araştırılması. Gazi Eğitim Fakültesi Dergisi, 24(3), 291-305.
Unal, S. (2008). Changing students‟ misconceptions of floating and sinking using hands-on activities. Journal of Baltic Science Education, 7(3), 134-146.
Author Information
Serdar CaglakEskisehir Osmangazi University Eskisehir, Turkey