IJSRSET1624160 | Received : 14 August 2016 | Accepted : 20 August 2016 | July-August 2016 [(2)4: 726-730]
© 2016 IJSRSET | Volume 2 | Issue 4 | Print ISSN: 2395-1990 | Online ISSN : 2394-4099 Themed Section: Engineering and Technology
726
3D Modeling of Virtualized Reality Objects using Neural
Computing
P. Sheepa, A. Charles
Department of Computer Science, St. Joseph’s college, Trichy Tamilnadu, India
ABSTRACT
3D Modeling of virtualized reality objects which follow a methodology using neural computing. In this paper, there are three acquisition systems: endoneurographic equipment (ENS), stereo vision system and non-contact 3D digitizer. The 3D virtualized representation correspond to several objects as phantom brain tumor, archaeological items, faces, things which have more complications This also comparison in terms of computational cost, architectural complexity, training methods, training epochs and performance. The research paper will conclude that it gives the best performance and the lowest displaying times, lowest memory requirements and acceptable training times with the help of the various methods used in this research paper.
Keywords: Neural network, 3D model Endoneurosonographic system (ENS).
I.
INTRODUCTION
There are two main functions in three-dimensional modeling: The first one is Virtual Reality, which is nothing but the artificial model construction with the real or imaginary objects for applications in video games, visual and industrial design. Basically, these functions are built with the help of Computer Aided Design (CAD) Software.
The second function is Virtualized Reality these are developed models of real world objects from information obtained through a sensor. Three-dimensional modeling of virtualized reality objects acquired using 3 types of sensors: Endoneurosonographic system (ENS), Stereoscopic vision system and non–contact 3D digitizer.
According to the concept of computer graphics, 3D modeling is the best approaches to representing the various objects and their scenario. The biggest task is to make simple models and reduce complexity.
These are some aspects to be noted when creating the 3D model: computational cost, visualization, acquisition, modeling purpose, implementation complexity, and manipulation. These aspects explain
the choice, design, and performance of the model.3D modeling techniques are reported in various aspects According to the Constructive Solid Geometry (CSG), the geometrical structures with various shapes are combined to form much more shapes in order. (Example) The mesh of polygons are formed using various combination of triangles.
The elementary cubes which are a voxel which is the division of the space in three-dimensional which is called as Voxelization, and depending on the shape of the object these cubes are represented “full” or “empty”.
The advantage of 3D models of virtualized reality objects when compared to others resources they don’t acquire a large amount of memory as voxelization and not require high rendering times as polygonal or splines representations, and provide volume presentations.
diagnosis for this 3D model of image processing, so this method will clearly help in such a way that the layers in the specific images can be separated into many layers. As every image has a multi-layer and each layer can be viewed separately to be more specific.
II.
METHODS AND MATERIAL
1. Literature Survey
Rudiger W. Brause [1] proposed another diagnostic approach by neural networks is adaptive rule generation. By this, we can explain the class boundaries in the data and at the same time find out the necessary variables for a rule of the prediction system. By using a special approach of rectangular basis networks they achieved approximately the same classification results as by the growing neural gas. Additionally, the diagnosis was explained by a set of explicitly stated medical rules.
Heckerling et al [2] used artificial neural networks (ANN) coupled with genetic algorithms to evolve combinations of clinical variables optimized for predicting urinary tract infection.
Huang et al [3] examined a system to diagnose urodynamic stress incontinence (USI) with computer aided vector-based perineal ultrasound.
Francisco et al [4] developed a new system from a model based on a multi agent system in which each neuronal center corresponds to an agent. This system incorporates a heuristic in order to make it more robust in the presence of possible inconsistencies. The heuristic used is based on a neural network (orthogonal associative memory). Knowledge through training has been added to the system, using correct patterns of behavior of the urinary tract and behavior patterns resulting from dysfunctions in two neuronal centers as a minimum.
Monadjemi et al [5] investigated the application of artificial neural networks in typical disease diagnosis. The real procedure of medical diagnosis which usually is employed by physicians was analyzed and converted to a machine-implementable format. The
results of the experiments and also the advantages of using a fuzzy approach were discussed as well.
Johnsson et al [6] evaluated the work out of some artificial neural network models as tools for support in the medical diagnosis of urological dysfunctions. They developed two types of unsupervised and one supervised neural network.
Altunay et al[7] analyzed the uroflowmetric data and assisted physicians for their diagnosis. They introduced an expert pre-diagnosis system for automatically evaluating possible symptoms from the uroflow signals. The system used artificial neural networks (ANN) and produced a pre-diagnostic result.
Moein et al [8] analyzed the real procedure of medical diagnosis which usually is employed by physicians and converted to a machine implementable format. Then after selecting some symptoms of eight different diseases, a data set contains the information of a few hundred cases were configured and applied to a MLP neural network. The results of the experiments and also the advantages of using a fuzzy approach were discussed as well. Outcomes suggest the role of effective symptoms selection and the advantages of data fuzzificaton on a neural networks-based automatic medical diagnosis system.
Lisboa et al [10] presented a review to assess the evidence of healthcare benefits involving the application of artificial neural networks to the clinical functions of diagnosis, prognosis and survival analysis, in the medical domains of oncology, critical care and cardiovascular medicine.
2. Methodology
2.1 The Multilayer Perceptron Neural Network Model
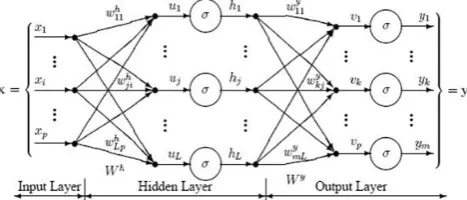
The following diagram illustrates a perceptron network with three layers: Perceptron has three layers Input layer, Hidden layer,Output layer Every perceptron layer will have one neuron, N-1 neurons are used to represent the N categories of the variable.
Input Layer
Each perceptron variable values is represented x1…xp and the value of each variable may range from -1 to 1 .Every input layer passes to the hidden layer.
When the range is from -1 to 1 there is a constant value of 0.1 which is constant and called as bias.
The bias will be inputted to the hidden layer and it is multiplied by a weight and then the value added to the sum and the final value moved to the neuron.
Hidden Layer
The neuron are received by the hidden layer and each neuron is multiplied by w(wij) and the output weight is added with Uj. The weighted sum (Uj) is inputted into Transfer function σ. Then it is finally resulted hj which is distributed to the output layer.
Output Layer
The same method between Input layer and Hidden layer are continued to the output layer also.
Then the neuron from the hidden layer is multiplied by a weight (wij) and that result is added which resulted as value vj. The weighted sum (Vj) is inputted into
Figure 1: Multi-Layer Perceptron Architecture
Transfer function σ. Then it is finally resulted yk which
is distributed to the output layer. With a continuous target variable the regression analysis is performed along with a single neuron in the output layer, and then it generates a single y value. Finally when classifying the problems with the categorical targeted variables, there are N neurons in the output layer which produces N values, one for each of the N categories of the target variable.
The output of the neuron is defined as follows:
2.2 Multilayer Perceptron Architecture
The network diagram, above is a full-connected, three layer, feed-forward, perceptron neural network. “Fully connected” means that the output from each input is hidden neuron is distributed to all of the neurons in the following layer. “Three layers”: Input layer, Hidden Layer, Output Layer. “Feed forward” means that the values only move from input to hidden to output layers; no values are fed back to earlier layers (a Recurrent Network allows values to be fed backward). All neural networks have an input layer and an output layer, but the number of hidden layers may vary. Here is a diagram of a perceptron network with two hidden layers and four total layers:
When there is more than one hidden layer, the output from one hidden layer is fed into the next hidden layer and separate weights are applied to the sum going into each layer. This network has an input layer (on the left) with six neurons, one hidden layer (in the middle) with two neurons and an output layer (on the right) with two neurons.
2.3 Modeling Using Multilayer Feed–Forward Neural Networks (MLFFNN)
The MLFFNN representation is simple, compact and accurate as long as the user is willing to pay the computational cost required for training. Theoretically, it has infinite resolution, saves disk storage space and provides a continuous model of the object. This model solves the problems of storage and longtime rendering compared with models based on polygons and voxels. Another advantage is that it resolves the inability of implicit surfaces to specify particular points on the object. A MLFFNN can represent fine details if we use a good training dataset. Finally, the MLFFNN allows operations as morphing, geometric transformations and collision detection.
The three–dimensional modeling scheme is used in Artificial Neural Networks. The network input is the 3D point cloud from virtualized objects. The network output is the three–dimensional representation generated by the network. As a general rule, the number of neurons is less than the number of points in the input dataset.
MLFFNN Training is trained in such a way that the neural network requires an off–line training in which the volumetric representation of 3D objects is generated. Training data correspond to 3D point clouds from several objects as phantom brain tumors, faces, archaeological items and fruits, acquired by one of three systems: endoneurosonographic equipment (ENS), sterepscopic vision system Starcam FW-3R or non–contact 3D digitizer, respectively.
To avoid an inadequate training which leads to the trivial solution, additional synthetic points must be added to the training set. These points should be located inside and outside of the object to achieve a representative training dataset.
2.4 Modeling Using Self-Organizing Architectures
The self–organizing architecture is a type of neural network, based on unsupervised learning, which can be used for 3D modeling of point–clouds that encodes the morphology of an object. Two of the most popular self–organizing architectures are Self–Organizing Maps (SOM) and Neural Gas Networks (NGN). Both SOM and NGN use Competitive Learning (CL).
The input space is clustered by assigning neurons to specific regions. The number of inputs of each neuron is equal to the input space dimension. Synaptic weight vectors are interpreted as locations in this space. Each region is a group of nearby locations according to a distance with respect to the assigned neuron. After training, two input vectors belonging to the same region in the space should be represented by two very close neurons.
III. RESULTS AND DISCUSSION
A Implementing a three-dimensional modeling methodology based on neural computing. The input patterns are (𝑥, 𝑦, 𝑧) point–clouds from one of three sensors: Endo Neuro Sonographic equipment (ENS), stereo vision system or non– contact 3D digitizer. Here explores the use of three types of artificial neural networks: Multilayer Feed–Forward Neural Networks (MLFFNN), Self–Organizing Maps (SOM) and Neural Gas Networks (NGN). Here present experimental comparisons in terms of performance, computational cost training time and architecture complexity.
The 3D neural modeling provides a direct advantage in displaying time and disk storage space, because representation is done using only the neural neurons instead of manipulating the entire point cloud. As a general rule, the number of neurons is always less or equal than the number of points in the input dataset. SOM and NGN provide superficial representation of the object, while MLFFNN provides a volumetric representation in the sense that information about inside and outside of the object is utilized during training.
architecture and internal connections; hence we must use a set of test data to perform visualization. In fact that MLFFNN is a classifier trained to learn a volumetric model, test dataset is enter to the neural network, and then those points for which network response is zero are plotted, i.e. those points that are located on the surface of the object. On the other hand, NGN and SOM models code tumor morphology directly in their synaptic weights, so that their visualization is immediate. SOM visualization has a slightly higher cost than NGN because of grid rendering time.
IV. CONCLUSION AND FUTURE WORK
In this paper of 3D modeling of virtualization reality objects with the help of the neural network is more specific and prominent to find the fact of emerging improvement in the reality object fields. There are many multiple layers in an image, which cannot be separated and is not easier to find the depth of the image but with the help of this research work we could be able to separate the specific part of the image in detail. With this the complexity, overloaded memory, higher displaying time will be handled and increase the performance which will make the work easier and simple. As the future enhancement, this research work will be more effective and efficient with the advancement. Where this research work is clearer and with runs in the java platform, in future it can also be implemented in the android with the help of more different platform.
V.
REFERENCES
[1] Rüdiger W. Brause “ Medical Analysis and Diagnosis by Neural Networks” Medical Data Analysis, Volume 2199 of the series Lecture Notes in Computer Science pp 1-13.
[2] Heckerling, Canaris, Flach, Tape, Wigton and Gerber “Predictors of urinary tract infection based on artificial neural networks and genetic algorithms “ International Journal of Medical Informatics ,Volume 76, Issue 4, April 2007, Pp 289–296.
[3] Huang and Chen “Computer-aided diagnosis of urodynamic stress incontinence with vector-based perineal ultrasound using neural networks “, Volume 30, Issue 7 December 2007 Pp 1002– 1006.
[4] M. P. Francisco, G. C. Juan Manuel, S. P. Antonio and R. F. “lower urinary tract based on artificial neural networks, Neurocomputing” , Jan., 2008, Vol. 71 Issue 4-6, pp. 743-754. [5] S. A. Monadjemi and P. Moallem, “Automatic
Diagnosis of Particular Diseases Using a Fuzzy-Neural Approach”, International Review on Computers & Software, Jul., 2008, Vol. 3 Issue 4, pp. 406-411.
[6] D. Gil, M. Johnsson, J. M. Garicia Chemizo, A. S. Paya and D. R. Fernandez, “Application of Artificial Neural Networks in the Diagnosis of Urological Dysfunctions, Expert Systems with Applications”, April, 2009, Vol. 36 Issue 3, pp. 5754-5760.
[7] S. Altunay, Z. Telatar, O. Erogul and E. Aydur, “A New Approach to urinary system dynamics problems: Evaluation and classification of uroflowmetric signals using artificial neural networks, Expert Systems with Applications “, April, 2009, Vol. 36 Issue 3, pp. 4891-4895. [8] S. Moein, S. A. Monadjemi and P. Moallem,” A
Novel Fuzzy-Neural Based Medical Diagnosis System”, International Journal of Biological & Medical Sciences", 2009, Vol. 4 Issue 3, pp. 146-150.
[9] Koushal Kumar,Abhishek “Artificial Neural Networks for Diagnosis of Kidney Stones Disease” IJITCS Vol. 4, No. 7, July 2012, pp.20-25.