Nuclear Magnetic Resonance Spectroscopy
Applications In Foods
YelIz PARlAk
1and NuRAY GuzeleR
2*
1Pamukova Vocational School, Sakarya University, Sakarya, 54000- Turkey. 2Department of Food Engineering, Çukurova University, Adana, 01330- Turkey.
http://dx.doi.org/10.12944/CRNFSJ.4.Special-Issue-October.22 (Received: August, 2016; Accepted: September, 2016)
AbStRAct
Nuclear magnetic resonance spectroscopy (NMR) is the most powerful technique for determining the structure of organic compounds. NMR techniques are used successfully in various food systems for quality control and research. NMR spectroscopy is used to determine structure of proteins, aminoacid profile, carotenoids, organic acids, lipid fractions, the mobility of the water in foods. NMR spectroscopy is also used to identify and quantify the metabolites in foods. Also vegetable oils, fish oils, fish and meat, milk, cheese, wheat, fruit juices, coffee, green tea, foods such as wine and beer are among the last NMR applications. In addition, NMR spectroscopy is utilized for foodomics which is a new discipline that brings food science and nutritional research together. NMR techniques used for the food authentication are one- and two-dimensional NMR techniques, high resolution liquid state 1H and 13C NMR techniques, N15 and P-31 NMR techniques, 1H HR/MAS (high resolution magic angle spinning) NMR techniques. At this study, usage purposes of nuclear magnetic resonance spectroscopy for foods were collected.
keywords: Nuclear magnetic resonance spectroscopy (NMR), Application, Quality properties, Foods.
INtRoductIoN
Nuclear Magnetic Resonance (NMR) spectroscopy is an analytical chemistry technique used in quality control and research for determining the content and purity of a sample as well as its molecular structure. NMR is also the most powerful technique used to obtain structural information, and therefore it can help to understand the structure of components in food complex systems1,2. 1H NMR and 13C NMR spectroscopies are used for analyses of all organic compounds frequently3. Nuclear magnetic resonance is a non-destructive, multinuclear, multiparametric and often non-invasive technique, successfully employed in plant and mammalian biochemistry4.
Nuclear magnetic resonance (NMR) imaging is based on the emission and absorption of energy in the radio frequency range of the
electromagnetic spectrum basis. All nucleotides containing a single proton and neutron can be observed by NMR5. The high quality of the spectra enables the identification and attribution of the most of the water-soluble components6.
due to be installed, magnetic field occurs around. Therefore, atomic nucleus behave like a magnet. Magnetic moment of the magnetic field generated by the nucleus7.
NMR spectrometers basically consists of four main sections.
1. Magnet containing highly homogeneous magnetic field in of pole ends
2. Very stable a radio frequency transmitter 3. Radio frequency receiver
4. Recorder (Monitor) (Figure 1).
A NMR spectrum gives the following information:
a) The number of peaks indicate different types of nucleus.
b) The location of the peak indicates the type of nucleus and chemical environment.
c) The relative areas of the peaks gives the relative number of each type of nucleus. d) Disruption in the peak, indicates that affected
nucleuses from eachother8.
use of NMR technique At Food Systems Nuclear magnetic field spectroscopy is being used successfully at a variety of food
systems. NMR is the most powerful technique used to illuminate the structure. Therefore, it can help to understand to structure of components in complex food systems. The 1H NMR spectroscopy can also be considered a fingerprinting technique1. The origin of chemical variability within a food can be quickly assessed using these methods, and the inherent ability of NMR to provide information about the chemical composition of a sample will allow the source of variation to be identified26.
NMR techniques are utilized in determining the changes on heat-treated foods. In this technique, change of water distribution and mobility in foods could be determined without damaging to food9. Also, it is one of the techniques used to determine the level of melamine in foods10. In addition, nuclear magnetic resonance spectroscopy is a good method to determine water holding capacity, intramuscular fat and total water content of meat5.
High resolution NMR technique can be used in the determination of organic compounds of vinegar and quantification of the main classes of vinegar components (carbohydrates, alcohols, organic acids, volatile compounds and amino acids)1.
Successfully used another field of NMR spectroscopy is milk and dairy products. Studies were conducted on the water molecules of casein systems, serum proteins and milk powder by NMR technique11. Furthermore, NMR applications are used to determine the characteristics of the cheese. Nuclear magnetic resonance is used to monitor the maturation and evaluate the modifications of amino acid and water content in cheeses4, 6,12,13, 14.
NMR analysis of water-soluble fraction of cheese constitutes a valid approach for sample characterization6. It is extremely easy method due to does not require stabilization or derivation of the sample preparation.
1H nuclear magnetic resonance is used relaxometric characterization of fat and water states in soft and hard cheese. NMR relaxometry was able to provide information on water behaviour (i.e. the quantity and level of interactions with proteins) and on the solid :liquid ratio of anhydrous milk fat in the cheese12.
Dynamic characteristics of NMR is sensitive and characterize the molecular behavior of the sample. Relaxation refers to the phenomenon of nuclei returning to their thermodynamically stable states after being excited to higher energy levels. The energy absorbed when a transition from a lower energy level to a high energy level occurs is released when the opposite happens [3]. For example, relaxation time T2 gives information on protein ± water interactions and the morphology of the aggregate water systems through chemical and diffusive exchange12.
Relaxation time is called to the time taken for relaxation. There are two types of relaxation. 1. Spin – lattice relexation T1: Release of
energy by excited nuclei to their general environment
2. Spin – spin relaxation T2: Release energy is transferred to a neighboring nucleus by nucleus3.
Water in pasta filata Mozzarella was classified into two fractions by spin-spin relaxation times, T21 and T22, and corresponding proton intensities, A1 and A2, representing low and high
molecular mobility, respectively. Increase in A1 (and decrease in A2) suggested that, there was a redistribution of water from more- to less-mobile fraction (from T22 to T21 fraction) during the first 10 day of storage15. Changes in molecular mobility of water in pasta filata and non-pasta filata Mozzarella cheeses were investigated by using nuclear magnetic resonance. The increase in the amount of water molecules in the less mobile fraction indicated an increase in water-holding capacity of pasta filata Mozzarella15. The transverse relaxation times of the water protons provide information on the water localization and displacements within the foodstuffs4.
Nuclear magnetic resonance (NMR) is a powerful method for investigating water availability in biological systems12. low-resolution nuclear magnetic resonance (NMR) is used to determine different types of water present in the cheese matrix to provide information on the water localization and displacements within the foodstuffs and high-resolution nuclear magnetic resonance (NMR) to evaluate all the amino acids present in the cheese4.
The molecular fatty components of Pecorino Sardo Protected Designation of Origin (PS PDO) cheese were characterized through an exhaustive investigation of the 1 H- and 13C-NMR spectra of the extracted lipids. Several fatty acids (FA), such as long chain saturated, oleic, linoleic, linolenic, butyric, capric, caprylic, caproic, trans vaccenic, conjugated linoleic acid (cis9, trans11–18:2), and caproleic (9–10:1) were unambiguously detected. The positional isomery of some acyl groups in the glycerol backbone of triacylglycerols (TAG) was assessed. The NMR signals belonging to 1,3 diacylglycerols (DAG), and free fatty acids (FFA) were analysed as a measure of lipolytic processes on cheese. 1H-NMR resonances of saturated aldehydes and hydroperoxides were detected16.
affected by the specific area of origin of milk samples while NMR data, together with isotopic ratios, were useful for the discrimination of mozzarella samples17.
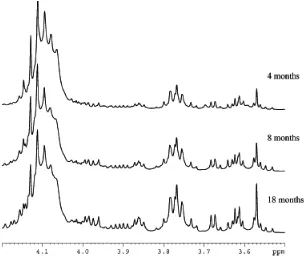
NMR technique is an application used to determine the structure and dynamics of proteins18,19. High resolution NMR experiments allow all the amino acids present in the cheese to be quantitatively and qualitatively evaluated4. 1H spectrum of free amino acids in Grana Padano cheese during 12 months of ripening is shown in Fig. 2.
1H NMR spectrum of Parmigiano Reggiano aqueous extract is largely dominated by the presence of free amino acids in combination with small quantities of fatty acids and organic acids. The high quality of the spectra enables the identification and attribution of the most of the water-soluble components6. Studies has proven that
NMR techniques were quite reliable, economical and successful method to observe differences in maturation of the cheese6.
High-Resolution MAS NMR is used for characterization of the ripening of Parmigiano Reggiano cheese by Shintu ve Caldarelli (2005). In this way, selected free amino acids and other low molecular weight metabolites were found to be among the most relevant compounds characterizing the ripening of Parmigiano Reggiano cheese.
MAS NMR technique allow comporison of cheeses with each other during ripening time as shown in Figure 3.
A rapid and quantitative 1H nuclear magnetic resonance (NMR) method was developed to analyse histamine in cheeses. The procedure is simple because the acid extract is analyzed directly,
Fig. 4: 1H NMR spectrum of a green tea extract
Fig. 3: 1H HRMAS NMR spectrums of Permigiano Reggiano cheese12
without any need for further filtration, derivatization, or other manipulation. The NMR method was successfully applied to different types of cheese, ranging from soft to hard20.
The application of 1H nuclear magnetic resonance (NMR) spectroscopy to the measurement
concentrations in large numbers of cheese samples and in the screening of ClA content in other dairy products21 .
Solid-state 31P nuclear magnetic resonance (NMR) to determine the different states of phosphates in cheeses was used. Sixteen semi-hard cheeses of various compositions were studied, and three fractions of phosphates (P) were distinguished according to their mobility: (1) mobile soluble P (ca. 10 % of total P), (2) mobile insoluble P (70 %) and (3) immobile insoluble P (20 %). In accordance with chemical composition and buffering capacities of the cheeses, these fractions could represent respectively (1) soluble inorganic P, (2) inorganic colloidal calcium P and phosphorylated serine residues (Pser) involved in a loose structure and (3) Pser involved in a tight environment. It was thus demonstrated that solid-state NMR is an appropriate method to observe the distribution of phosphates in cheese matrix and their evolution during cheese-making [22].
One-dimensional 31P NMR and two-dimensional (2D) 31P,1H COSY NMR spectroscopy was used for the determination of the phospholipids which comprise an important lipid class in food because of their technological use as emulsifiers and their nutritional value. The total phospholipids content in cheese fat and fish oil ranged from 0.3 to 0.4% and from 5 to 12%, respectively. Minor phospholipids were identified in forms of phosphatidic acid, lysophosphatidic acid, and phosphatidylglycerol23.
Discrimination between apple juices produced from different varieties has been achieved by applying principal components analysis (PCA) and linear discriminant analysis to 1H NMR spectra of the juices by Belton et al. Under optimum conditions a 100% success rate was achieved. Examination of the principal component loadings showed that the levels of malic acid and sucrose were two important chemical variables, but variations in the composition of the minor constituents were also found to make a significant contribution to the discrimination24.
Green teas from different countries was collected and analyzed by 1H NMR. It was proposed to establish if the teas could be discriminated
according to the country of origin or with respect to quality. After an extensive assignment of spectra, NMR spectroscopy has been shown to provide a wealth of information about the main metabolites of the teas studied. Tea components were determined for discrimination of teas as shown Figure 425.
Application of 1H NMR was used quality control and authenticity of instant coffee by Charlton et al. The presence of inherent differences between coffees produced by different manufacturers, and even between those produced by the same manufacturer, by identifying 5-(hydroxymethyl)-2-furaldehyde as a marker compound using the structural characteristics were determined by NMR26.
Another study, 31P NMR was used to determine the amount of mono- and diglycerides in virgin olive oils. It was found that quantification of other constituents of olive oils bearing functional groups with labile protons could be extended by quantitative 31P NMR spectroscopy27.
NMR can be used for foodomics because of ease of quantification and identification, short time and low costs needed for analysis and high number of metabolites that can be measured through a single-pass. Because of highest sensitivity of NMR focus on hydrogen is prefered for foodomics studies28.
ReSultS
ReFeReNceS
1. Caligiani A, Acquotti D, Palla G, Bocchi V. Identification and Quantification of the Main Organic Components of Vinegars by High Resolution 1H NMR Spectroscopy. Analytica Chimica Acta; 585: 110–119: (2007). 2. http://chem.ch.huji.ac.il/nmr/whatisnmr/
whatisnmr.html
3. Erdik E. Organik kimyada Spektroskopik Yöntemler. Ankara Ünv. Fen Fakültesi, Gazi kitabevi, 2. Baský, 1-527: (1998).
4. Curtis S. D. A, Curini R, Delfini M, Brosio E, D'ascenzo F, Bocca B. Amino Acid Profile in the Ripening of Grana Padano C heese: A NMR Study. Food Chemistry; 71(4): 495–502: (2000).
5. Söbeli C, kayaardi S. Et kalitesini Belirlemede Yeni Teknikler. Gýda; 39(4): 251-258: (2014).
6. Consonni R, Cagliani l. R. Ripening and Geographical Characterization of Parmigiano Reggiano Cheese by 1H NMR Spectroscopy. Talanta; 76(1): 200–205: (2008).
7. Balci M. Nükleer Manyetik Rezonans Spektropisi. Metu Press, Ankara, 1-445: (2000).
8. keeler J. Understanding NMR Spectroscopy. A John Wiley& Sons, ltd. Publication, Cambridge, Second Edition: (2010).
9. karakıs z, Gültekin S, kuscu A. Isısal Islemlerin Nükleer Manyetik Rezonans (NMR) ile Takibi. 7. Gida Müh. kongresi, kitaplar Serisi: 26, Ankara, 224: (2011).
10. Okur Ö. D, Güzel Seydim z. Gıdalarda Melamin ve Tespiti. 7. Gıda Müh. kongresi, kitaplar Serisi: 26, Ankara, 200: (2011). 11. Belloque J, Ramos M. Application of NMR
Spectroscopy to Milk and Dairy Products. Trends in Food Science & Technology; 10: 313-320: (1999).
12. Chaland B, Mariette F, Marchal and P. Certaines J. D. (2000). 1H Nuclear magnetic resonance relaxometric characterization of fat and water states in soft and hard cheese. Journal of Dairy Research, 67(04): 609-618p.
13. Shintu l, Caldarelli S. High-Resolution MAS NMR and Chemometrics: Characterization
of the Ripening of Parmigiano Reggiano Cheese. J. Agric. Food Chem., 53(10): 4026–4031: (2005).
14. Piras C, Marincola F. C, Savorani F, Engelsen S.B, Cosentino S, Viale S, Pisano M.B. A NMR Metabolomics Study of the Ripening Process of the Fiore Sardo Cheese Produced with Autochthonous Adjunct Cultures. Food Chemistry ; 141: 2137–2147: (2013). 15. kuo M. I, Gunasekaran S, Johnson M, Chen
C. Nuclear Magnetic Resonance Study of Water Mobility in Pasta Filata and Non-Pasta Filata Mozzarella. J. Dairy Sci.; 84:1950–1958: (2001).
16. Scano P, Anedda R, Melis M. P, Dessi M. A, lai A, Roggio T. H- and 13C-NMR Characterization of the Molecular Components of the lipid Fraction of Pecorino Sardo Cheese. J. Am. Oil Chem. Soc.; 88: 1305–1316: (2011). 17. Brescia M. A, Monfreda M, Buccolieri
A, Carrino k. C. Characterisation of the Geographical Origin of Buffalo Milk and Mozzarella Cheese by Means of Analytical and Spectroscopic Determinations. Food Chemistry ; 89: 139–147: (2005).
18. kay, l. E. NMR Studies of Protein Structure and Dynamics. Journal of Magnetic Resonance; 173: 193–207: (2005).
19. Cavanagh J, Fairbrother W. J, Rance M, Skelton N. J. Protein NMR Spectroscopy. Elsevier Academic Press, USA: (2006). 20. Schievano E, Guardini k, Mammi S. Fast
Determination of Histamine in Cheese by Nuclear Magnetic Resonance (NMR). J. Agric. Food Chem.; 57: 2647–2652: (2009). 21. Prema D, Pilfold J. l, krauchi J, Church J. S,
Donkor k. k, Cinel B. Rapid Determination of Total Conjugated linoleic Acid Content in Select Canadian Cheeses by 1H NMR Spectroscopy. J. Agric. Food Chem.; 61: 9915"9921: (2013).
22. Gobet M. S, Guichard E, Moreau C, le Quéré J. Solid-State 31P NMR, a Relevant Method to Evaluate the Distribution of Phosphates in Semi-hard Cheese. Food Analytical Methods; 6(6): 1544-1550: (2013).
J, Vetter W. Two-Dimensional 31P,1H NMR Spectroscopic Profiling of Phospholipids in Cheese and Fish. J. Agric. Food Chem., 61: 7061-7069: (2013).
24. Belton P. S, Colquhoun I. J, kemsley E. k, Delgadillo I, Roma P, Dennis M. J, Sharman M, Holmes E, Nicholsond E. J, Spraule M. Application of Chemometrics to the 1H NMR Spectra of Apple Juices: Discrimination Between Apple Varieties. Food Chemistry, 61(1/2), 207-213: (1998).
25. Gall G. l, Colquhoun I. J, Defernez M. Metabolite Profiling Using 1H NMR Spectroscopy for Quality Assessment of Green Tea, Camellia sinensis (l.). J. Agric. Food Chem., 52: 692-700: (2004).
26. Charlton A. J, Farrington W. H. H, Brereton P. Application of 1H NMR and Multivariate Statistics for Screening Complex Mixtures: Quality Control and Authenticity of Instant Coffee. J. Agric. Food Chem., 50: 3098-3103: (2002).
27. Spyros A, Dais P. Application of 31P NMR Spectroscopy in Food Analysis. 1. Quantitative Determination of the Mono- and Diglyceride Composition of Olive Oils. J. Agric. Food Chem., 48: 802-805: (2000).