Volume 17 Number 6 pp. 553–562 C The Author(s) 2014 doi:10.1017/thg.2014.58
Exposure to Air Pollution From Traffic and
Neurodevelopmental Disorders in Swedish Twins
Tong Gong,1Catarina Almqvist,1,2Sven B ¨olte,3,4Paul Lichtenstein,1Henrik Anckars ¨ater,5Tomas Lind,6 Cecilia Lundholm,1and G ¨oran Pershagen6,7
1Department of Medical Epidemiology and Biostatistics, Karolinska Institutet, Stockholm, Sweden
2Lung and Allergy Unit, Astrid Lindgren Children’s Hospital, Karolinska University Hospital, Stockholm, Sweden 3Department of Women’s and Children’s Health, Center of Neurodevelopmental Disorders (KIND), Karolinska Institutet,
Stockholm, Sweden
4Division of Child and Adolescent Psychiatry, Stockholm County Council, Stockholm, Sweden
5Department of Pharmacology, Institute of Neuroscience and Physiology, Sahlgrenska Academy, University of
Gothenburg, Gothenburg, Sweden
6Center for Occupational and Environmental Medicine, Stockholm County Council, Stockholm, Sweden 7Institute of Environmental Medicine, Karolinska Institutet, Stockholm, Sweden
Background: Recent studies have reported associations between air pollution exposure and neurodevelop-mental disorders in children, but the role of pre- and postnatal exposure has not been elucidated.Aim: We aimed to explore the risk for autism spectrum disorders (ASD) and attention-deficit hyperactivity disorder (ADHD) among children in relation to pre- and postnatal exposure to air pollution from road traffic. Meth-ods: Parents of 3,426 twins born in Stockholm during 1992–2000 were interviewed, when their children were 9 or 12 years old, for symptoms of neurodevelopmental disorders. Residence time-weighted concentra-tions of particulate matter with a diameter<10m (PM10) and nitrogen oxides (NOx) from road traffic were estimated at participants’ addresses during pregnancy, the first year, and the ninth year of life using dis-persion modeling, controlling for seasonal variation. Multivariate regression models were used to examine the association between air pollution exposure and neurodevelopmental outcomes, adjusting for potential confounding factors.Results: No clear or consistent associations were found between air pollution exposure during any of the three time windows and any of the neurodevelopmental outcomes. For example, a 5–95% difference in exposure to NOxduring pregnancy was associated with odds ratios (ORs) of 0.92 (95% confi-dence interval (CI): 0.44–1.96) and 0.90 (95% CI: 0.58–1.40) for ASD and ADHD respectively. A correspond-ing range in exposure to PM10during pregnancy was related to ORs of 1.01 (95% CI: 0.52–1.96) and 1.00 (95% CI: 0.68–1.47) for ASD and ADHD.Conclusions: Our data do not provide support for an association between pre- or postnatal exposure to air pollution from road traffic and neurodevelopmental disorders in children.
Keywords:air pollution, PM10, NOx, autism, ADHD, twins
Neurodevelopmental disorders are relatively common and pose a substantial challenge to society (Froehlich et al.,
2007; Jarbrink et al., 2003; Kogan et al., 2008; Newton,
2012). For some conditions the diagnosis rates have in-creased, but the reasons behind these apparent time trends remain largely unknown. Improved awareness and widened diagnostic criteria may contribute, such as for attention deficit/hyperactivity disorder (ADHD) and autism spec-trum disorders (ASD), but probably do not explain the whole increase. Both ADHD and ASD are childhood-onset chronic conditions of moderate to high heritability (An-ckarsater et al.,2011; Martin et al.,2002; Parr et al.,2011). However, their precise etiologies remain enigmatic, and the
role of environmental factors acting as triggers or contrib-utors to general vulnerability should not be disregarded (Sandin et al.,2014).
Epidemiological and experimental studies indicate that exposure to air pollution from road traffic may induce
RECEIVED4 April 2014;ACCEPTED26 June 2014. First published online 17 September 2014.
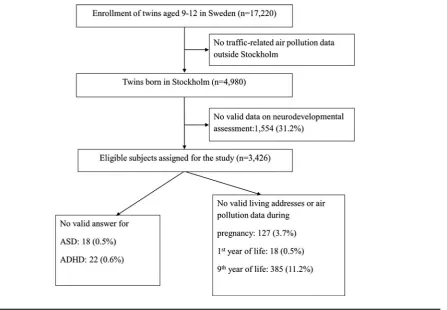
FIGURE 1
Summary of participation and response rates.
systemic inflammation and increase the risk of several dis-eases related to inflammation, such as asthma, allergy, and cardiovascular diseases (Mills et al.,2009; Nordling et al.,
2008; Panasevich et al.,2009). Systemic inflammation can also contribute to neuronal injury and affect the develop-ment of central nervous system (Hagberg & Mallard,2005). Recent epidemiological studies have shown associations be-tween exposure to air pollution from road traffic or other sources and adverse neurodevelopmental effects in children (Becerra et al.,2013; Calderon-Garciduenas et al., 2011; Dix-Cooper et al.,2012; Guxens et al.,2012; Jung et al.,
2013; Morales et al.,2009; Siddique et al.,2011; Volk et al.,
2011, 2013; Vrijheid et al.,2012; Windham et al., 2006). However, more studies are needed to assess causality, par-ticularly since the association may be confounded by socio-economic and socio-demographic characteristics (Bhasin & Schendel,2007; Flouri et al.,2012). Furthermore, it is not known whether there are specific periods of increased vulnerability.
The primary objective of this study was to investigate the relation between exposure to air pollution from road traffic and the risk of neurodevelopmental disorders in children, especially ASD and ADHD. In particular, the influence of exposure during potentially important time windows, such as the fetal and infancy periods, was in focus.
Materials and Methods
Study PopulationChildren from the Child and Adolescent Twin Study in Swe-den (CATSS), an ongoing longitudinal cohort study that targets all twins born in Sweden since July 1, 1992, were the participants (Anckarsater et al.,2011). In this project, the twins born during 1992–2000 were included. Parents of 17,220 9-year-old twins were contacted and interviewed about their children’s somatic and mental health as well as social environment (Figure 1). During the first 3 years of the study, 12-year-old twins were also included. Since the air pollution exposure assessment methodology was restricted to Stockholm County, 4,980 twins born in this area were selected and 3,426 completed neurodevelopmental assess-ment (response rate: 68.8%). The study was approved by the Regional Ethical Review Board in Stockholm, Sweden.
Health Outcome Assessment
Children’s neurodevelopmental outcomes were measured using the Autism-Tics, ADHD, and other Comorbidities inventory (A-TAC) telephone interviews developed at the Institute of Neuroscience and Physiology, Child and Ado-lescent Psychiatry, Gothenburg University (Hansson et al.,
comprehensive tool for screening childhood ASD and other targeted disorders based on the Diagnostic and Statistical Manual of Mental Disorders, Fourth Edition (DSM-IV) cri-teria. Response options for each question were coded as 0 for ‘No,’ 0.5 for ‘Yes,’ to some extent, and 1.0 for ‘Yes’. In two previous validation studies, autistic-like traits were as-sessed by the sum scores of 12 items (based on the DSM-IV criteria) or 17 items (by adding one additional item from the flexibility and two additional items each from the lan-guage and social interaction modules; Larson et al.,2010; Hansson et al., 2005). In order to comprise the primary symptoms of ADHD, scores of 18 (based on the DSM-IV criteria) or 19 items (by adding one additional item from the impulsivity module) were summed. Cut-off values for the sum scores with high sensitivity and specificity from previous validation studies were used in the current study to resemble the probabilities of clinical diagnoses and sever-ity of both diseases: ASDࣙ4.5 for DSM-IV criteria and for the lower cut-off value of extended diagnostic criteria, ASD
ࣙ8.5 for the higher cut-off value of extended diagnostic criteria, ADHDࣙ8 for DSM-IV criteria, and ADHDࣙ6 for the lower and ADHDࣙ12.5 for the higher cut-off val-ues of extended diagnostic criteria. Detailed information on the psychometric properties of the A-TAC is provided elsewhere (Anckarsater et al.,2011; Hansson et al., 2005; Larson et al.,2010).
Exposure Assessment
The air pollution concentrations at residential addresses during mother’s pregnancy, child’s first year of life, and the year before the neurodevelopmental assessment were esti-mated by dispersion models, described in detail elsewhere (Bellander et al.,2001; Gruzieva et al.,2012). Briefly, the res-idential history of the study participants was obtained from taxation authorities and geo-coded using a property regis-ter maintained by the Swedish mapping, cadastral, and land registration authority. The address information was linked with historical emission databases to obtain annual aver-age levels of nitrogen oxides (NOx) and particulate matter (PM) with less than 10m of diameter (PM10). Residence time-weighted NOx and PM10 concentrations related to road traffic emissions were calculated for each trimester and over the mother’s pregnancy period, the child’s first year, and the ninth year of life. Furthermore, daily 24-hour mean NOxand PM10levels from suburban stations were used to calculate the NOx and PM10 levels during each trimester of pregnancy, which were taken into account in sensitivity analyses. Imputation for missing values of NOxand PM10in the trimester-specific analyses was performed using predic-tions from rooftop measurements of both pollutants from a monitoring station in the center of Stockholm.
Other Covariates
Information on gender (male/female), parity (first/ second/third/fourth, or later), gestational age (<37
weeks/ࣙ37 weeks), birth weight (<2,500 g/ࣙ2,500 g), maternal age at birth (<25/25–29/30–34/ࣙ35 years old), maternal smoking during pregnancy (no cigarette/1–9 cigarettes per day/ࣙ10 cigarettes per day) was obtained from the Medical Birth Register (National Board of Health and Welfare, 2003). Using the longitudinal integration database for health insurance and labor market studies (LISA), originally from Statistics Sweden (2013), we ob-tained individual-level socio-economic data such as mater-nal marital status (married or cohabiting/single), parental education (ࣘ9 years/10–12 years/>12 years), and family disposable income during mother’s pregnancy, child’s first year of life, and the ninth year of life with adjustment for inflation and family size. Furthermore, a neighborhood deprivation index was used to estimate area-based socio-economic characteristics in the year of birth (Sariaslan et al.,
2013). Neighborhood was defined by the Small-Area Mar-ket Statistics (SAMS) based on regional population density (Statistics Sweden,2013). Data, including information from Statistics Sweden on welfare beneficiaries, unemployment, immigrants, divorce rate, income, education, residential mobility, and criminal conviction rate were linked with each SAMS unit to calculate a neighborhood deprivation index using principal component analysis. Information on comorbidity with severe chromosome abnormalities, neu-ral tube defects, and other neurological diseases, including epilepsy and cerebral palsy (see Table S1 of the Supple-mentary Material), was obtained through parent-report in CATSS, as well as from the National Patient Register, ac-cording to diagnoses of hospital discharge or outpatient department visits.
Statistical Analysis
Generalized estimating equations (GEE) with exchangeable correlation structure in combination with the Huber–White sandwich estimator for standard errors to adjust for the clustering of observations within twin pairs were used to estimate odds ratios (OR) and 95% confidence intervals (CI) for each neurodevelopmental outcome associated with the 5th to 95th percentile increase in NOx or PM10 on the entire sample (Carlin et al.,2005). We used a directed acyclic graph to determine potential confounders for ORs (Greenland & Brumback,2002). A series of models were run step-wise to assess OR changes by further adjustment for potential confounders; however, only crude and adjusted models, including all potential confounders (p<.20), are presented.
controlling for seasonal effect, and by defining cases of comorbidity with severe chromosome abnormality, neu-ral tube defects, and other neurological diseases, including epilepsy and cerebral palsy (see Table S1). Furthermore, a subset of children whose mothers responded at the inter-view was analyzed to avoid reporting bias among different family members.
The statistic package STATA version 12 (Stata Corp., Col-lege Station, TX, USA) was used for all analyses.
Results
Table 1lists characteristics of the study population. Eligible participants were, on average, aged 10.3 years; 76% of moth-ers did not smoke during pregnancy, and only 6% of the families had less than 9 years of education. Children with neurodevelopmental disorders were predominantly males, more likely to be born in a lower educated family with at least one parent from Scandinavian countries, exposed to maternal smoking during pregnancy, and with diagnosed comorbidity with severe chromosome abnormalities, neu-ral tube defects, and other neurological diseases, includ-ing epilepsy and cerebral palsy. The non-respondinclud-ing twin parents showed some socio-demographic differences com-pared with those included in the analyses, such as younger maternal age, more single mothers, lower parental educa-tion and family income as well as higher neighborhood deprivation.
Figure 2 shows air pollutant levels during pregnancy, and child’s first and ninth years of life. Yearly average lev-els of NOxfrom local traffic dropped from 12.7g/m3to 5.4g/m3during the observation period, which is reflected in reduced levels from pregnancy/infancy to the ninth year of life. On the other hand, the yearly average levels of PM10 were relatively constant (3.3–4.2g/m3). NOxwas closely correlated to PM10 (all p-values < .001,r2 > 0.7) when comparing with the study period as both have local traffic as the major source of air pollution. However, there were only moderate correlations (allp-values<.001,r2<0.4) between pollutants during the ninth year of life and other study periods (see Figures S1a and S1b in the Supplemen-tary Material).
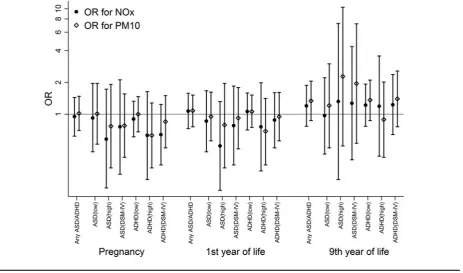
The risks of ASD and ADHD using different cut-off val-ues were not consistently associated with exposure to NOx or PM10at any age (Figure 3andTable 2). For example, ex-posure to NOxduring the first year of life was not associated with ASD (OR: 0.86, 95% CI: 0.44–1.67) or ADHD (OR: 1.06, 95% CI: 0.71–1.59) after adjusting for child gender, parity, and other relevant covariates. Similarly, exposure to PM10during the first year of life was not related to ASD (OR: 0.95, 95% CI: 0.56–1.62) or ADHD (OR: 1.06, 95% CI: 0.75–1.52). A lack of association was also observed for expo-sure to air pollution during pregnancy. Results were similar using the dimensional outcomes for ASD and ADHD (data not shown). It should be noted that there was a substantial
overlap between the diagnoses; for example, 82 of the 109 children with ASD also had ADHD.
When exposure to air pollutants for each trimester of the pregnancy controlling for seasonal effect and during the child’s ninth year of life was evaluated separately, simi-lar findings were found with no consistent associations for most neurodevelopmental outcomes related to traffic–air pollutant levels (Tables S2–S5 of the Supplementary Mate-rial). However, it is noteworthy that an inverse relation was observed between air pollution exposure during the 2nd and 3rd trimesters and ASD, as well as ADHD, using cut-off values based on the DSM-IV criteria. We also did a sensitiv-ity analysis by redefining cases comorbid with chromosome abnormality or neurological diseases (Table S6 of the Sup-plementary Material). The ORs in those analyses tended to be lower, but still no statistically significant association was found. In sub-analyses, we assessed all twins whose mothers answered the telephone interview from CATSS, and simi-lar findings were found for all outcomes (Table S7 of the Supplementary Material).
Discussion
This study did not indicate an association between exposure to NOxor PM10from traffic during pregnancy or the 1st year of life and neurodevelopmental disorders in children. For specific subgroups and diagnoses, there were some as-sociations but no consistent patterns were evident. This also holds true for analyses related to exposure during certain time windows.
There is limited evidence on air pollution exposure and neurodevelopmental disorders in children (Becerra et al.,
2013; Calderon-Garciduenas et al.,2011; Dix-Cooper et al.,
2012; Guxens et al.,2012; Jung et al.,2013; Morales et al.,
2009; Siddique et al.,2011; Volk et al.,2011;2013; Vrijheid et al.,2012; Windham et al.,2006). Windham et al. (2006) reported a positive relation between the distribution of haz-ardous air pollutants at birth addresses and ASD among children in California. Other studies in California found that living close to freeways and traffic-related air pollution in mother’s late pregnancy or child’s first year of life was as-sociated with an increased risk for autism (Volk et al.,2011,
2013). Siddique et al. (2011) compared children living in the New Delhi (India) urban area with children living in rural areas and showed that ADHD was positively correlated with current PM10levels. Air pollutants may induce systematic inflammation, which could be a possible mechanism me-diating these effects (Block & Calderon-Garciduenas,2009; Calderon-Garciduenas et al.,2008).
TABLE 1
Child and Family Characteristics in 9- and 12-Year-Old Twins Born in Stockholm
Non-Total Healthy ASDa pc ADHDa pc respondents
N (%) 3,426 3,051 (89.1) 109 (3.2) 328 (9.6) 1,554
Missing in neurodevelopmental outcomes 18 22
-Child age at interview for respondents/till year 2011
for non-respondents (mean±SD)
10.3±1.5 10.3±1.5 10.6±1.6 10.3±1.5 14.7±2.5
Respondent
Biological mother 2,960 (86.4) 2,639 (86.5) 91 (83.5) ‡ 281 (85.7) –
Biological father 450 (13.1) 401 (13.1) 14 (12.8) 43 (13.1) –
Others 16 (0.5) 11 (0.4) 4 (3.7) 4 (1.2) –
Gender
Male 1,756 (51.3) 1,510 (49.5) 80 (73.4) ‡ 216 (65.9) ‡ 733 (47.2)
Female 1,670 (48.7) 1,541 (50.5) 29 (26.6) 112 (34.2) 704 (45.3)
Parity
First 791 (23.1) 703 (23.0) 30 (27.5) 80 (24.4) 264 (17.0)
Second 1,436 (41.9) 1,290 (42.3) 40 (36.7) 126 (38.4) 570 (36.7)
Third 845 (24.7) 755 (24.8) 24 (22.0) 80 (24.4) 408 (26.3)
Fourth or later 354 (10.3) 303 (9.9) 15 (13.8) 42 (12.8) 195 (12.5)
Zygosity
Monozygosity 1,380 (40.3) 1,236 (40.5) 44 (40.4) 129 (39.3) –
Dizygosity 1,742 (50.8) 1,551 (50.8) 58 (53.2) 166 (50.6) –
Missing 304 (8.9) 264 (8.7) 7 (6.4) 33 (10.1) –
Low gestation age (<37 weeks)
Yes 1,360 (39.7) 1,193 (39.1) 55 (50.5) ‡ 145 (44.2) † 641 (41.2)
No 2,046 (59.7) 1,844 (60.4) 51 (46.8) 177 (54.0) 783 (50.4)
Missing 20 (0.6) 14 (0.5) 3 (2.7) 6 (1.8) 130 (8.4)
Low birth weight (<2,500 g)
Yes 1,287 (37.6) 1,129 (37.0) 48 (44.0) 138 (42.1) 620 (39.9)
No 2,082 (60.8) 1,868 (61.2) 60 (55.1) 187 (57.0) 792 (51.0)
Missing 57 (1.7) 54 (1.8) 1 (0.9) 3 (0.9) 142 (9.1)
Maternal age (mean±SD) 31.6±4.6 31.6±4.6 31.1±5.2 31.1±4.9 † 30.4±5.1
<25 years 234 (6.8) 197 (6.5) 7 (6.4) ‡ 34 (10.4) † 184 (11.8)
ࣙ25 and<30 years 838 (24.5) 737 (24.2) 39 (35.8) 89 (27.1) 418 (26.9)
ࣙ30 and<35 years 1,392 (40.6) 1,266 (41.5) 36 (33.0) 110 (33.5) 521 (33.5)
ࣙ35 years 962 (28.1) 851 (27.9) 27 (24.8) 95 (29.0) 314 (20.2)
Maternal smoking during pregnancy
No 2,591 (75.6) 2,334 (76.5) 77 (70.6) 220 (67.1) ‡ 1,041 (67.0)
Yes, 1–9 cigarettes/day 256 (7.5) 212 (7.0) 12 (11.0) 41 (12.5) 116 (7.5)
Yes,ࣙ10 cigarettes/day 164 (4.8) 132 (4.3) 8 (7.3) 29 (8.8) 77 (5.0)
Missing 415 (12.1) 373 (12.2) 12 (11.0) 38 (11.6) 320 (20.6)
Maternal marital status at birth year
Married or cohabiting 3,140 (91.6) 2,805 (91.9) 92 (84.4) † 297 (90.6) † 1,258 (81.0)
Single 270 (7.9) 231 (7.6) 17 (15.6) 30 (9.2) 165 (10.6)
Missing 16 (0.5) 15 (0.5) 0 1 (0.3) 131 (8.4)
Maternal marital status during child’s 9th year of life
Married or cohabiting 2,700 (78.8) 2,431 (79.7) 78 (71.6) 238 (72.6) † 957 (61.6)
Single 604 (17.6) 510 (16.7) 26 (23.9) 79 (24.1) 350 (22.5)
Missing 122 (3.6) 110 (3.6) 5 (4.6) 11 (3.3) 247 (15.9)
Parental ethnicity Either one parent from
Scandinavian countries 3,168 (92.5) 2,823 (92.5) 103 (94.5) 309 (94.2) –
Both parents from other countries 258 (7.5) 228 (7.5) 6 (5.5) 19 (5.8) –
Highest education by either parent (pregnancy)
Low (ࣘ9 years) 218 (6.4) 183 (6.0) 17 (15.6) ‡ 31 (9.5) ‡ 179 (11.5)
Middle (10–12 years) 1,382 (40.3) 1,191 (39.0) 58 (53.2) 167 (50.9) 541 (34.8)
High(>12 years) 1,695 (49.5) 1,566 (51.3) 28 (25.7) 115 (35.1) 543 (34.9)
Missing 131 (3.8) 111 (3.6) 6 (5.5) 15 (4.6) 291 (18.7)
Highest education by either parent (1st year of life)
Low (ࣘ9 years) 136 (4.0) 114 (3.7) 9 (8.3) ‡ 20 (6.1) ‡ 145 (9.3)
Middle (10–12 years) 1,284 (37.5) 1,092 (35.8) 60 (55.1) 170 (51.8) 545 (35.1)
High(>12 years) 1,891 (55.2) 1,744 (57.2) 36 (33.0) 127 (38.7) 593 (38.2)
Missing 115 (3.4) 101 (3.3) 4 (3.7) 11 (3.4) 271 (17.4)
Highest education by either parent (9th year of life)
Low (ࣘ9 years) 136 (4.0) 113 (3.7) 9 (8.3) ‡ 21 (6.4) ‡ 160 (10.1)
Middle (10–12 years) 1,210 (35.3) 1,026 (33.6) 57 (52.3) 161 (49.1) 565 (37.9)
High(>12 years) 2,043 (59.6) 1,880 (61.6) 41 (37.6) 143 (43.6) 598 (41.2)
Missing 37 (1.1) 32 (1.1) 2 (1.8) 3 (0.9) 231 (14.9)
NPI at birth (mean±SD) -0.1±1.0 -0.1±1.0 0.1±1.2 0.0±1.1 † 0.3±1.4
NPI during 9th year of life (mean±SD) -0.3±0.9 -0.3±0.9 -0.2±1.1 -0.2±0.8 † 0.1±1.2
Individualized income during mother’s pregnancy
(mean±SD, 1000 SEK)
TABLE 1 Continued.
Non-Total Healthy ASDa pc ADHDa pc respondents
Individualized income during child’s 9th year of life
(mean±SD, 1000 SEK)
162.0±228.9 164.5±240.6 134.5±62.6 141.1±88.5 149.6±197.8
Comorbidityb
Yes 120 (3.5) 59 (1.9) 44 (40.4) ‡ 48 (14.6) ‡ 75 (4.8)
No 3,306 (96.5) 2,992 (98.1) 65 (59.6) 280 (85.4) 1,479 (95.2)
Note: ASD=Autism Spectrum Disorders; ADHD=Attention Deficit/Hyperactivity Disorders; NPI=Neighborhood Deprivation Index;SD=standard
deviation; SEK=Swedish kronor.
aCut-off values of disorders from extended diagnostic criteria: ASD=4.5 and ADHD=6.0.
bComorbidity-included co-occurrence with severe chromosome abnormalities, malformations of brain, epilepsy, cerebral palsy, and other neurological
disorders. Detailed information on diagnosis codes is listed in Table S1 in supplemental materials.
cThep-values were presented comparing ASD/ADHD individuals with the ones with neither ASD nor ADHD.
†p<.05;‡p<.001.
FIGURE 2
Box plot describing the distribution of log-transformed NOx (white) and PM10 (gray) concentrations (g/m3) from local traffic in study population from mother’s pregnancy to child’s ninth year of life. Labels of each scale unit on concentration levels (y-axis) were back-transformed. The box and whiskers denoted the 5th, 25th, 50th, 75th, 95th percentile and outlier values of pollutants’ distributions.
contribute to the absence of an association and make it dif-ficult to compare with other study settings. For example, the local traffic-related PM10 concentrations during partici-pants’ first year of life in Stockholm was only 3.9g/m3 and the long-range transported PM10in this part of Swe-den has a yearly average level of around 10g/m3(Gidhagen et al.,2013). The roof top levels for PM10in central Stock-holm have been relatively constant during 1994–2012 (Bur-man & Nor(Bur-man,2013). However, these levels are consider-ably lower than in the study areas of California described above (mean value at 25±7.2 g/m3 in one study and 36.3±6.1g/m3in another study; Becerra et al.,2013; Volk et al.,2013). Furthermore, associations may exist between the socio-economic status at individual or neighborhood
level and the risk for neurodevelopmental or behavioral problems (Bhasin & Schendel,2007; Flouri et al., 2012). Maternal smoking correlates with socio-economic factors such as education and income (Kabir et al.,2011; Laakso-nen et al.,2005) and may contribute to this association. The earlier studies (Calderon-Garciduenas et al.,2011; Guxens et al., 2012; Siddique et al., 2011; Volk et al., 2011; Vri-jheid et al., 2012; Windham et al.,2006) did not always adjust for neighborhood deprivation as well as individual socio-economic characteristics and smoking during preg-nancy, which suggests that there could be some residual confounding.
FIGURE 3
Odds ratios and 95% confidence intervals of neurodevelopmental outcomes by residential address-based NOx(black circles) and PM10 (black hollow diamonds) levels. The spikes represent odds ratios for outcomes of interest and cap lines indicate 95% confidence intervals.
using cut-off values based on the DSM-IV criteria. Even though the sample size was relatively large with 3,426 par-ticipants, the number of children who scored above the cut-off values for some neurodevelopmental outcomes was low, contributing to the statistical uncertainty of risk estimates. Strengths of the study include a population-based sam-ple of twins and data linkage to Swedish national registries, which include baseline birth-related and socio-economic information before disease onset. Second, we investigated both ADHD and ASD because of the high degree of co-morbidity between the two conditions. Furthermore, we analyzed neurodevelopmental disorders categorically based on the DSM-IV criteria and the additional cut-off values according to previous validation studies (Hansson et al.,
2005; Larson et al., 2010). Third, we included different trimesters during pregnancy, first year, and the ninth year of life using the validated dispersion modeling together with data on road traffic emissions, while previous studies re-ported effects from either pre- or postnatal air pollution exposures.
There are also several potential limitations of the study. One is that the occurrence of neurodevelopmental out-comes may have differed in children participating in CATSS with completed A-TAC assessment and those in the general population. Two Swedish studies found that children of immigrant parents had impaired psychological health
(Gill-berg et al.,1987; Magnusson et al.,2012; Van Leeuwen et al.,
2012); however, the occurrence of neurodevelopmental dis-orders in our study was lower in families with both parents from outside of Scandinavian countries. The data linkage to other registers allowed us to acquire additional data on the CATSS non-responders, which indicated that children enrolled in the study had higher familial socio-economic status. Another possible limitation is the assessment of neu-rodevelopmental outcomes, which might have created some misclassification (Ragland, 1992). Earlier studies mostly attempted to evaluate outcomes as discrete scores; how-ever, our data were highly skewed on all outcomes. Our power was limited for the analyses of sub-dimensional ASD/ADHD measures. Furthermore, for the exposure time measured during child’s ninth year of life, the air pollution assessment may actually have occurred after the onset of disease.
Conclusions
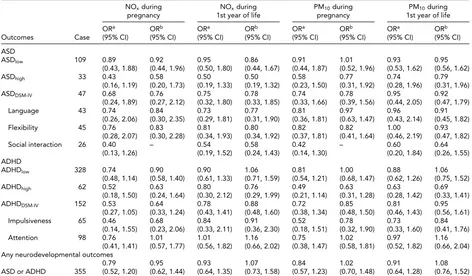
TABLE 2
Crude and Adjusted ORs of Neurodevelopmental Disorders for Twins Born in Stockholm, by Exposure to NOxand PM10From Mother’s Pregnancy to First Year of Life
NOxduring NOxduring PM10during PM10during
pregnancy 1st year of life pregnancy 1st year of life
ORa ORb ORa ORb ORa ORb ORa ORb
Outcomes Case (95% CI) (95% CI) (95% CI) (95% CI) (95% CI) (95% CI) (95% CI) (95% CI)
ASD
ASDlow 109 0.89 0.92 0.95 0.86 0.91 1.01 0.93 0.95
(0.43, 1.88) (0.44, 1.96) (0.50, 1.80) (0.44, 1.67) (0.44, 1.87) (0.52, 1.96) (0.53, 1.62) (0.56, 1.62)
ASDhigh 33 0.43 0.58 0.50 0.50 0.58 0.77 0.74 0.79
(0.16, 1.19) (0.20, 1.73) (0.19, 1.33) (0.19, 1.32) (0.23, 1.50) (0.31, 1.92) (0.28, 1.96) (0.31, 1.96)
ASDDSM-IV 47 0.68 0.76 0.75 0.78 0.74 0.78 0.95 0.92
(0.24, 1.89) (0.27, 2.12) (0.32, 1.80) (0.33, 1.85) (0.33, 1.66) (0.39, 1.56) (0.44, 2.05) (0.47, 1.79)
Language 43 0.74 0.84 0.73 0.77 0.81 0.97 0.96 0.91
(0.26, 2.06) (0.30, 2.35) (0.29, 1.81) (0.31, 1.90) (0.36, 1.81) (0.63, 1.47) (0.43, 2.14) (0.45, 1.82)
Flexibility 45 0.76 0.83 0.81 0.80 0.82 0.82 1.00 0.93
(0.28, 2.07) (0.30, 2.28) (0.34, 1.93) (0.34, 1.92) (0.37, 1.81) (0.41, 1.64) (0.46, 2.19) (0.47, 1.82)
Social interaction 26 0.40 – 0.54 0.58 0.42 – 0.60 0.64
(0.13, 1.26) (0.19, 1.52) (0.24, 1.43) (0.14, 1.30) (0.20, 1.84) (0.26, 1.55)
ADHD
ADHDlow 328 0.74 0.90 0.90 1.06 0.81 1.00 0.88 1.06
(0.48, 1.14) (0.58, 1.40) (0.61, 1.33) (0.71, 1.59) (0.54, 1.21) (0.68, 1.47) (0.62, 1.26) (0.75, 1.52)
ADHDhigh 62 0.52 0.63 0.80 0.76 0.49 0.63 0.63 0.69
(0.18, 1.50) (0.24, 1.64) (0.30, 2.12) (0.29, 1.99) (0.21, 1.14) (0.31, 1.28) (0.28, 1.42) (0.33, 1.41)
ADHDDSM-IV 152 0.53 0.64 0.78 0.88 0.72 0.85 0.81 0.95
(0.27, 1.05) (0.33, 1.24) (0.43, 1.41) (0.48, 1.60) (0.38, 1.34) (0.48, 1.50) (0.46, 1.43) (0.56, 1.61)
Impulsiveness 65 0.46 0.68 0.84 0.91 0.52 0.78 0.73 0.84
(0.14, 1.55) (0.23, 2.06) (0.33, 2.11) (0.36, 2.30) (0.18, 1.51) (0.32, 1.90) (0.33, 1.60) (0.41, 1.76)
Attention 98 0.76 1.01 1.01 1.16 0.75 1.02 0.97 1.16
(0.41, 1.41) (0.57, 1.77) (0.56, 1.82) (0.66, 2.02) (0.38, 1.47) (0.58, 1.81) (0.52, 1.82) (0.66, 2.04)
Any neurodevelopmental outcomes
0.79 0.95 0.93 1.07 0.84 1.02 0.91 1.08
ASD or ADHD 355 (0.52, 1.20) (0.62, 1.44) (0.64, 1.35) (0.73, 1.58) (0.57, 1.23) (0.70, 1.48) (0.64, 1.28) (0.76, 1.52)
Note: ASD=Autism Spectrum Disorders; ADHD=Attention Deficit/Hyperactivity Disorders; DSM-IV=Diagnostic and Statistical Manual of Mental Disorders
(4th edition); OR=odds ratio; CI=confidence interval.
aEstimates based on crude models.
bModels adjusted for parity, gender, maternal age during pregnancy, maternal smoking during pregnancy, maternal marital status at birth year, parental
education, family income, and neighborhood deprivation at birth year.
Acknowledgments
Financial support was provided through the Swedish Research Council for Health, Working Life and Wel-fare (FORTE 2012-0573), the Swedish Research Council (VR) 2011-3060, VR in partnership with FORTE, FOR-MAS, and VINNOVA (cross-disciplinary research pro-gram concerning children’s and young people’s mental health), VR through the Swedish Initiative for Research on Microdata in the Social and Medical Sciences (SIM-SAM) framework, grant No. 340-2013-5867, HKH Kro-nprinsessan Lovisas f¨orening f¨or barnasjukv˚ard, and the Strategic Research Program in Epidemiology at Karolinska Institutet.
Supplementary Material
To view the supplementary material for this article, please visithttp://dx.doi.org/10.1017/thg.2014.58.
References
Anckarsater, H., Lundstrom, S., Kollberg, L., Kerekes, N., Palm, C., Carlstrom, E., . . . Lichtenstein, P. (2011). The child and
adolescent twin study in Sweden (CATSS).Twin Research and Human Genetics,14, 495–508.
Becerra, T. A., Wilhelm, M., Olsen, J., Cockburn, M., & Ritz, B. (2013). Ambient air pollution and autism in Los Angeles county, California.Environmental Health Perspectives,121, 380–386.
Bellander, T., Berglind, N., Gustavsson, P., Jonson, T., Nyberg, F., Pershagen, G., . . . Jarup, L. (2001). Using geographic in-formation systems to assess individual historical exposure to air pollution from traffic and house heating in Stock-holm.Environmental Health Perspectives,109, 633–639. Bhasin, T. K., & Schendel, D. (2007). Socio-demographic risk
factors for autism in a US metropolitan area. Journal of Autism and Developmental Disorders,37, 667–677. Block, M. L., & Calderon-Garciduenas, L. (2009). Air
pollu-tion: Mechanisms of neuroinflammation and CNS disease. Trends in Neurosciences,32, 506–516.
Burman, L., & Norman, M. (2013).The air quality in Stock-holm: Annual report 2012.Retrieved February 7, 2014, from http://www.slb.nu/slb/rapporter/pdf8/slb2013 005.pdf Calderon-Garciduenas, L., Engle, R., Mora-Tiscareno, A.,
inflammation in clinically healthy children.Brain and Cog-nition,77, 345–355.
Calderon-Garciduenas, L., Solt, A. C., Henriquez-Roldan, C., Torres-Jardon, R., Nuse, B., Herritt, L., . . . Reed, W. (2008). Long-term air pollution exposure is associated with neu-roinflammation, an altered innate immune response, dis-ruption of the blood-brain barrier, ultrafine particulate de-position, and accumulation of amyloid beta-42 and alpha-synuclein in children and young adults.Toxicologic Pathol-ogy,36, 289–310.
Carlin, J. B., Gurrin, L. C., Sterne, J. A., Morley, R., & Dwyer, T. (2005). Regression models for twin studies: A critical re-view.International Journal of Epidemiology,34, 1089–1099. Dix-Cooper, L., Eskenazi, B., Romero, C., Balmes, J., & Smith, K. R. (2012). Neurodevelopmental performance among school age children in rural Guatemala is associated with prenatal and postnatal exposure to carbon monoxide, a marker for exposure to woodsmoke.Neurotoxicology, 33, 246–254.
Flouri, E., Mavroveli, S., & Tzavidis, N. (2012). Cognitive abil-ity, neighborhood deprivation, and young children’s emo-tional and behavioral problems.Social Psychiatry and Psy-chiatric Epidemiology,47, 985–992.
Froehlich, T. E., Lanphear, B. P., Epstein, J. N., Barbaresi, W. J., Katusic, S. K., & Kahn, R. S. (2007). Prevalence, recogni-tion, and treatment of attention-deficit/hyperactivity dis-order in a national sample of US children.Archives of Pedi-atrics & Adolescent Medicine,161, 857–864.
Gidhagen, L., Omstedt, G., Pershagen, G., Willers, S., & Bellander, T. (2013). High-resolution modeling of residen-tial outdoor particulate levels in Sweden. Journal of Ex-posure Analysis and Environmental Epidemiology,23, 306– 314.
Gillberg, C., Steffenburg, S., Borjesson, B., & Andersson, L. (1987). Infantile autism in children of immigrant parents. A population-based study from Goteborg, Sweden.British Journal of Psychiatry,150, 856–858.
Greenland, S., & Brumback, B. (2002). An overview of relations among causal modelling methods.International Journal of Epidemiology,31, 1030–1037.
Gruzieva, O., Bellander, T., Eneroth, K., Kull, I., Melen, E., Nordling, E., . . . Pershagen, G. (2012). Traffic-related air pollution and development of allergic sensitization in chil-dren during the first 8 years of life.Journal of Allergy and Clinical Immunology,129, 240–246.
Guxens, M., Aguilera, I., Ballester, F., Estarlich, M., Fernandez-Somoano, A., Lertxundi, A., . . . INMA Project. (2012). Pre-natal exposure to residential air pollution and infant mental development: Modulation by antioxidants and detoxifica-tion factors.Environmental Health Perspectives,120, 144– 149.
Hagberg, H., & Mallard, C. (2005). Effect of inflammation on central nervous system development and vulnerability. Current Opinion in Neurology,18, 117–123.
Hansson, S. L., Svanstrom Rojvall, A., Rastam, M., Gillberg, C., Gillberg, C., & Anckarsater, H. (2005). Psychiatric telephone interview with parents for screening of child-hood autism — Tics, attention-deficit hyperactivity
disor-der and other comorbidities (A-TAC): Preliminary relia-bility and validity.British Journal of Psychiatry,187, 262– 267.
Jarbrink, K., Fombonne, E., & Knapp, M. (2003). Measuring the parental, service and cost impacts of children with autis-tic spectrum disorder: A pilot study.Journal of Autism and Developmental Disorders,33, 395–402.
Jung, C. R., Lin, Y. T., & Hwang, B. F. (2013). Air pollution and newly diagnostic autism spectrum disorders: A population-based cohort study in Taiwan.PLoS One,8, e75510. Kabir, Z., Connolly, G. N., & Alpert, H. R. (2011). Secondhand
smoke exposure and neurobehavioral disorders among chil-dren in the United States.Pediatrics,128, 263–270. Kogan, M. D., Strickland, B. B., Blumberg, S. J., Singh, G. K.,
Perrin, J. M., & van Dyck, P. C. (2008). A national profile of the health care experiences and family impact of autism spectrum disorder among children in the United States, 2005–2006.Pediatrics,122, e1149–e1158.
Laaksonen, M., Rahkonen, O., Karvonen, S., & Lahelma, E. (2005). Socio-economic status and smoking: Analysing in-equalities with multiple indicators.European Journal of Pub-lic Health,15, 262–269.
Larson, T., Anckarsater, H., Gillberg, C., Stahlberg, O., Carlstrom, E., Kadesjo, B., . . . Gillberg, C. (2010). The Autism — Tics, AD/HD and other Comorbidities Inven-tory (A-TAC): Further validation of a telephone interview for epidemiological research.BMC Psychiatry,10, 1. Magnusson, C., Rai, D., Goodman, A., Lundberg, M., Idring,
S., Svensson, A., . . . Dalman, C. (2012). Migration and autism spectrum disorder: Population-based study.British Journal of Psychiatry,201, 109–115.
Martin, N., Scourfield, J., & McGuffin, P. (2002). Observer ef-fects and heritability of childhood attention-deficit hyper-activity disorder symptoms.British Journal of Psychiatry, 180, 260–265.
Mills, N. L., Donaldson, K., Hadoke, P. W., Boon, N. A., MacNee, W., Cassee, F. R., . . . Newby, D. E. (2009). Ad-verse cardiovascular effects of air pollution.Nature Clinical Practice Cardiovascular Medicine,6, 36–44.
Morales, E., Julvez, J., Torrent, M., de Cid, R., Guxens, M., Bustamante, M., . . . Sunyer, J. (2009). Association of early-life exposure to household gas appliances and indoor ni-trogen dioxide with cognition and attention behavior in preschoolers.American Journal of Epidemiology,169, 1327– 1336.
National Board of Health and Welfare. (2003).The Swedish medical birth register: A summary of content and qual-ity. Retrieved January 27, 2014, from http://www.sos.se/ fulltext/112/2003-112-3/2003-112-3.pdf
Newton, C. R. (2012). Neurodevelopmental disorders in low-and middle-income countries.Developmental Medicine & Child Neurology,54, 1072.
Nordling, E., Berglind, N., Melen, E., Emenius, G., Hallberg, J., Nyberg, F., . . . Bellander, T. (2008). Traffic-related air pollution and childhood respiratory symptoms, function and allergies.Epidemiology,19, 401–408.
Associations of long- and short-term air pollution exposure with markers of inflammation and coagulation in a pop-ulation sample.Occupational and Environmental Medicine, 66, 747–753.
Parr, J. R., Le Couteur, A., Baird, G., Rutter, M., Pickles, A., Fombonne, E., . . . International Molecular Genetic Study of Autism Consortium, Members. (2011). Early develop-mental regression in autism spectrum disorder: Evidence from an international multiplex sample.Journal of Autism and Developmental Disorders,41, 332–340.
Ragland, D. R. (1992). Dichotomizing continuous outcome variables: Dependence of the magnitude of association and statistical power on the cutpoint.Epidemiology,3, 434–440. Sandin, S., Lichtenstein, P., Kuja-Halkola, R., Larsson, H., Hultman, C. M., & Reichenberg, A. (2014). The familial risk of autism.JAMA: The Journal of the American Medical Association,311, 1770–1777.
Sariaslan, A., Langstrom, N., D’Onofrio, B., Hallqvist, J., Franck, J., & Lichtenstein, P. (2013). The impact of neigh-bourhood deprivation on adolescent violent criminality and substance misuse: A longitudinal, quasi-experimental study of the total Swedish population.International Journal of Epidemiology,42, 1057–1066.
Siddique, S., Banerjee, M., Ray, M. R., & Lahiri, T. (2011). Attention-deficit hyperactivity disorder in children
chroni-cally exposed to high level of vehicular pollution.European Journal of Pediatrics,170, 923–929.
Statistics Sweden. (2013). Post codes and SAMS atlas. Re-trieved October 8, 2013, from http://www.scb.se/Pages/ Standard 333368.aspx
Van Leeuwen, W., Nilsson, S., & Merlo, J. (2012). Mother’s country of birth and prescription of psychotropic medica-tion in Swedish adolescents: a life course approach.BMJ Open,2.
Volk, H. E., Hertz-Picciotto, I., Delwiche, L., Lurmann, F., & McConnell, R. (2011). Residential proximity to freeways and autism in the CHARGE study.Environmental Health Perspectives,119, 873–877.
Volk, H. E., Lurmann, F., Penfold, B., Hertz-Picciotto, I., & McConnell, R. (2013). Traffic-related air pollution, partic-ulate matter, and autism.JAMA Psychiatry,70, 71–77. Vrijheid, M., Martinez, D., Aguilera, I., Bustamante, M.,
Ballester, F., Estarlich, M., . . . Project, INMA. (2012). In-door air pollution from gas cooking and infant neurodevel-opment.Epidemiology,23, 23–32.