R -Tree for Phase Change Memory
Elkhan Jabarov1Byung-Won On2?Gyu Sang Choi3and Myong-Soon Park4?
1 Computer and Radio Communications Department, Korea University
Seoul, Republic of Korea {ejabarov, myongsp}@korea.ac.kr
2
Department of Statistics and Computer Science, Kunsan National University Kunsan, Republic of Korea
3
Department of Information & Communication Engineering, Yeungnam University Yeungnam, Republic of Korea
Abstract. Nowadays, many applications use spatial data for instance-location in-formation, so storing spatial data is important. We suggest using R -Tree over PCM. Our objective is to design a PCM-sensitive R -Tree that can store spatial data as well as improve the endurance problem. Initially, we examine how R -Tree causes endurance problems in PCM, and we then optimize it for PCM. We propose dou-bling the leaf node size, writing a split node to a blank node, updating parent nodes only once and not merging the nodes after deletion when the minimum fill factor re-quirement does not meet. Based on our experimental results while using benchmark dataset, the number of write operations to PCM in average decreased by 56 times by using the proposed R -Tree. Moreover, the proposed R -Tree scheme improves the performance in terms of processing time in average 23% compared to R -Tree. Keywords:spatial database, spatial data, PCM, R -Tree, spatial tree, endurance, indexing algorithm.
1.
Introduction
Nowadays, most enterprises use DRAM for in-memory databases for fast decision sup-port. DRAM needs periodic backup to prevent data loss, because it is a volatile memory. Phase change memory (PCM) is a byte-addressable storage system that is two to four times denser than DRAM and has better read latency than NAND Flash memory [2, 6]. While PCM’s endurance is 10 times better than NAND Flash memory, unlike DRAM, it is still limited to106times per PCM cell.
In this paper, we propose a new R -Tree scheme using PCM for the spatial data be-cause of its outstanding properties, except for the endurance problem, which we are going to improve in this paper. Many wear-leveling methods have been proposed for NAND Flash memory; however, they are not appropriate for PCM. The foremost reason is that PCM is byte-addressable, but NAND Flash memory is page addressable. Thus, the key goal of this paper is to reduce the number of write operations, through which we will keep PCM cells alive as long as possible, improve the endurance problem and also improve the performance in terms of processing time.
?
B+ -Tree - the most used index structure algorithm - has already been optimized for PCM [3–5]. At present, it is used more frequently than before in smartphones, Google Earth, T-map, global positioning systems (GPSs), etc. However, location information can-not be handled well by B+ Tree. R -Tree is similar to B+ -Tree in the k dimension, capable of storing “spatial” information, such as geographic coordinates and multi-dimensional objects. So, we propose using R -Tree on PCM in order to improve the endurance problem, as well as to give it the ability to store multi-dimensional data for in-memory databases.
R -Tree groups nearby objects and represents them with minimum bounding rectan-gles (MBRs) in the next higher level of the tree. R -Tree consumes a lot of writes during insertion and deletion and in maintaining the consistency of the tree. This paper designs a PCM-aware R -Tree that is efficient at storing spatial data.
Primarily, we find out whether R -Tree causes endurance problems by inserting a syn-thetically developed three-million-piece dataset, as well as measuring the performance in terms of processing time for insertion, search, and deletion. The experiment results show that the number of writes to some PCM cells are much higher than to others, meaning those cells will expire earlier. In this project, we make the following contributions.
– Our analysis shows that the number of writes rises when elements within a node are sorted for a split. Sorting the elements within a node is needed to find the proper split point. Moreover, this process has a negative effect on the performance of the system. We propose to increase the leaf node size, compared to intermediate nodes, which will postpone the Split operation. This will decrease the number of writes, as well as improve performance.
– The number of writes increases when the elements within the node are sorted for split, and the nodes that frequently split have much higher number of writes than others. Reducing the number of writes among all PCM cells is essential to increasing lifetime of PCM. We propose replacing the split node with a blank node when the node splits, and rewriting elements from the split node to a newly created node. The blank node will be the one with the minimum number of writes. Although this technique requires one extra write, in practice, it equally distributes the number of writes to memory cells.
– Moreover, updating a parent node to maintain the consistency of the tree structure downgrades endurance. We discovered that R -Tree updates parent nodes by com-paring each child with parent nodes one by one, and if necessary, updates the parent nodes sequentially. So, we propose writing to the parent nodes only once, after com-paring all child-node MBRs, which will significantly reduce the number of writes. – It may be very early to merge nodes if the node is just less than half full. In proposed
scheme the nodes do not merge if the minimum fill factor requirement does not meet after deletion.
– We propose a novel PCM-aware R -Tree algorithm by applying the techniques pre-sented above.
– Our evaluation results verify that the proposed R -Tree scheme decreases the number of writes by at least five times, and improves performance in terms of processing time.
sig-nificantly with this endurance problem by reducing the number of PCM writes, and in addition, improves performance.
The rest of this paper is organized as follows. In Section 2, we present background for PCM and R -Tree variants and related works. In Section 3, we explain our PCM-aware R -Tree. In the subsequent section, we show the results of our performance evaluation. Finally, we end the paper with a conclusion that suggests future work.
2.
Background and Related Work
2.1. PCM
Various non-volatile memories exist, such as MRAM, ReRAM, STT-RAM, etc. MRAM and STT-RAM do not have endurance limitations, and the endurance of ReRAM is much higher than that of PCM. Because of the low endurance of PCM, R -Tree could not be directly implemented on PCM as an alternative to DRAM. Table 1 presents a list of pa-rameters, such as type, minimum access unit, read and write latencies, endurance and energy consumption for read and write operations, and density for DRAM, PCM, NAND Flash memory, and HDD. The technical parameters of PCM are better than NAND Flash memory and HDD (except that HDD, like DRAM, has unlimited endurance). The main disadvantage of NAND Flash memory is that its minimum access unit is the page, so to update a few bytes, a whole page must be rewritten. This is an enormous weakness for a storage system with a limited number of writes. Additionally, the endurance of NAND Flash memory is 10 times weaker than PCM.
Table 1.Parameters of DRAM, PCM, NAND Flash Memory, and HDD .Table contents are based on [8, 11, 13]
Parameters DRAM PCM NAND Flash. HDD
Type volatile non-volatile non-volatile non-volatile Minimum Access Unit Byte Byte Page Sector
Read Latency 1.25 ns 1.25 ns 25 µ 12.7 ms Write Latency 1.25 ns 15.6 ns 200 µ 12.7 ms
Endurance ∞ 106 105 ∞
Read Energy 0.8 J/GB 1 J/GB 1.5 J/GB 65 J/GB Write Energy 1.2 J/GB 6 J/GB 17.5 J/GB 65 J/GB
Density 1x 2-4x 4x N/A
2.2. R -Tree
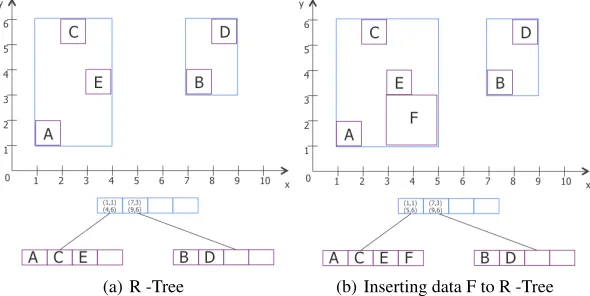
Antonin Guttman proposed R Tree [7] in 1984 to efficiently handle spatial data. R -Tree, which is similar to B+ -Tree [1], consists of an intermediate node to store grouping rectangles, and a leaf node to store data objects. R -Tree is a height-balanced tree similar to B+ -Tree, with index records in its leaf nodes that contain pointers to data objects. In other words, all data objects in R -Tree are stored in leaf nodes. In R -Tree, both data objects and grouping rectangles are in the form of minimum bounding rectangles: (1,2)(3,4) exemplify an MBR; (1,2) are the lower left point coordinates and (3,4) are the upper right point coordinates. We can determine the locations of given rectangles by checking the lower left and upper right points. In R -Tree, each node consists of records; the number of records is defined as the “fill factor”. The number of elements within a node should be in a range between a given minimum and maximum fill factor. R -Tree shrinks the area and makes structures more quadratic in order to use less space. R -Tree must satisfy several requirements:
– The root must have at least two children (unless it is a leaf).
– Every node must have children between the minimum and maximum fill factors. – All leaf nodes should appear on the same level.
Figure 1 depicts an example of R -Tree where the minimum fill factor is 2 and the maximum fill factor is 4. In Figure 1 (a), data objects A, C, E, B, and D are grouped into two nodes and have the same parent node. When data F is inserted into R -Tree, it first decides which rectangle it should be attached to, and then changes its coordinates, as depicted in Figure 1 (b). Furthermore, the MBR of the parent node is also updated.
(a) R -Tree (b) Inserting data F to R -Tree
Fig. 1.Example of R -Tree.
Consequently, the data that are chosen by the ChooseSubtree function are inserted into the leaf node, and if it is necessary, parent MBRs are updated. The Split function is used if the number of objects in the node exceeds the maximum fill factor value. The parent node might also need to split after the child node splits.
There are several split algorithms for R -Tree, such as exponential, quadratic, and linear split. Because the search performance of a quadratic split is better (according to [9]) than the alternatives, we decided to use the quadratic split for our evaluation. In the quadratic split, the Pick Seeds function calculates waste area x, and returns the pair with the largest waste area x for each pair of elements in a node. For instance, we are given pair a and b, and the MBR is c. In this case, the waste area will be calculated as follows:
W asteArea=Area(c)−Area(a)−Area(b) (1) After calculating the waste area based on Equation 1, the element of the pair with the largest waste area becomes a separate node. The rest of the elements from the initial node are inserted into the newly created node that has the least area increase. In this case, the Pick Next function is again used to find the entry with the best area-goodness-value for each case.
The Search operation is used to retrieve the data. This operation functions from the root of the tree and continues till the searched data of the leaf node are within the MBR of the intermediate node elements.
To remove the data, the Delete function is used. In order to remove the data, first we have to know their location by using the Search function, and then we can delete the data. If the minimum fill factor requirement is not fulfilled after deletion, then the remaining elements in a given node should be removed and inserted again.
2.3. Related Works
Chi et al. [4] proposed a PCM-efficient B+ -Tree where unsorted leaf versions of B+ -Tree proposed by Chen et al. [3] were optimized. Split operations of unsorted leaf versions of B+ -Tree require sorting the leaf node before a split, which lowers the performance and causes endurance problems. Chi et al. proposed a sub-balanced unsorted node scheme where, instead of sorting, a pivot key is selected assigning elements into two nodes. A pivot key is the average of the highest and lowest elements within the split node. They also proposed an overflow node scheme where leaf nodes should not be on the same level. This scheme has an overflow factor: the maximum difference between minimum and maximum tree heights. Furthermore, a merging factor scheme was proposed where nodes’ filling degrees can be adjusted. In B+ -Tree, at least half of the nodes must be populated for a node to exist; otherwise, the elements of the node must be merged with other nodes, which create an endurance problem. In order to handle this issue, Chi et al. proposed a merging factor scheme where the node could exist even if less than half its size is populated.
Tousidou et al. [12] has been used S -tree in order to improve performance and they proposed parallel S -tree. S -tree is a dynamic height-balanced tree similar in structure to B+ -Tree and designed for storing signatures. In this work, methods for designing multi-disk B -Trees are adopted to S -Tree and novel method of parallelizing S -Trees are developed that achieves better performance by accessing several disks simultaneously.
The above mentioned techniques optimize B+ -Tree like structures for PCM. As our goal is to store spatial data in memory, they cannot be efficiently stored using B+ -Tree or S -tree.
R -Tree is commonly used for storing spatial data. Work most similar to ours has been done [9, 10, 14], where a redesigned version of R -Tree was applied to SSD and Flash memory. Wu [14] aimed to efficiently handle fine-grained updates caused by R -Tree index access to spatial data over Flash memory. Wu proposed using a reservation buffer and a node translation table to reduce the number of unnecessary and frequent updates of information in Flash memory storage systems. Under this approach, newly generated objects would be temporarily held in a reservation buffer. Since reservation buffers can only store a limited number of objects, these objects should be flushed to Flash memory in a timely fashion. This technique slightly reduces the number of writes in NAND Flash memory, as it is page addressable.
Lv et al. [9] proposed a tree index structure named Log Compacted R -Tree. They combined newly arrived logs with origin logs on the same node, which rendered a great decrement in random writes and, at most, one additional read for each node access. In other words, a new log of a node is compacted with its former ones; if possible, the logs of different nodes are compacted into one page. As a result, the number of random write operations decreases without a huge increment in reads. This strikes a balance between read and write performance.
Other researchers [10] separated R -Tree metadata and aggregated data into different sectors of Flash memory.
However, the above-mentioned versions of R -Tree [9, 10, 14] cannot be applied to PCM due to the technical characteristics of PCM. Different from PCM, which is byte-addressable, NAND Flash memory is page-addressable. The above-mentioned techniques do not require updating the whole page for every single write, but simply delaying updates to NAND Flash memory results in the number of writes decreasing. However, those ap-proaches are not suitable for PCM, as we only need to update the bytes that have been modified. Even by applying the techniques presented [9, 10, 14], we do not get any im-provement over PCM.
Table 2.Summary of Related Works.
Research Problems
3.
Proposed R -Tree
At first, it is essential to check whether R -Tree causes an endurance problem. So, we added a counting system to the R -Tree implementation, which calculates the number of writes per node, as well as per record. We inserted a synthetically generated dataset that consists of three million data objects, and simulated our experiments with 32, 64, 128, 256, and 512 maximum fill factor values, where the minimum fill factor value is half of the maximum fill factor value.
3.1. Motivation
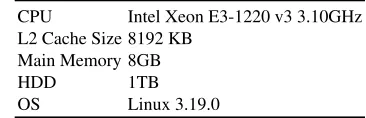
Simulation Environment. Table 3 describes the key specifications of the server we used for the experiments throughout this paper. Two datasets were used: a synthetically devel-oped dataset containing three million data objects, and a benchmark dataset that contains 76,999 objects. We have created the synthetic dataset by using the uniform distribution. The benchmark dataset was downloaded from an R-tree portal, which is a geographic spatial dataset of Germany in 2D space4.
Table 3.Test-Bed Configuration.
CPU Intel Xeon E3-1220 v3 3.10GHz L2 Cache Size 8192 KB
Main Memory 8GB
HDD 1TB
OS Linux 3.19.0
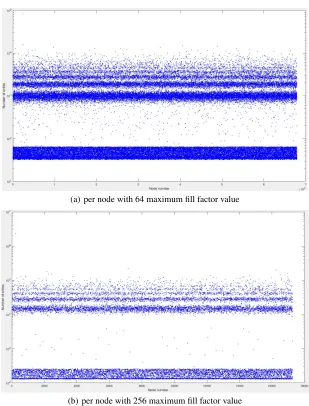
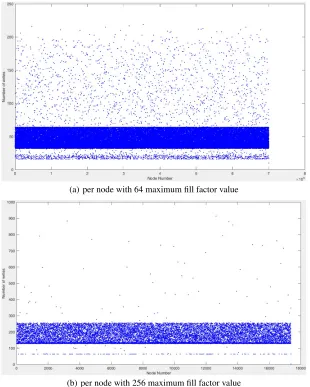
Simulation Results. Figure 2 shows the plotted graphs for 64 and 256 maximum fill factor values collected by inserting the synthetic dataset into R -Tree. We also observed similar results using 32, 128, and 512 maximum fill factor values. Due to space limita-tions, we omit the other results. Table 5 shows the standard deviation of the number of writes to leaf and internal nodes when maximum fill factor values are 64 and 256 (for the results illustrated in Figure 2). Experiment results shows that the numbers of writes to in-ternal nodes are higher than the number of writes to the leaf nodes. In R -Tree the inin-ternal nodes are updated only when there is a change in leaf nodes (updating parent nodes in order to keep the consistency of the tree) or when node splits. The Split operation causes many writes, because when a node needs to split, it must be sorted to find an appropriate split point. The entire parent node must be updated if there is any change in leaf nodes.
3.2. Proposed Scheme
Our approach consists of four straightforward steps that are comparably simple, yet ef-fective.
4
(a) per node with 64 maximum fill factor value
(b) per node with 256 maximum fill factor value
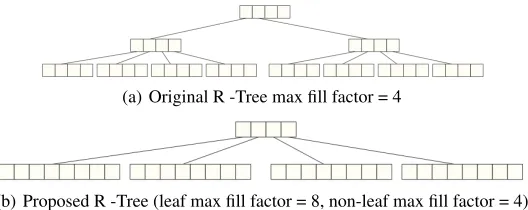
Increased leaf node size. In R -Tree, a split always starts from a leaf node when it exceeds the maximum fill factor value, and if necessary, parent nodes are also split. By postponing the Split operation, we will decrease the number of writes to PCM cells. So, we propose to increase the leaf node size to postpone the Split operation. In R -Tree overflows mostly happen in leaf nodes that cause high number of writes. The larger the leaf node size is less overflows will happen. However, if the size of both leaf and internal nodes will be doubled the performance for insert, search and delete will go lower as larger nodes takes more time to insert, search and delete. However, if we increase only the size of leaf nodes that would not much affect the performance, which is shown in performance evaluation part. From Figure 3, we can see that by doubling the leaf node size, the tree structure becomes more compact as fewer intermediate nodes are required. Thus, doubling leaf node size will postpone splitting the leaf nodes, which will decrease the number of writes, and improve performance. Moreover, as the height of the tree decreases by doubling the leaf node size, the number of writes for updating parent nodes also decreases. In performance evaluation section we will compare two leaf node size such as increasing the leaf node size two (2X) and four (4X) times compared to intermediate nodes.
(a) Original R -Tree max fill factor = 4
(b) Proposed R -Tree (leaf max fill factor = 8, non-leaf max fill factor = 4)
Fig. 3.Example of original and proposed R -Tree that stores 32 data elements.
Replace the split node with a blank one. When the node is full and needs to split, it is necessary to find an appropriate split point. Even though sorting the elements within a node is an expensive operation for PCM, it is essential for determining a proper split point. We propose exchanging a split node that has a high number of writes with an empty one that has a minimum number of writes. In more detail, once the node splits, we generate a new node and then copy the contents of the split node (where all re-arrangement has been handled) to this newly created node. Lastly, we exchange the split node for the newly created node. A new node is an empty node with a minimum number of writes. Even though this approach increases the number of writes by one time per updated cell, it lets us distribute the number of writes among all PCM nodes, and keeps all PCM cells usable as long as possible.
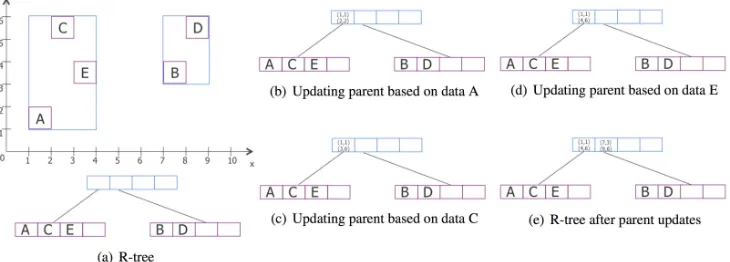
decreases the endurance. Figure 4 illustrates how R -Tree updates the parent node, where the root node should be updated in Figure 4 (a). The updating parent node algorithms of the original R -Tree will write to the parent node five times, based on the given example. First, it writes the MBR of data object A, which is (1,1)(2,2), to its parent, as shown in Figure 4 (b). Next, the MBR of data object C should be compared with its parents’ MBR and updated again to (1,1)(3,6), as shown in Figure 4 (c). Then the MBR of data object E should be compared with its parents’ MBR and must be updated again to (1,1)(4,6), as depicted in Figure 4 (d). The above process continues till the parent node is compared and updated with all the elements of the child node. So, there will be another two writes while updating the neighboring leaf node. As the maximum fill factor was not large in the example, the root node has been updated already five times. Conversely, for large maxi-mum fill factor values, the number of updates is much higher. Also, the number of updates increases as the tree becomes higher.
We propose comparing the value of MBRs of child node elements to figure out the MBR value for the parent node. Next, we write the computed value to the parent node. Compared to the original R -Tree update parent node function, which updates the example depicted in Figure 4 five times, the proposed version of the update parent node function will update the root node only twice.
Fig. 4.Example of updating parent node in R -Tree.
3.3. Space Consumption
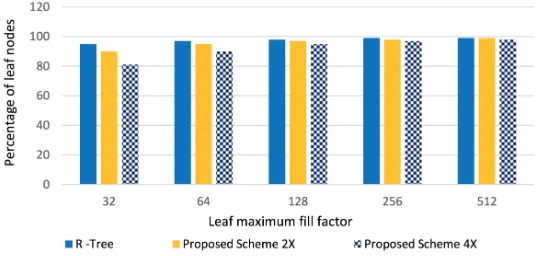
Fig. 5.Percentage of leaf and non-leaf nodes when benchmark dataset is inserted. Loga-rithmic scale graph (base 10).
After increasing the size of leaf nodes in the proposed R -Tree, it was challenging to decide whether the maximum fill factor value of the tree is based on leaf nodes or non-leaf nodes. This question is significant for the objective evaluation of the proposed R -Tree against the original R -Tree. As a solution to this question, we calculated the percentage of leaf nodes in the proposed R -Tree by inserting a benchmark dataset presented in Sec-tion 3.1. According to the results (Figure 5), the quantity of leaf nodes is much higher than the quantity of non-leaf nodes. Based on the results, as the maximum fill factor value increases, the percentage of leaf nodes increases as well. In the worst case scenario, only 19% of nodes are non-leaf nodes (Proposed Scheme 4X, leaf node maximum fill factor value = 32), and in the best case scenario, 1% of nodes are non-leaf. According to ex-periment results of the proposed scheme, in average 6% of nodes are non-leaf nodes and remaining 94% of nodes are leaf nodes. Therefore, we decide the maximum fill factor value for the proposed R -Tree based on its leaf node size.
However, the difference in node size would also affect the space consumption of the tree. Equations 2 and 3, respectively, show how space consumption has been calculated for R -Tree and the proposed R -Tree, where numleaf leaf is the number of leaf nodes,
numnonleafis the number of non-leaf nodes, ff is the maximum fill factor value, ffleafis the
maximum fill factor for leaf nodes and ffnonleafis the maximum fill factor value for non-leaf
nodes. Furthermore, each record takes 32 bytes of memory.
SpaceConsumptionR−T ree= (numleaf+numnonleaf)∗f f∗32 (2)
Fig. 6.Space consumption when the benchmark dataset is inserted. Shown in bytes.
storage space when the maximum fill factor value is low. However when the maximum fill factor value increases, its space consumption gets closer to R -Tree and furthermore in few cases the space consumption of the proposed R -Tree is lower than the original R -Tree. Besides, in the worst case scenario, the proposed R -Tree uses 4% more memory than R -Tree. Furthermore, as more increase in leaf node size compared to non-leaf node size, the space consumption is also increases. In average case the proposed scheme takes 1.1% more space than the original R -Tree.
4.
Performance Evaluation
In this section, we compare the proposed R -Tree scheme with the original R -Tree by using both large synthetic and benchmark datasets presented in Section 3.1. Comparison is based on the number of writes per node, as well as performance in terms of processing time for insert, delete, and search operations.
4.1. Synthetic Dataset
(a) per node with 64 maximum fill factor value
(b) per node with 256 maximum fill factor value
node size and updating parent node only once. Furthermore, the standard deviation of the number of writes per node is much lower than the average number of writes per node for the proposed R -Tree scheme, showing that the number of writes are clustered closely around the average. This proves that the number of writes per node are well distributed among all the nodes.
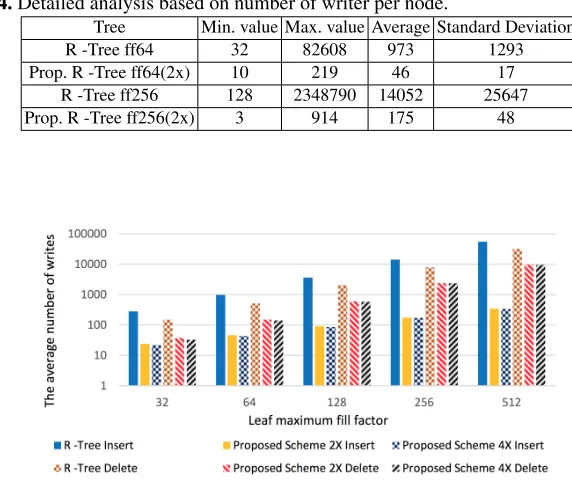
Table 4.Detailed analysis based on number of writer per node.
Tree Min. value Max. value Average Standard Deviation
R -Tree ff64 32 82608 973 1293
Prop. R -Tree ff64(2x) 10 219 46 17
R -Tree ff256 128 2348790 14052 25647
Prop. R -Tree ff256(2x) 3 914 175 48
Fig. 8.The average number of writes per node when inserting the synthetic dataset and deleting a random 500,000 objects. Logarithmic scale graph (base 10).
be inserted to other existing nodes). Moreover with more increasing the leaf node size, the number of writes slightly decreases as the number of splits decreases.
Also, the proposed scheme decreases the number of writes during deletion by not merging nodes when the minimum fill factor requirement does not met, as well as up-dating the parent nodes only once. According to Figure 8, with the increase of maximum fill factor value, the average number of writes per node increases. Based on results, the increase in the size of leaf nodes decreases the number of writes during deletion. In aver-age, the number of writes per node is decreased by 3 times by using the proposed R -Tree Scheme for delete operation.
Figure 9 shows the average number of writes per record when inserting the synthetic dataset and deleting a random 500,000 objects. According to the results, in average the number of writes has been decreased by 25 times for insertion and 12 times for deletion.
Fig. 9.The average number of writes per record when inserting the synthetic dataset and deleting a random 500,000 objects. Logarithmic scale graph (base 10).
Table 5.The standard deviation of number of writes per leaf and internal nodes when synthetic dataset is used.
Tree Maximum fill factor 64 Maximum fill factor 256 Leaf node Internal node Leaf node Internal node
R -Tree 1210 3058 18522 210024
Prop. R -Tree 2X 10 58 41 214
Prop. R -Tree 4X 10 29 44 125
Table 5 shows the standard deviation of number of writes per leaf and internal nodes when synthetic dataset is used. The results show that the proposed R -Tree scheme de-creases the number of writes to both leaf and internal nodes. Moreover with the increase of the leaf node size compared to the internal node size, the number of writes to the internal nodes noticeably decreases.
Postponing the Split operation by increasing the leaf node size improves the insert perfor-mance and in average the insert perforperfor-mance have been improved 20%. According to the results the increase in maximum fill factor value slightly degrades the performance both for R -Tree and proposed R -Tree. Also for each maximum fill factor value, the insert performance of proposed R -Tree 4X is better than the performance of proposed R -Tree 2X due to the decrease in number of splits.
For search performance, as the leaf node size is increased, when the maximum fill factor is low (32) the proposed scheme takes slightly more time. This happens because by inserting huge dataset to the tree with low maximum fill factor value, the tree must hold large quantity of nodes, which does not let the proposed R -Tree to decrease the tree height. However, as the leaf node size gets larger the decrease in height of the proposed R -Tree helps to improve the search performance. In average case the proposed R -Tree scheme improves the search performance 6%. The location of the data in leaf node that we search for, causes slight the difference in pattern between proposed Scheme 2X and 4X as shown in Table 6. As the nodes are not sorted in R -Tree, elements of an appropriate nodes must be searched one by one until the data is found.
Delete performance is quite similar to the search performance. The reason for that is in R -Tree, before deleting an element we need to search for it and most of the delete time is consumed finding the element in the tree. According to Table 6, the delete time in original R -Tree is higher than search, as the node needs to merge with other nodes if the minimum fill factor requirement not met. As it was with search performance, the proposed R -Tree takes slightly more time (3%) for deletion when the maximum fill factor is 32. However, in case of proposed R -Tree, the delete time is quite identical to search time as we never need to merge the nodes. Moreover, for R -Tree with larger maximum fill factor values (128, 256 and 512) the delete performance gets better than the search. This happens due to the reason that after each deletion the number of the remaining elements in a large R -Tree nodes decreases making the search faster. In average case the proposed R -Tree scheme improves the delete performance by 15%.
Table 6.Execution times while using the synthetic dataset for insertion, search, and deletion. All times shown are in seconds.
Maximum fill factor 32 64 128 256 512
Insertion
R -Tree 36.3 42.1 57.4 78.5 128.7
Prop. R -Tree 2X 32.4 36.0 45.5 64.7 99.3 Prop. R -Tree 4X 31.2 34.9 43.2 60.6 94.2 Search
R -Tree 31,091.4 31,113.8 27,520.7 24,341.4 23,659.1 Prop. R -Tree 2X 32,848.3 26,423.5 25,294.2 23,560.0 22,064.4 Prop. R -Tree 4X 32,844.2 27,908.9 23,424.2 23,668.7 21,637.4 Deletion
R -Tree 31,994.8 32,536.8 30,491.0 26,985.3 26,540.8 Prop. R -Tree 2X 32,904.6 26,424.2 25,064.6 23,068.9 21,303.3 Prop. R -Tree 4X 32,844.2 28,059.5 23,312.1 23,246.1 20,884.2
of the number of writes in average reduced by 12% when we do not merge the proposed R -Tree scheme while deletion. Furthermore, the no merge version of proposed R -Tree improves the delete performance in terms of processing time as there is no need to re-insert the element of the node that do not fulfill the minimum fill factor requirement. In average, the proposed no merge version of R -Tree decreases the delete performance in terms of processing time by 19%.
Table 7.Comparison of standard deviation of writes per node and time spend while deletion for Proposed R -Tree scheme with and without merge operation by using the synthetic dataset.
Tree Merge while deletion Do not merge while deletion Stan. Deviation Time(sec.) Stan. Deviation Time(sec.) Prop. R -Tree (2X) ff64 116 30,887.0 93 26,424,2 Prop. R -Tree (2X) ff256 1562 30,320.0 1254 23,068.9 Prop. R -Tree (4X) ff64 101 33,024.1 96 28,059.5 Prop. R -Tree (4X) ff256 1322 30,648.1 1273 23,246.1
4.2. Benchmark Dataset
This section presents the experimental results when the benchmark dataset (introduced in Section 3.1) is used. For search and deletion, we used a random 20,000 objects among the inserted ones.
Similar results were observed when using the benchmark dataset as seen for synthetic dataset. Figures 10, respectively shows the average number of writes per node while in-serting the benchmark dataset (Insert) and when inin-serting the benchmark dataset and re-moving a random 20 thousand objects (Delete) for both the original R -Tree and the pro-posed R -Tree scheme. For the insert operation, the number of writes per node decreased by at least 10 times and in average case is decrease by 92 times. It should also mentioned that with the increase of the maximum fill factor value the proposed R -Tree scheme con-sumes much less number of writes than the original R -Tree. This happens so, because the leaf node is increased compared to the original R -Tree, which delays the split operation. Moreover, in every change in leaf nodes, the parent nodes are updated only once.
According to the results (Figure 10) the number of writes per node decreases in case of deletion as well. In average the number of writes is decreased by 20 times while using the proposed R -Tree scheme. The decrease in number of writes while deletion happens due to disabling the minimum fill factor requirement in R -Tree, as well as due to proposed novel parent node update algorithm. As we have observed for synthetic dataset, also in case of benchmark dataset increase in leaf node size decreases the number of writes.
Fig. 10.The average number of writes per node when inserting the benchmark dataset and deleting a random20,000 objects. Logarithmic scale graph (base 10).
less time is used by insert operation. In average the search performance is improved by 21%, which happens as the height of the tree is decreased. Finally in case of deletion, the average performance is improved by 29% when the proposed R -Tree scheme have been used, that mainly due to disabling the minimum fill factor requirement in the proposed scheme. For searching and deletion, the performance improvement of the proposed R -Tree is higher when the maximum fill factor value is small (e.g. 32, 64). This is due to fact that the larger nodes require more time to search. Also, even though the delete operation takes more time than search for R -Tree, in case of the proposed R -Tree delete is faster than the search. This happens because we do not need to merge the nodes when the min-imum fill factor requirement does not meet for delete operation and with every deletion, the performance of search operation (as the quantity of data that tree stores decreases) gets better. The results for search and deletion do not have any pattern with the change of the maximum fill factor value, which is due to the location of the data that needs to be searched or deleted in leaf nodes. Obviously, more the data that we are searching for near the beginning of the node, less time is required by search and delete operations.
dataset. So, more nodes must be created for storing the elements of the synthetic dataset in the tree, which makes the proposed R -Tree to grow higher making the search and delete performance slower.
Table 8.Execution times while using the benchmark dataset for insertion, search, and deletion. All times shown are in seconds.
Maximum fill factor 32 64 128 256 512 Insertion
R -Tree 1.07 1.15 1.44 1.99 2.8 Prop. R -Tree 2X 0.89 0.99 1.18 1.55 2.18 Prop. R -Tree 4X 0.87 0.93 1.15 1.46 2.17 Search
R -Tree 16.04 19.02 16.48 12.79 18.57 Prop. R -Tree 2X 9.62 12.94 16.76 14.63 18.13 Prop. R -Tree 4X 10.85 8.43 10.16 15.38 13.33 Deletion
R -Tree 16.36 17.45 17.16 16.41 19.63 Prop. R -Tree 2X 8.81 12.06 15.64 13.78 17.49 Prop. R -Tree 4X 10.0 7.72 9.74 14.43 12.65
5.
Conclusion
Phase change memory is a byte-addressable type of non-volatile memory. Compared to other storage systems, PCM is two to four times denser than DRAM, and it has better read latency than NAND Flash memory. Although the write endurance of PCM is 10 times better than NAND Flash memory, it is still limited to 106 times per PCM cell. Currently, many existing applications use spatial data (for example, location information); therefore, storing spatial data in memory is significant. R -Tree is a well-known data structure that can handle spatial data; we propose using it over PCM. However, R -Tree invokes a lot of writes, and moreover, its performance is low, especially for insertion. We propose a novel PCM-aware R -Tree algorithm. By doubling the leaf node size, writing a split node to a blank node, updating parent nodes only once and not merging the nodes after deletion when the minimum fill factor requirement does not meet, the proposed R -Tree achieves dramatic improvement in the number of writes, and at the same time, improves performance. According to our experimental results when we used both large synthetic and benchmark datasets, the proposed novel scheme dramatically reduced the number of write operations to PCM cells and also improved the performance in terms of processing time for insert, search and delete operations. These results suggest our new method outperforms existing ones in addressing the PCM endurance problem.
each PCM cell to Operation System or various applications. One possible solution to this problem is to propose a new PCM translation layer.
The proposed R -Tree scheme can improve the lifetime of PCM. By using the pro-posed R -Tree scheme, PCM can be used for in memory databases to store spatial data or spatial applications. So PCM will penetrate or commercialized in server or computer system. Our future work is to implement proposed R -Tree scheme in real spatial database applications. We will also apply the proposed scheme to other spatial tree variants that are similar to R -Tree, such as quadtee and k-d tree.
Acknowledgments.This work was supported by the National Research Foundation of Korea (NRF) grant funded by the Korea government (MEST) (No. NRF-2013R1A1A1012524) for the second au-thor (Byung-Won On) and supported by the Ministry of Trade, Industry & Energy (MOTIE, Korea) under the Industrial Technology Innovation Program, No. 10063130, by the Basic Science Research Program through the National Research Foundation of Korea (NRF) funded by the Ministry of Ed-ucation (2016R1A2B4007498), and the MSIP (Ministry of Science, ICT and Future Planning), Korea, under the ITRC (Information Technology Research Center) support program (IITP-2016-R2718-16-0035) supervised by the IITP (Institute for Information & communications Technology Promotion) for third author (Gyu Sang Choi).
References
1. Bayer, R., McCreight, E.: Organization and maintenance of large ordered indexes. In: Software pioneers, pp. 245–262. Springer (2002)
2. Bedeschi, F., Fackenthal, R., Resta, C., Donze, E.M., Jagasivamani, M., Buda, E., Pellizzer, F., Chow, D., Cabrini, A., Calvi, G.M.A., et al.: A multi-level-cell bipolar-selected phase-change memory. In: 2008 IEEE International Solid-State Circuits Conference-Digest of Technical Pa-pers. pp. 428–625. IEEE (2008)
3. Chen, S., Gibbons, P.B., Nath, S.: Rethinking database algorithms for phase change memory. In: CIDR. pp. 21–31 (2011)
4. Chi, P., Lee, W.C., Xie, Y.: Making b+-tree efficient in pcm-based main memory. In: Proceed-ings of the 2014 international symposium on Low power electronics and design. pp. 69–74. ACM (2014)
5. Choi, G.S., On, B.W., Lee, I.: Pb+-tree: Pcm-aware b+-tree. IEEE Transactions on Knowledge and Data Engineering 27(9), 2466–2479 (2015)
6. Chung, H., Jeong, B.H., Min, B., Choi, Y., Cho, B.H., Shin, J., Kim, J., Sunwoo, J., Park, J.m., Wang, Q., et al.: A 58nm 1.8 v 1gb pram with 6.4 mb/s program bw. In: 2011 IEEE International Solid-State Circuits Conference. pp. 500–502. IEEE (2011)
7. Guttman, A.: R-trees: a dynamic index structure for spatial searching, vol. 14. ACM (1984) 8. Lee, B.C., Ipek, E., Mutlu, O., Burger, D.: Architecting phase change memory as a scalable
dram alternative. In: ACM SIGARCH Computer Architecture News. vol. 37, pp. 2–13. ACM (2009)
9. Lv, Y., Li, J., Cui, B., Chen, X.: Log-compact r-tree: an efficient spatial index for ssd. In: Inter-national Conference on Database Systems for Advanced Applications. pp. 202–213. Springer (2011)
11. Qureshi, M.K., Srinivasan, V., Rivers, J.A.: Scalable high performance main memory system using phase-change memory technology. ACM SIGARCH Computer Architecture News 37(3), 24–33 (2009)
12. Tousidou, E., Vassilakopoulos, M., Manolopoulos, Y.: Performance evaluation of parallel s-trees. Journal of Database Management 11(3), 28 (2000)
13. Tseng, H.W., Li, H.L., Yang, C.L.: An energy-efficient virtual memory system with flash mem-ory as the secondary storage. In: ISLPED’06 Proceedings of the 2006 International Symposium on Low Power Electronics and Design. pp. 418–423. IEEE (2006)
14. Wu, C.H., Chang, L.P., Kuo, T.W.: An efficient r-tree implementation over flash-memory stor-age systems. In: Proceedings of the 11th ACM international symposium on Advances in geo-graphic information systems. pp. 17–24. ACM (2003)
Elkhan Jabarovreceived MSc degrees in both Computer Science and Engineering from Korea University, Republic of Korea. He is currently pursuing a PhD in the Department of Computer and Radio Communications Engineering, Korea University, Republic of Korea. His research interests include databases and data mining.
Byung-Won Onearned his PhD degree in Department of Computer Science and Engi-neering, Pennsylvania State University at University Park, PA, USA in 2007. Then, he worked as a full-time researcher in University of British Columbia, Advanced Digital Sciences Center, and Advanced Institutes of Convergence Technology for almost seven years. Since 2014, he has been a faculty member in Department of Statistics and Com-puter Science, Kunsan National University, Gunsan-si, Jeollabuk-do, Korea. His recent research interests are around Data Mining and Databases, mainly working on AI-based Text Mining and Big Data Management Technologies.
Gyu Sang Choireceived his PhD in Computer Science and Engineering from Pennsylva-nia State University. He was a research staff member at the Samsung Advanced Institute of Technology (SAIT) for Samsung Electronics from 2006 to 2009. Since 2009, he has been with Yeungnam University, where he is currently an associate professor. He is now working on non-volatile memory and storage systems, whereas his earlier research mainly focused on improving the performance of clusters. He is a member of ACM and IEEE.
Myong-Soon Parkis Professor of Computer Science department at Korea University in Seoul, South Korea. He received his BSc in Electronics Engineering from Seoul National University, an MSc in Electrical Engineering from the University of Utah in 1982, and a PhD in Electrical and Computer Engineering from the University of Iowa in 1985. He was an assistant professor at Marquette University from 1985 to 1987.1 and at Postech from 1987.2 to 1988.2. Since 1988.3 he has been an assistant, associate and full professor at Korea University until now. Professor Park was the chair of the SIG on parallel processing of KIISE (1997-2000) and has been on program committees for various international conferences. His research interests include sensor networks, internet computing, parallel and distributed systems, and mobile computing.
![Table 1. Parameters of DRAM, PCM, NAND Flash Memory, and HDD .Table contentsare based on [8, 11, 13]](https://thumb-us.123doks.com/thumbv2/123dok_us/1168795.1619412/3.612.179.447.446.550/table-parameters-dram-nand-flash-memory-table-contentsare.webp)