I
I
n
n
t
t
e
e
r
r
n
n
a
a
t
t
i
i
o
o
n
n
a
a
l
l
J
J
o
o
u
u
r
r
n
n
a
a
l
l
o
o
f
f
B
B
i
i
o
o
l
l
o
o
g
g
i
i
c
c
a
a
l
l
S
S
c
c
i
i
e
e
n
n
c
c
e
e
s
s
2011; 7(7):1037-1044
Research Paper
Development and Initial Characterization of a HAPPY Panel for Mapping
the X. Tropicalis Genome
Zhihua Jiang
1,, Jennifer J. Michal
1, Kenneth B. Beckman
2, Jessica B. Lyons
3, Ming Zhang
1, Zengxiang
Pan
1, Daniel S. Rokhsar
3and Richard M. Harland
3,1. Department of Animal Sciences, Washington State University, Pullman, WA 99164-6351, USA; 2. Biomedical Genomics Center, University of Minnesota, Minneapolis, MN 55455, USA;
3. Department of Molecular & Cell Biology, University of California Berkeley, Berkeley, CA 94720-3200, USA.
Corresponding author: Dr. Zhihua Jiang ([email protected]) or Dr. Richard M. Harland ([email protected]).
© Ivyspring International Publisher. This is an open-access article distributed under the terms of the Creative Commons License (http://creativecommons.org/ licenses/by-nc-nd/3.0/). Reproduction is permitted for personal, noncommercial use, provided that the article is in whole, unmodified, and properly cited.
Received: 2011.06.20; Accepted: 2011.08.13; Published: 2011.08.24
Abstract
HAPPY mapping was designed to pursue the analysis of approximately random HAPloid DNA breakage samples using the PolYmerase chain reaction for mapping genomes. In the present study, we improved the method and integrated two other molecular techniques into the process: whole genome amplification and the Sequenom SNP (single nucleotide polymor-phism) genotyping assay in order to facilitate whole genome mapping of X. tropicalis. The former technique amplified enough DNA materials to genotype a large number of markers, while the latter allowed for relatively high throughput marker genotyping with multiplex assays on the HAPPY lines. A total of 58 X. tropicalis genes were genotyped on an initial panel of 383 HAPPY lines, which contributed to formation of a working panel of 146 lines. Further genotyping of 29 markers on the working panel led to construction of a HAPPY map for the X. tropicalis genome. We believe that our improved HAPPY method described in the present study has paved the way for the community to map different genomes with a simple, but powerful approach.
Key words: HAPPY mapping, whole genome amplification, multiplex genotyping assay, mapping X. tropicalis genome.
Introduction
HAPPY mapping, the analysis of approximately HAPloid DNA samples using the PolYmerase chain reaction, is a genome mapping method based on random DNA breakage and determination of linkage [1-2]. This approach is essentially analogous to clas-sical linkage mapping, but the chromosome breakage and segregation are generated by in vitro analogues with gamma-irradiation or shearing. Genes/markers are then segregated by diluting the resulting frag-ments to give aliquots that contain approximately 1 haploid genome equivalent. Compared to other con-ventional genome mapping methods, this HAPPY approach possesses several advantages. First, it
al-lows construction of gene/marker maps without cloning, thus avoiding many potential errorsand ar-tifacts [3]. Second, the approach can also be easily adapted to any desired level of resolution, in particu-lar, to a high resolution of genome maps [4]. Third, unlike the radiation hybrid mapping approach, a HAPPY panel contains no carrier DNA, which eases specific PCR amplification of markers and makes multiplexing more amenable. Lastly, HAPPY map-ping does not require any polymorphic markers so any piece of DNA can be mapped to a genome region. Therefore, the HAPPY mapping approach is applica-ble to all species, from human [5], to plant [6] and
Ivyspring
even to unicellular eukaryotes [7].
However, such a simple and powerful HAPPY mapping method has not yet come into general use even though it was developed by Dear and Cook as early as 1989. Up to date, only eight maps have been generated using the HAPPY approach and all of them
were contributed by the inventors’ group [1-8]. The bottleneck of the method as far as we can see, is the lack of faithful amplification of the whole DNA that provides enough material for genotyping a large number of markers. It seems that this problem should be now overcome by using a well-developed whole genome amplification method, termed multiple dis-placement amplification (MDA) [9]. MDA can yield about 20 – 30 ug of product from as few as 1 – 10 copies of genomic DNA. In comparison to other whole genome amplification methods, MDA provides the most reliable genotypes, highest call rates, best genomic coverage, and lowest amplification bias [10]. Therefore, improving the HAPPY approach by solv-ing the bottleneck will help promote its application in genome mapping of many species.
Amphibians have been used since the 19th cen-tury as vertebrate models for investigating many im-portant aspects of biological sciences [11]. In particu-lar, the study of amphibian embryogenesis has pro-vided important insight into the mechanisms of ver-tebrate development [12]. In order to meet the
Xenopus research community's needs, the National Institutes of Health Xenopus Initiative is supporting the development of genetic and genomic resources, such as (1) complementary deoxyribonucleic acid (cDNA) libraries and expressed sequence tag (EST) sequences, (2) UniGene clusters, (3) full-insert cDNA sequences, (4) a genetic map, (5) genomic libraries, (6) a physical map, (7) genome sequence, (8) microarrays, (9) mutagenesis and phenotyping, and (10) bioinfor-matics [13-14]. While genomic resources for X. tropi-calis have advanced significantly in recent years as described above, tough challenges lie ahead, espe-cially with respect to high-quality assembly of the whole genome for the species. The Department of Energy's Joint Genome Institute produced about 1.33 Gbp of high quality DNA sequences using a sev-enth-generation inbred Nigerian female [15], but these sequences need to be accurately ordered on 10 chro-mosomes. Here we present our pilot study to demon-strate the feasibility of the HAPPY approach for con-struction of whole genome maps as reference for a high quality chromosome-based long-range assembly in X. tropicalis.
Materials and Methods
Animals, Blood Sampling and Cell Preparation.
Development of a HAPPY panel for genome mapping of X. tropicalis was carried out by following a protocol developed by Dear and colleagues [5] for construction of a high resolution metric HAPPY map of human chromosome 14, but with modifications. A blood sample from an inbred F10 Nigerian X. tropicalis ani-mal was collected into 0.9X SSC (sodium chlo-ride-sodium citrate buffer) on ice. After collection, the blood cells were resuspended by inverting the tube, and counted using a "Bright Line" Hemocytometer (Hausser Scientific,
Horsham, PA
). The suspension was then centrifuged at 453 x g for 3 minutes at 4C in a tabletop centrifuge, the supernatant was poured off, and the cells were resuspended in PBSG (Phos-phate-Buffered Saline + 1% glucose) in aliquots at 6 x 10⁵ cells/mL and 5 x 10⁶ cells/mL, the latter being forhigh-density controls. Each cell suspension was mixed 1:1 with PBSG + 2% agarose (kept at 37C in a water bath), for final concentrations of 3 x 10⁵
cells/mL and 2.5 x 10⁶ cells/mL, respectively, in PBSG
+ 1% agarose. These mixtures were taken up into ap-proximately 46 or 20 (high density controls) 100 L calibrated glass pipets (VWR International) and cooled to 4C. Each set of “agarose strings” was a l-lowed to fall by gravity into 150 mL of lysis solution (10 mM Tris-Cl, 1mM EDTA, 1% lithium dodecyl sulfate, pH 7.5) and incubated on a rotator at 4C. The lysis solution was replaced after intervals of 15 minutes, 30 minutes, 3 hourly intervals, and over-night, and the strings were stored in lysis buffer at 4C until use.
Pulsed Field Electrophoresis and DNA Frag-mentation. The DNA contained in the cell-agarose strings was separated in a 0.8% chromosomal grade agarose gel under 1X TAE buffer. The cell-agarose strings were cut to fit the length of an electrophoresis well with a razor blade, placed into the well with a spatula and pressed to front of the well such that less than 90% of the height of the well was occupied. The sample plugs were finally sealed into the well with 0.8% low melt agarose in 1X TAE. The electrophoresis was performed using CHEF-DR III Pulsed Field Elec-trophoresis System (Bio-Rad, Hercules, CA) using S. pombe chromosomes (New England Biolabs, Ipswich, MA) as molecular ladder. The gel was run at 14oC and
3V cm-1 in three blocks: Block 1) 24h with a 96o
reori-entation angle and 1200 sec switch time; Block 2) 24h with a 100o reorientation angle and 1500 sec switch
time; and Block 3) 24h with a 106o reorientation angle
visual-DNA-free environment. A total of 383 plugs were collected with capillary tubes across the gel lane at sizes ranging from ~0.5 Mb to ~6 Mb. In addition, 7 plugs of agarose were also collected from locations outside of the running lane and were used as con-trols.
Whole Genome Amplification (WGA) and DNA Measurement. Each plug was then transferred to an individual PCR tube and the first round of WGA was performed using the illustraTM GenomiPhi V2 DNA
Amplification Kit (GE Healthcare Lifesciences, Pisca-taway, NJ). Briefly, 9 µL of sample buffer was added to each agarose plug and DNA was denatured by heating to 95oC for 3 min, followed by cooling to 4oC
on ice. Next, 9 µL of reaction buffer was mixed with 1 µL of enzyme mix on ice and added to the cooled sample. Amplification was performed by incubating the sample at 30oC for 2 h, after which time the
reac-tion was terminated by heating to 65oC for 10 min,
followed by cooling to 4oC. The second round of
WGA was accomplished by taking 1 µl of amplified DNA from the first WGA round and repeating each step as described above. Samples from the second round of WGA were purified by ethanol precipitation with 1.5 M sodium acetate (pH >8)/250 mM EDTA buffer. Purified DNA pellets were resuspended in TE and quantity and quality determined with a Nanodrop spectrophotometer.
HAPPY Panel Characterization. These ampli-fied DNA HAPPY lines were tested for a total of 58 X. tropicalis genes, which have the human orthologs representing all autosomes and X chromosome (see Supplementary Material: Table S1). Putative single nucleotide polymorphisms (SNPs) were identified for each frog gene based on comparison between cDNA and genomic DNA sequences and only one of these sequences were selected to genotype these 383 HAPPY lines using the Sequenom genotyping assay (see Supplementary Material: Table S2). Four frog original whole genome DNA samples served as posi-tive controls and four blanks were used as negaposi-tive controls. The genotype scores were converted to 1 when there was a call for a genotype or 0 when there was no call for a genotype and the data were then used for a pair-wise similarity analysis. The geno-typing data of 58 markers were considered as charac-ter string variables, so there are 58 characcharac-ters for each HAPPY line. The similarity between two character strings was calculated using a VBA (visual basic for application) program by considering both character and the order of the characters in strings. We calcu-lated the similarity in a 383×383 matrix for all these samples. Only the HAPPY lines that were <0.85
simi-lar to others were selected to form a 146-sample working panel.
HAPPY Map Construction: a Pilot Study. A megaBLAST program was used to identify ultracon-served elements (UCEs) between frog scaffolds (v5.1) and the human chromosomes. We selected a region from 0 Mb to ~10 Mb on human chromosome 1 as our target to test the feasibility of the HAPPY panel for map construction. Several pseudo-SNPs were ran-domly assigned to each of 48 selected UCEs and the Sequenom assay designed picked 29 of them for mul-tiplex genotyping (see Supplementary Material: Table S2). Like the conventional radiation hybrid (RH) mapping, we genotyped the same set of markers twice on the 146-sample working frog HAPPY panel with 5 ng of DNA as template. We scored the genotypes by two different methods. In a simple approach, we
as-signed “1”or “0” to cases where the call rate of repl
i-cates was either = 100% or 0%, while “?” was assigned
to cases where discordance of call/no call occurred. The heuristic approach was based on call rate, mean yield and penalty. If call rate = 100% and penal-ty/yield/skew were acceptable, then “1” was a s-signed as genotype present. If call rate ≥ 50% and best
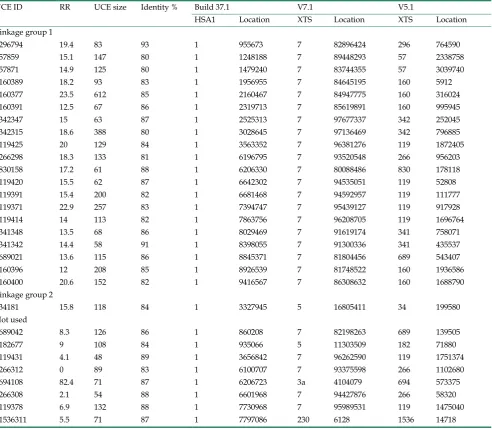
penalty/best yield were acceptable, then “?” was a s-signed. The rest of the cases were assigned “0” as a b-sent. The RHMAP 3.0 program was used to construct maps as described previously [16]. Information on markers used in the map construction is presented in Table 1.
Results and Discussion
Table 1. UCE marker ID, retention rate (RR) and their locations on human chromosome 1 (HSA1) and X. tropicalis scaffolds (XTS).
UCE ID RR UCE size Identity % Build 37.1 V7.1 V5.1
HSA1 Location XTS Location XTS Location Linkage group 1
S296794 19.4 83 93 1 955673 7 82896424 296 764590 S57859 15.1 147 80 1 1248188 7 89448293 57 2338758 S57871 14.9 125 80 1 1479240 7 83744355 57 3039740 S160389 18.2 93 83 1 1956955 7 84645195 160 5912 S160377 23.5 612 85 1 2160467 7 84947775 160 316024 S160391 12.5 67 86 1 2319713 7 85619891 160 995945 S342347 15 63 87 1 2525313 7 97677337 342 252045 S342315 18.6 388 80 1 3028645 7 97136469 342 796885 S119425 20 129 84 1 3563352 7 96381276 119 1872405 S266298 18.3 133 81 1 6196795 7 93520548 266 956203 S830158 17.2 61 88 1 6206330 7 80088486 830 178118 S119420 15.5 62 87 1 6642302 7 94535051 119 52808 S119391 15.4 200 82 1 6681468 7 94592957 119 111777 S119371 22.9 257 83 1 7394747 7 95439127 119 917928 S119414 14 113 82 1 7863756 7 96208705 119 1696764 S341348 13.5 68 86 1 8029469 7 91619174 341 758071 S341342 14.4 58 91 1 8398055 7 91300336 341 435537 S689021 13.6 115 86 1 8845371 7 81804456 689 543407 S160396 12 208 85 1 8926539 7 81748522 160 1936586 S160400 20.6 152 82 1 9416567 7 86308632 160 1688790 Linkage group 2
S34181 15.8 118 84 1 3327945 5 16805411 34 199580 Not used
S689042 8.3 126 86 1 860208 7 82198263 689 139505 S182677 9 108 84 1 935066 5 11303509 182 71880 S119431 4.1 48 89 1 3656842 7 96262590 119 1751374 S266312 0 89 83 1 6100707 7 93375598 266 1102680 S694108 82.4 71 87 1 6206723 3a 4104079 694 573375 S266308 2.1 54 88 1 6601968 7 94427876 266 58320 S119378 6.9 132 88 1 7730968 7 95989531 119 1475040 S1536311 5.5 71 87 1 7797086 230 6128 1536 14718
Others have reported higher yields of DNA after WGA. For example, Balogh et al. [17] observed an average yield of 225–350 ng/ µl with 50–500 pg of input DNA after using the GenomiPhi Amplification Kit (Amersham Biosciences). Several reasons might explain the relatively low WGA yield in our present study. First, we did not carry out gamma-irradiation or ultrasonic shearing to break chromosomes into fragments. Chromosome breakage might be only in-duced during lysis and pulsed field electrophoresis, thus limiting the amount of DNA released from the strings and causing low DNA flows in the gel. This might also provide initial evidence to support that each HAPPY line contains a random subset of frog genome, rather than whole genome content. Second,
we used only 1 µl of DNA from the first round of WGA and proceeded to the second round of WGA. As
such, we didn’t really know how much DNA was
respec-tively. Samples collected between 5 – 6 Mb resulted in an average of 1,239 ng WGA DNA per line.
The WGA procedure was also explored in RH panel amplification [18]. The authors performed two separate WGA amplifications of 10 ng of DNA each of one clone of their canine panel RHDF5000 and ana-lyzed the presence in the amplified DNA of 74 mark-ers known to be present and 18 known to be absent from the original DNA. Among 74 positive markers, the authors found 73 present in one of the amplified DNA samples, while none of the 18 negative markers were detected. In the second amplified DNA sample, the 74 positive markers were all present, whereas all of the 18 negative markers were absent. This indicated that WGA is a reliable method. The team also ob-served no loss of markers upon two successive am-plifications. As such, we feel confident to claim that the second round of WGA on our HAPPY panel would not generate any significant loss or bias from the original round of WGA amplifications.
Marker Retention Rate. A total of 58 gene markers were genotyped on these 383 HAPPY lines using the Sequenom assay in two multiplex sets. As shown in Supplementary Material: Table S1, most of these genes are well distributed among human auto-somes and X chromosome and are more than 10 Mb apart, except for two genes on human chromosome 14, three genes on 17 and two genes on X that are less than 6 Mb apart. Fortunately, we were able to find orthologs of all of these human genes in the newest assembly of the X. tropicalis genome (v7.1), including 12 on scaffold 1, 9 on scaffold 2, 7 on scaffold 6, 5 on scaffold 4, 4 each on scaffolds 5, 7, 8 and 9, 3 on scaf-fold 3, and only one each on scafscaf-folds 10, 35, 83, 181, 532 and 656, respectively. The scaffolds 1 to 10 on the newest assembly are very likely to represent 10 chromosomes in X. tropicalis. Only two genes (PNN and MGA) had a physical distance of less than 0.5 Mb, while the remaining genes are separated by at least 3 Mb up to 74 Mb (Supplementary Material: Table S1).
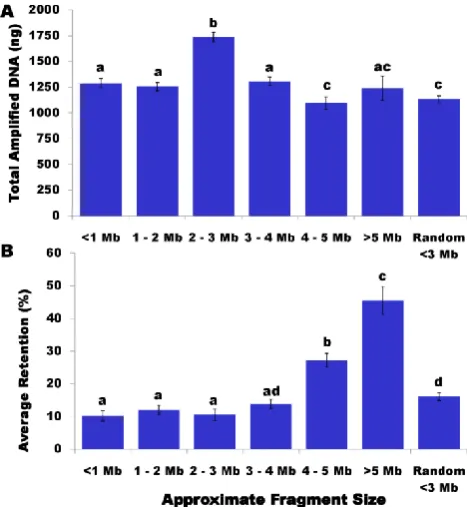
The HAPPY retention rate was calculated as the percentage of markers per line. Among 383 HAPPY lines genotyped on these 58 markers, only one line had a marker retention rate of 0%. For the remainder of the HAPPY lines, the rate varied from 1.72% to 87.93%, but averaged 14.90%. A total of 157 HAPPY lines had a retention rate of 10% and 20 samples had a retention rate of 40%. As shown in Figure 1B, the sampled fragment size had a significant effect on the marker retention rate. In particular, the HAPPY lines sampled with fragments of 4 – 5 Mb in length had a more than double the marker retention rate (27.2%) compared to lines less than 3 Mb in size (10.2% to 12%) (P<0.05) and nearly twice the figure compared to
lines with 3 – 4 Mb in size (13.8%) (P<0.05). The marker retention rate further increased to 45.5% when the HAPPY lines were sampled with fragments ranging from 5Mb to 6 Mb in size (Figure 1B) (P<0.05).
Figure 1. Effects of sampled fragment sizes on WGA yields (A) and marker retention rate (B). Data are presented as least square means ± standard error. The bars without common letters are significantly different (P<0.05).
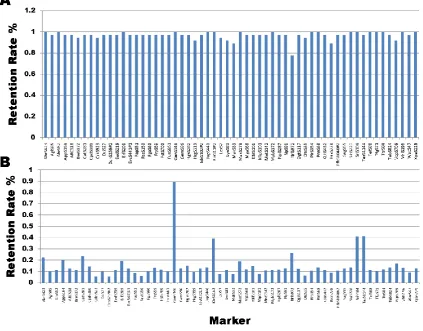
Marker retention rate remained very high (over 96%) for most of the 58 markers genotyped on four frog positive controls, because they represent whole genome DNA (Figure 2A). In contrast, 51 of these 58 genes had a 20% call rate in the HAPPY lines (Figure 2B). The remaining 7 genes include one close to 90% (GanS345) and six between 20% and 45% (Abrs423, CatS372, KinS11#2, NrlS972, Sri104 and TazS1144). The overall retention rate was 21.7% for all 58 genes in our original HAPPY panel. Hukriede and colleagues [19] formed a total of 93 RH lines to map the zebrafish genome. Among them, 81 were derived from a 5,000-rad irradiation dose and 12 from a 4,000-rad dose. After genotyping a total of 1,055 markers on the RH panel, the authors observed an overall retention
rate of ≈22%. Therefore, we would speculate that our HAPPY panel would be equivalent to a RH panel with a 5,000-rad irradiation dose.
considers both characters and their orders between a pair of strings/HAPPY lines. We then selected 146 lines that were <0.85 similar to others and formed a working panel assuming that they randomly repre-sent subsets of the frog whole genome. In order to have enough DNA for mapping a large number of markers on the HAPPY working panel, DNA ampli-fication was achieved again using WGA with the il-lustraTM GenomiPhi V2 DNA Amplification Kit (GE
Healthcare Lifesciences, Piscataway, NJ). Briefly, 2 individual reactions each with 1µl of stock DNA were separately amplified following the
manufactur-er’s instructions. After amplification, products were pooled in order to balance any bias that could have occurred during the amplification process. These pooled samples were subsequently purified with the DNA Clean & Concentrator kit (Zymo Research, Ir-vine, CA). The frog working panel of 146 lines was then used in construction of a pilot HAPPY map in the present pilot study described below.
HAPPY Mapping Using UCE Markers. Ultra-conserved elements (UCEs) are nucleotide sequences
that show extreme evolutionary conservation between two or more distinct species. In order to identify UCEs in the current X. tropicalis genome assembly, we used the human genome as our reference. The human build 37.1 contains 219 contigs (including 29 unassigned in the assembly), while frog v5.1 consists of 4,297 as-sembled scaffolds. As such, a local MegaBLAST was set up to run each of these 4,297 frog scaffolds against all human 22 autosome, X and Y chromosome assem-blies. We used the “aligned length x sequence sim
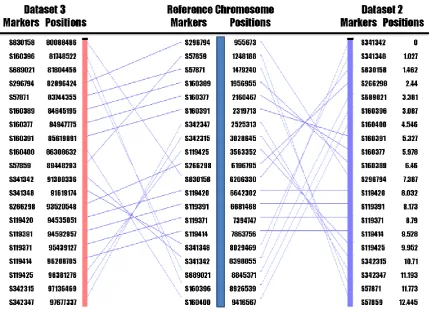
i-larity (%) = 25” as an arbitrary cut-off score for col-lecting the UCEs between human and frog, which requires at least an aligned length of 25 bp with 100% identity. After removal of UCE repeats, 51,498 puta-tive UCE orthologs were established between human and frog (data not shown). We selected 29 UCEs that span a region of 860,330 – 9,416,416 bp on human chromosome 1 as markers for this pilot study to test the feasibility of our working HAPPY panel for map construction of X. tropicalis genome. The locations of UCE markers on human chromosome 1 as well as on frog scaffolds are listed in Table 1.
Figure 3. UCE marker locations and orders on human chromosome 1 (Reference chromosome) as compared to their locations and orders on our frog HAPPY map (Dataset 2) and frog genome assembly v7.1 (Dataset 3).
These 29 UCE markers were genotyped on the working panel of 146 HAPPY lines with one multiplex set using the Sequenom assay. Among them, seven markers had a retention rate of 10% and one marker reached a retention rate of 80% (Table 1). As such, they were excluded from further analysis. Therefore, the remaining 21 UCE markers were used for map construction. In frog assembly v5.1, these 21 UCEs were distributed in scaffolds 34, 57, 119, 160, 266, 296, 341, 342, 689 and 830, respectively (Table 1). Statistical analysis using the RH2PT program of the RHMAP 3.0 package [20] assigned these 21 UCE markers to 2 linkage groups on the basis of a two-locus LOD score of at least 4.0, including 20 markers in group 1 and one marker in group 2. Just recently, we also finished identification of UCEs in the frog assembly v7.1. In-terestingly enough, these UCE markers in group 1 were assigned to scaffold 7, while the marker in group 2 was assigned to scaffold 5 (Table 1). The results in-dicate that our HAPPY assignment of markers sup-ports the newest assembly of X. tropicalis genome v7.1, which integrated 9 scaffolds in v5.1 into a large scaf-fold in v7.1.
drawn using the AutoGRAPH program with modifi-cation [21].
In summary, the whole genome amplification technique and the Sequenom SNP genotyping assay further improved the conventional HAPPY method and enhanced its capability to map various genomes. The former technique amplified enough DNA mate-rials for genotyping a large number of markers, while the latter allowed for relatively high throughput marker genotyping with multiplex assays on the HAPPY lines. Such an improved HAPPY technique made it possible for us to develop a first HAPPY panel of the X. tropicalis genome and establish a pilot HAPPY map for the species. In the near future, we anticipate that genotyping of markers on a HAPPY panel should be replaced by next generation se-quencing, contributing to formation of HAPPY pipe-line for whole genome sequencing, mapping and as-sembly [22].
Supplementary Material
Table S1: Genes selected for genotyping on the X. tropicalis original HAPPY panel.
Table S2: Putative SNPs and their flanking sequences of the gene markers genotyped on the original HAPPY panel of X. tropicalis.
Table S3. Pseudo-SNPs and their flanking sequences of UCE markers genotyped on the working HAPPY panels of X. tropicalis.
http://www.biolsci.org/v07p1037s1.pdf
Acknowledgement
This work was supported by NIH/NIGMS grant 1R01GM086321-01 to R.M.H. and D.S.R. with a subaward to Z.J.
Conflict of Interests
The authors have declared that no conflict of in-terest exists.
References
1. Dear PH, Cook PR. Happy mapping: a proposal for linkage mapping the human genome. Nucleic Acids Res. 1989; 17:6795-807.
2. Dear PH, Cook PR. Happy mapping: linkage mapping using a physical analogue of meiosis. Nucleic Acids Res. 1993;21:13-20. 3. Piper MB, Bankier AT, Dear PH. A HAPPY map of
Cryptos-poridium parvum. Genome Res. 1998;8:1299–1307.
4. Konfortov BA, Cohen HM, Bankier AT, Dear PH. A high-resolution HAPPY map of Dictyostelium discoideum chromosome 6. Genome Res. 2000;10:1737–1742.
5. Dear PH, Bankier AT, Piper MB. A high-resolution metric HAPPY map of human chromosome 14. Genomics. 1998;48:232-41.
6. Thangavelu M, James AB, Bankier A, et al. HAPPY mapping in a plant genome: reconstruction and analysis of a
high-resolution physical map of a 1.9 Mbp region of Arabidop-sis thaliana chromosome 4. Plant Biotechnol J. 2003;1:23-31. 7. Hamilton EP, Dear PH, Rowland T, et al. Use of HAPPY
map-ping for the higher order assembly of the Tetrahymena genome. Genomics. 2006;88:443-51.
8. Walter G, Tomlinson IM, Cook GP, et al. HAPPY mapping of a YAC reveals alternative haplotypes in the human immuno-globulin VH locus. Nucleic Acids Res. 1993;21:4524-9.
9. Dean FB, Hosono S, Fang L, et al. Comprehensive human ge-nome amplification using multiple displacement amplification. Proc Natl Acad Sci U S A. 2002;99:5261-6.
10. Lovmar L, Syvänen AC. Multiple displacement amplification to create a long-lasting source of DNA for genetic studies. Hum Mutat. 2006;27:603–614.
11. Pollet N, Mazabraud A. Insights from Xenopus genomes. Ge-nome Dyn. 2006;2:138-53.
12. Yergeau DA, Mead PE. Manipulating the Xenopus genome with transposable elements. Genome Biol. 2007;8 (Suppl 1):S11. 13. Klein SL, Strausberg RL, Wagner L, et al. Genetic and genomic tools for Xenopus research: The NIH Xenopus initiative. Dev Dyn. 2002;225:384-91.
14. Klein SL, Gerhard DS, Wagner L, et al. Resources for genetic and genomic studies of Xenopus. Methods Mol Biol. 2006;322:1-16.
15. Hellsten U, Harland RM, Gilchrist MJ, et al. The genome of the Western clawed frog Xenopus tropicalis. Science. 2010;328:633-6.
16. Jiang Z, He H, Hamasima N, et al. Comparative mapping of Homo sapiens chromosome 4 (HSA4) and Sus scrofa chromo-some 8 (SSC8) using orthologous genes representing different cytogenetic bands as landmarks. Genome. 2002;45:147-56. 17. Balogh MK, Børsting C, Sa´nchez Diz P, et al. Application of
whole genome amplification for forensic analysis. International Congress Series 2006; 1288:725– 727.
18. Senger F, Priat C, Hitte C, et al. The first radiation hybrid map of a perch-like fish: the gilthead seabream (Sparus aurata L). Genomics. 2006;87:793-800.
19. Hukriede NA, Joly L, Tsang M, et al. Radiation hybrid mapping of the zebrafish genome. Proc Natl Acad Sci U S A. 1999;96:9745-50.
20. Boehnke M, Lange K, Cox DR. Statistical methods for mul-tipoint radiation hybrid mapping. Am J Hum Genet. 1991;49:1174-88.
21. Derrien T, André C, Galibert F, Hitte C. AutoGRAPH: an in-teractive web server for automating and visualizing compara-tive genome maps. Bioinformatics. 2007;23:498-499.