Issues in Business Management and Economics Vol.7 (1), pp. 1-13 January, 2019 Available online at https://www.journalissues.org/IBME/
https://doi.org/10.15739/IBME.19.001
Copyright © 2019 Author(s) retain the copyright of this article ISSN 2350-157X
Original Research Article
Concentration of container flows in the port phase: the
case of the U.S West and East Coast port ranges
Received 24 September, 2018 Revised 5 November, 2018 Accepted 15 November, 2018 Published 28 January, 2019
1
Chlomoudis Constantinos
and
1
*Styliadis Theodore
1University of Piraeus, Department of Maritime Studies,
Greece.
Corresponding Author Email: [email protected]
The pressure of competition along with the incentive to extent control over ever larger and more complex logistic chains have strongly encouraged players to expand their services and scale of operations through vertical and horizontal integration, alliances and synergies. Evolutions in liner shipping as well as in terminal operations have led to a process of reorganization in both respective markets, increasing the concentration of market players. To this end, the aim of this paper is to investigate whether these concentration and centralization phenomena observed in the above markets extend also over the port phase, with selected ports concentrating large shares of container volumes. By employing several concentration methodologies, namely the CR4 and CR8, the HHI, the Gini Coefficient and the Lorenz
concentration curves, as well as a Shift Share analysis, we investigate the evolution of concentration levels in U.S West and East Coast port ranges for the period between 2005 and 2015. As our results indicate, contrary to prior studies conducted, the U.S port ranges have evolved from deconcentrated towards, highly and moderately concentrated respectively. As such, results are relevant for policy makers and port experts, as they provide an up to date picture of the U.S port ranges.
Key words: Container ports, concentration, concentration indexes, U.S West and East port range.
INTRODUCTION
Recent literature has highlighted the concentration and centralization processes that containerised liner shipping and port handling industries have undergone (Angelopoulos et al., 2017; Van de Voorde and Vanelslander, 2008; Parola et al., 2014). The pressure of competition along with the incentive to extent control over ever larger and more complex logistic chains have strongly encouraged players to expand their services and scale of operations through vertical and horizontal integration, alliances and synergies. The effects of these processes have progressively led to the consolidation of both markets by few incumbent players (i.e. Mega-Carriers and Global Terminal Operators). Added to these, the deployment of ever-larger container vessels by Mega Carriers (Merk, 2015) and the increasing presence of Global Terminal
Operators in hub-ports enhances the possibility of increased concentration of traffic flows in selected ports.
analysis. Previous studies, analysing traffic of the U.S Port system (on aggregate U.S and East-West Coast level) have revealed a structure of low concentration (Hayuth, 1988; Wang and Cullinane, 2004).
To this end our goal, is twofold. On a first level, to confirm whether this decentralized structure of the US Port system is maintained or altered by collateral market evolutions such as the aforementioned consolidation of market actors, while secondly, to provide an update on the U.S port system concentration. As such, results are relevant for policy makers and port experts, as contrary to previous periods studied, they capture and depict an increase in concentration of container traffic flows in the U.S port ranges.
The rest of the paper is structured as follows; Section 2 provides a literature review on the utilization of concentration measures within the port industry. Section 3 analyses the methodologies used to compute the level of concentration of container flows within the U.S port system’s East and West Coast respectively, while section 4 provides the data analysis and the results of our computations. Finally, in section 5, we conclude our paper with some meaningful conclusions.
Literature Review
Several studies have investigated concentration and/or de-concentration tendencies within the container port markets. According to Hayuth (1981) concentration in the port phase refers to the polarization of container traffic in few larger ports, at the expense of smaller ones. Respectively, de-concentration for Kitsos (2014) is the reverse process of shifting container flows in an increased number of ports, amongst which many are considered of medium to small scale.
Within literature, Hayuth’s (1988) study on the degree of concentration in the structure of the U.S port system is one of the primal efforts to systematically approach the particular subject matter. His analysis of container traffic in U.S ports between 1970 and 1985, utilizing the Lorenz Curve and the Gini Coefficient, illustrates an unexpected trend towards less concentration. In another early attempt to evaluate and assess load centre development, Marti (1988) implements a Shift-Share Analysis (SSA) focusing on the evolution of Pacific Basin ports with time specific data from 1974 to 1982. Results illustrate the prevalence of Oakland and Seattle as the primal U.S west coast port hubs and of Kaohsiung as the major foreign centre at the time.
In Notteboom (1997), an evaluation of concentration and de-concentration tendencies of container port traffic within the European continental port system is undertaken for the period between 1980 to 1994. By utilizing concentration ratios such as the Hirshmann-Herfindahl Index (HHI), the
Gini Coefficient, and the Lorenz Curve as well as by implementing a SSA, the author concludes that developments in the European container port system resulted in a stagnation of the level of port concentration. In a repetition of this exercise on account of European Sea Ports Organization (ESPO), Notteboom (2009) investigated 78 ports within Europe and analysed concentration of cargo traffic (containers amongst other types of cargo) for a 23 year period (1985-2008), utilizing Annual Net Shifts, Market Shares and the normalized HHI. Results reveal that the European container market remains more concentrated in comparison to other handling segments. In addition, it is observed that while the European container port system is becoming more diverse, growth of traffic has benefited slightly the largest ports, leading to an increased concentration of container flows in a limited number of ports.
Fageda (2000), attempts to investigate the evolution of concentration in the major Mediterranean container ports for the 1990-1998 interval, through the application of concentration ratios such as the Gini Coefficient, the Lorenz Curve and the HHI, in an effort to conceptualize the impact of technologic, economic and social transformations brought about by the advent of container in maritime transport. In addition, the author performs a SSA to depict the competitive positions of those port-hubs. Results confirm a highly competitive environment while advocate towards a tendency for container throughput concentration in a few dominant centres, namely Algeciras and Gioia Tauro in the West Mediterranean basin and Marsaxlokk in the East.
Contrary to the aforementioned results, Elsayeh (2015) through the application of K-CR, HHI, Gini Coefficient, Entropy Index and SSA for the period from 1998 to 2012 illustrated that the Mediterranean container market moves towards de-concentration. Elsayeh’s (2015) results are attributed to the increased number of market players in the region as well as to the more evenly distributed container traffic caused by increased inter-port competition.
regional hubs or aspire to become one.
Furthermore, in Le and Ieda (2010), a comparative examination of concentration tendencies of port systems in Japan, Korea and China is undertaken for a 30-year interval (1975-20051), through the application of HHI and of the Geo- Economic Concentration Index (GECI). The two indexes produce varied results, while illustrating the diversified evolution in concentration dynamics among the countries concerned. Japan based on HHI appears to be evolving to a more deconcentrated system while GECI suggests a fairly steady level of concentration throughout the years. Korea presents a concentration trend until 1990, captured by both indexes, followed by a moderate decline in concentration since then. Finally, China initially considering both indexes appears to have a deconcentrated port system, with the picture altering after the 90’s and especially during the period 1995-2005, leading towards a strong growth pattern of concentration (although HHI underestimates the increase in comparison to GECI).
In a more recent study, Pham et al. (2016) investigate concentration developments in container terminals in the Northern Vietnam over 2005 to 2014 by employing several methodologies, including the HHI, the CR1 and CR3, the Gini coefficient, the Lorenz curve, and SSA. Their results demonstrate a tendency towards deconcentration and considerable shifting of container cargo among its terminals; justified by the fierce competition among new and existing terminals in an effort to capture a share of the increased demand. Two other topical contributions, which measure container port concentration through the application of HHI, CR3, CR5 concentration ratios and SSA, are the publications of Varan and Cerit (2014) and of Hanafy et al. (2017). The former focuses on Turkish container ports before and after the port privatization schemes (1996-2011 period) while the latter on the Eastern Mediterranean region (1995-2014 period). Both record deconcentration dynamics and increased competition.
Apart from the measurement of concentration specifically in container ports, there have been some publications focusing on other cargo segments or on the port industry as a whole. In this category we find De Lombaerde’s and Verbeke’s (1989), assessment on the evolution of international port competition in the North-West European range for the years 1970 to 1985, who apply the technique of SSA and compute a weighted diversification index for the different ports. Their results reveal the competitive structure of the North-West European range, characterized by high stability both in terms of market shares and of weighted diversification level. Another example is Kuby’s and Reid’s (1992) empirical research, which utilizes the
1 For China, the period under study concerns the years 1980 to 2005.
Chlomoudis and Styliadis 3
Gini coefficient to measure concentration of general cargo port traffic in U.S, from 1970 to 1988. Their findings, illustrate that contrary to the results of Hayuth (1988) on containerized U.S traffic, general cargo traffic became more concentrated during the period under study, mainly due to technical change.
Finally, in Lee et al. (2014) an analysis of concentration ratios in bulk ports along the west coast of Korea is carried out for the 2005-2011 interval, with the intention to identify geographical patterns. Authors adopt a series of techniques such as HHI, Location Quotients (LQ), and Shift Effects (SE), to reach the conclusion that de-concentration has been gradually rising as a result of substantial shifting of cargo and of considerable overlapping of ports’ functions.
METHODOLOGY
As illustrated also in the literature review in the previous section, numerous measures are available to estimate market concentration. Within this section, we will further analyze, the concentration methodologies applied for the purposes of this paper, in order to reach our research objective, i.e. to examine concentration/de-concentration tendencies of container volumes within the U.S East and West Coast port system. Amongst them, we utilize the n-firm concentration ratio, the HHI as well as the Gini coefficient and the Lorenz curve. In addition we perform a SSA, to gain an insight into the evolution and development of traffic flows in the two U.S port ranges under study.
According to Bikker and Haaf (2002) amongst the most frequently utilized ones, due to its simplicity and its limited data requirements, is the n-firm concentration ratio, which aggregates, the market share of the n largest firms (in the particular case, of the n largest ports). Hence, the formula for its calculation takes the form:
--- (1)
Table 1. Interpretation of market concentration according to CR4 values
CR4 Interpretation of Market Concentration
CR4 = 0 Perfect Competition
0 < CR4 < 40 Effective Competition or Monopolistic Competition 40 ≤ CR4 < 60 Loose Oligopoly or Monopolistic Competition 60 ≤ CR4 Tight Oligopoly or Dominant Firm with a Competitive Fringe
Source: Gwin (2001)
Table 2. Interpretation of market structure based on HHI values
HHI Interpretation of Market Concentration
HHI < 0,1 Un-concentrated
0,1 < HHI < 0,18 Moderately Concentrated Markets 0.18 < HHI Highly Concentrated Markets Source: Gwin (2001)
following classification of CR4 values, is presented in Table 1. While for CR8 values, Yasar & Kiraci (2017) support Durukan’s and Hamurcu’s (2009) argument that a CR4 level of 50% corresponds to a CR8 level of 70%.
However, apart from the simplicity and straightforwardness of calculating the n-firm concentration ratio, the latter has been under criticism within literature. Criticism focuses on the fact that it takes into account only a certain number (of the n largest) and not all firms operating in an industry (Pavic et al., 2016), thus often providing a misleading picture with regards to the market structure and its respective level of competition.
Unlike the n-firm ratio, the HHI, the other widely utilized measure to determine the concentration level within an industry, overcomes this handicap by taking into account the complete composition of the market. This index’s calculation is also straightforward, as it simply requires to sum up the squares of the market shares of all firms in the market (Allardice and Erdevig, 1966), thus taking the following form:
--- (2)
Where Si is the market share of the ith firm within the market, while n is the number of firms. As indicated by the equation, the index stresses the importance of firms with larger market shares by assigning them proportionately a greater weight than smaller ones and thus increasing the HHI value (Calkins, 1983). The HHI has a maximum value of 1 when one firm dominates the market and hence concentration is high, and a minimum value of 1/K when market shares are evenly distributed among participating firms and thus effective competition exists. For more than three decades, antitrust regulators have utilized the HHI index to gauge whether prospective mergers would potentially result in a harmful increase in concentration, causing anticompetitive behavior (Roberts, 2014). The U.S Department of Justice (DOJ) as well as the Federal Trade Commission (FMC), divide the spectrum of market
concentration as measured by the HHI, into three regions as shown in the Table 2 above. As it takes into account the entirety of the market, HHI appears to be a more reliable method to measure concentration than the n-firm ratio, however Pehlivanoğlu and Tiftikçigil, (2013) support that they both show a mutually complementary structure.
In addition to the above indices, the Gini coefficient derived from the Lorenz Curve is a popular statistical measure of income distribution and inequality however, as stated in Sys (2009) it also serves for the measurement of market concentration. More particularly, the Lorenz Curve compares the distribution of a selected variable (in our case port throughputs) with the uniform distribution that represents equality, shown by a diagonal line, the egalitarian line (Ameryoun et al., 2011), while the Gini coefficient is equal to the area between the egalitarian line of equal distribution and of the observed Lorenz Curve. As such, the further the Lorenz Curve deviates from this line of total equality, the greater the inequality and thus the concentration will be (Notteboom, 2006). Although many calculation formulas exist, within the framework of this paper, we will utilize a variant Gini ratio, applied particularly to prior studies within the port sector (Wang and Cullinane, 2004) and its formula is depicted below.
and 0 < G < 1 --- (3) With G= Gini coefficient for a given firm, i.e. port, N= the number of firms, i.e. ports, Xi= the cumulative percentage of the number of firms, i.e. ports, while Yi= the cumulative percentage of market shares of all firms, i.e. cargo throughput of all ports. The value of Gini Coefficient ranges between zero and unity. When all firms, i.e. ports are of equal size, the value of Gini coefficient is 0, and the Lorenz curve coincides with the egalitarian line denoting that no concentration exists. On the opposite extreme of one firm domination, Gini’s value reaches 1, denoting full concentration of container traffic within the market.
Chlomoudis and Styliadis 5
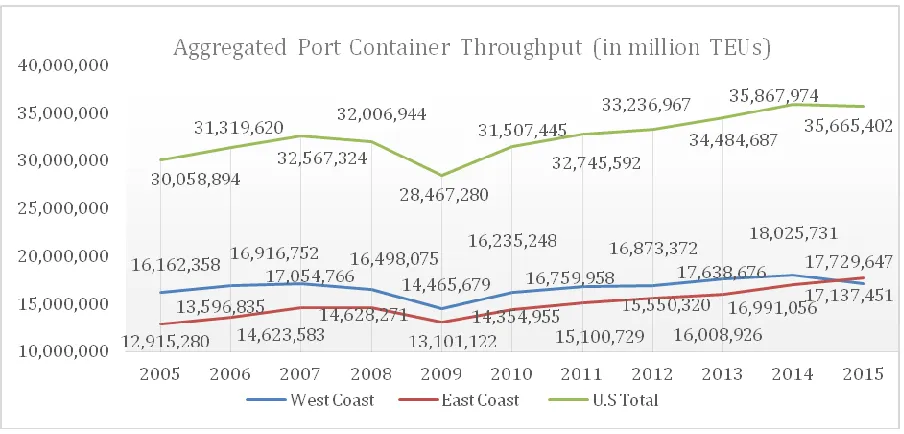
Figure 1: Port Container Volumes (million TEUs) on U.S aggregate level, West & East Coast level(Source: own illustration according to data analysis from U.S Army Corp. Of Engineers, 2018)
concentration, however it is a popular method for analyzing regional economic growth and decline within time by assessing the overall performance, development and importance of a region/firm in comparison to other regions/firms (Stejskal and Matatkova, 2012). To this end, SSA can and has been utilized within port studies literature for analyzing the evolution and development of port complexes (Lombaerde and Verbeke, 1989; Wang and Cullinane, 2002). For its application it is necessary to divide the observed change (growth or decline) in two separate components, namely the “share” and the “shift” effect. On the one hand, the first depicts the necessary growth in the output of a firm, in our case the growth in port throughput, that would allow the latter to maintain its position within the market. While on the other hand, the “shift” effect, on a given level of output, depicts the amount of output won or lost by a firm to its competitors, i.e. port traffic gained or lost to/from other ports. In that sense SSA is a zero-sum game where one’s gains are somebody else’s losses (Piezas-Jerbi and Nee, 2009). For the purposes of this study, we will employ the shift-share analysis formula presented by Notteboom (1997) which applies specifically for ports:
--- (4)
--- (5) --- (6)
Where ABSGRi= the absolute growth of container traffic of a port i for the period t1-t0 (in TEU), SHAREi= share effect in TEU of a port i for the period t1-t0, SHIFTi= the shift effect in
TEU of a port i for the t1-t0, TEU= the container throughput of a port i, while n= is the number of container ports within the port system.
Case Study: U.S East and West Coast port ranges Overview of the U.S East and West Coast container ports
The lifeblood of U.S economy passes through its ports, rendering them an engine of growth for the worlds’ leading economic power (U.S Maritime Administration, 2009). Similarly, to all major waterborne ranges around the world, the forces of globalization, integration and containerization have also transformed the North American port ranges (Rodrigue and Guan, 2009). Amidst two major international container trade routes, i.e. the transpacific and transatlantic, the U.S port system can be categorized in two port ranges, namely the West and East Coast range. For the purposes of this exercise, the former consists of all coastal ports in the States of Washington, Oregon, California, Alaska and Hawaii while the latter consists of ports in the Eastern Coast shoreline, from Maine to Texas. The evolution of container traffic in both port ranges, as well as on an aggregate U.S level2, for the decade 2005 to 2015 is shown in the Figure. 1.
As depicted, on an aggregate U.S basis, with the exception of the 2008-2009 interval and of a slight slump in 2015, container volumes have been steadily increasing within the time-period under study. More particularly, despite the observed decrease in container
2 Container volumes on an aggregate U.S level include also inland and lake
Table 3. CR4 & CR8 Concentration Ratios over U.S West Coast port range
U.S WEST
COAST 2005 2006 2007 2008 2009 2010 2011 2012 2013 2014 2015
CR4(%) 78,4611 80,2455 79,8742 81,0414 81,1932 83,1028 82,6803 80,082 80,4479 81,8015 81,7025 CR8(%) 96,7905 96,3846 96,2563 96,6516 96,7672 96,8952 96,5553 95,5650 94,6905 94,9337 95,1020
(Source: own illustration according to data analysis from U.S Army Corp. Of Engineers, 2018)
Table 4. CR4 & CR8 Concentration Ratios over U.S East Coast port range
U.S EAST
COAST 2005 2006 2007 2008 2009 2010 2011 2012 2013 2014 2015
CR4(%) 62,0676 61,4940 61,9098 62,9206 63,6287 63,9408 63,9611 63,7615 62,4239 60,6837 63,1391 CR8(%) 88,0692 85,0399 84,4458 84,7526 84,4411 85,1507 85,1771 84,9838 83,9722 82,2552 84,5112
(Source: own illustration according to data analysis from U.S Army Corp. Of Engineers, 2018)
throughputs due to the global economic downturn of 2008, port volumes rebounded in 2010, while in the following year, overcame the pre-crisis throughput levels. Accordingly, the West and East coast port ranges, present more or less a similar fluctuation over the years. However, although East coast’s container volumes had been diachronically lower than that of West coast’s, due to the fact that the annual increases of the former were proportionately greater, on 2015 for the first time the East coast’s port container volumes surpassed those of the West coast.
Assessment of concentration in U.S East and West Coast ports’ between 2005 and 2015
Within this section, we present the results of our calculations. U.S Waterborne data sets of annual port container volumes for the 2005-2015 interval, have been withdrawn from the U.S Army Corp of Engineers (ACE). As said in section 3, for the purposes of this study we will utilize the following concentration measures: CR4 and CR8 concentration ratios, the HHI as well as the Gini coefficient and the Lorenz Curve.
Table 3, illustrates the concentration ratios of the four and eight largest container ports of the west coast of the U.S. from 2005-2015. The results demonstrate that for the whole period under examination, both CR4 and CR8 values remain extremely high, denoting a very high level of concentration and an oligopoly in the West coast container port market respectively. More specifically, the concentration of the four largest container ports surpasses the 60% threshold while respectively the cumulative percent of the eight largest container ports is stabilized above 96%, with very small fluctuations from 2005 to 2011. From 2012 and forth, there is a slight decrease of 1-1.5% approximately, which is insignificant and not actual proof of a de-concentration tendency.
As far as the ports included in the CR4 and CR8 ratios are concerned, little variation from year to year has been observed. Amongst the top four West coast container ports, Los Angeles, Long Beach and Oakland steadily withhold the first three positions, while Tacoma and Seattle alternate in the fourth. Respectively, the rest of the largest ports that complete the top 8 (with container volumes, considerably lower than those of the top 4) include those of Honolulu, Anchorage and Portland (with an exception in 2015, where port of Juneau reached the 8th place).
Similarly, Table 4, illustrates the CR4 & CR8 ratios of ports in U.S East coast from 2005-2015. In comparison to those of the West coast, both CR4 and CR8, have significantly lower values, indicating lesser concentration and more competition between the container ports. More particularly, CR4 values are stable within the examination period, ranging between 61,9% and 63%, surpassing however, the 60% threshold. CR8 values respectively, range between 88% and 82%, presenting a consistent decline over 2005-2015, with an overall decrease of approximately 3,5%. This however, is not interpreted necessarily as a sign of de-concentration in the East Coast port range, as the decrease is relatively small, in relation to the exhibited levels of concentration. In addition to this argument, container ports of the East Coast range included in the two indexes, might present some variation on a year to year basis, however this is also small, as in the case of the West Coast range. Indicatively, the top 4 container ports for the majority of years are New York –New Jersey (NYNJ), Savannah, Norfolk Harbor and Houston. Respectively, the ports that conclude the top 8 include Miami, Port Everglades, Jacksonville, Charleston, Port of Virginia and Elizabeth River.
Chlomoudis and Styliadis 7
Figure 2: Concentration Measurement with HHI, over U.S West & East Coast port ranges (Source: own illustration according to data analysis from U.S Army Corp. Of Engineers, 2018)
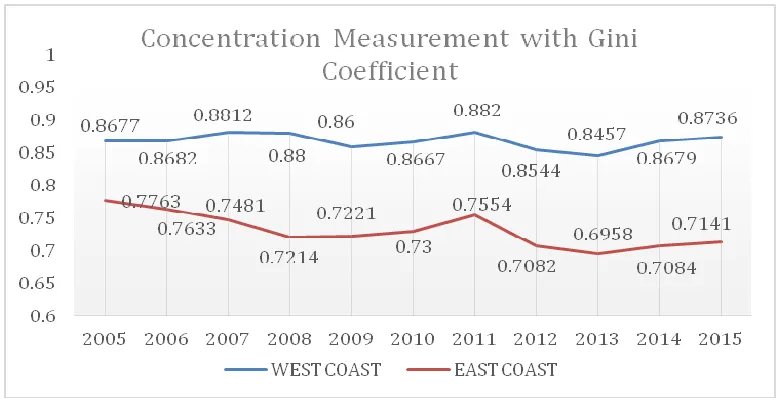
Figure 3: Concentration Measurement with Gini Coefficient, over U.S West & East Coast port ranges (Source: own illustration according to data analysis from U.S Army Corp. Of Engineers, 2018)
flows in comparison to the East Coast range. More analytically, the West Coast port range, records a 6% increase in the HHI over the decade under study, while being consistently high (despite some small slumps in some years) and well beyond the upper region of 0.18, thus signifying a high degree of market concentration. Conversely, the Eastern Coast range, presents a decline of about 4% in the HHI over the same period. However, the latter’s values have been steadily within the medium region between 0.1 and 0.18, hence indicating a moderate level of concentration.
Furthermore, as far as the Gini Coefficient is concerned, the results for both West & East Coast port ranges are shown in Figure 3 above. With respect to the West Coast range, results illustrate a slight increase in the Gini values over 2005-2015 and minor fluctuations, reaching its peak
in 2011. As observed, yearly results approximate to the maximum value, indicating in line with the above observations a highly concentrated western port system, with increased inequality among the participating container ports. Consistent with the other indexes’ results, are also those concerning the Eastern range. Gini values, illustrate a declining trend (with an exception in 2011 and 2014-2015) while also being significantly lower than those observed in the West Coast. Despite the decline however, Gini values are considered relatively high, indicating moderate concentration and inequality and hence, greater competition within the range.
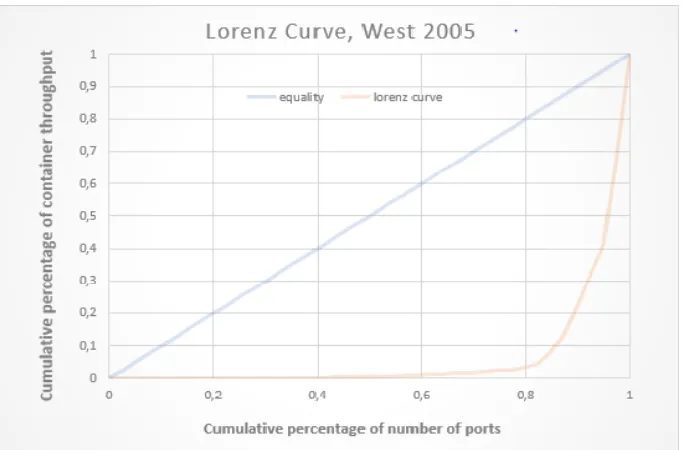
Figure 4: Lorenz Concentration Curves U.S West Coast port range (2005)
(Source: own illustration according to data analysis from U.S Army Corp. Of Engineers, 2018)
Figure 5: Lorenz Concentration Curves U.S West Coast port range (2015)
(Source: own illustration according to data analysis from U.S Army Corp. Of Engineers, 2018)
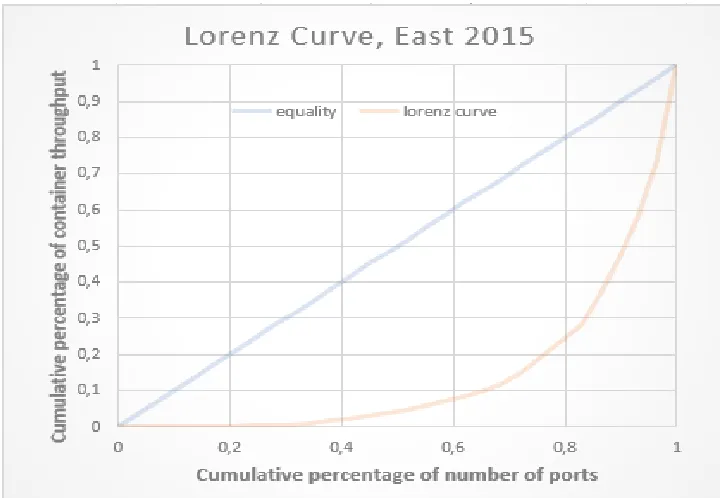
Coast, Lorenz Curves depicted in Figures 6 and 7 present analogous though more moderate results, while it can be seen that in comparison to 2005, 2015 results depict a slight decrease in inequality among Eastern range ports.
Table 5 illustrates the results of SSA on West Coast range (for a sample of Top 8 Ports) for three consecutive time
Chlomoudis and Styliadis 9
Figure 6: Lorenz Concentration Curves U.S East Coast port range (2005)
(Source: own illustration according to data analysis from U.S Army Corp. Of Engineers, 2018)
Figure 7: Lorenz Concentration Curves U.S East Coast port range (2015)
(Source: own illustration according to data analysis from U.S Army Corp. Of Engineers, 2018)
350 thousand and 218 thousand TEUs respectively. In the 2008-2012 interval, however, Seattle recuperates most of its losses with an increase in volumes around 210 thousand TEUs, followed by smaller volume gains recorded in Los Angeles and Oakland. Again amongst those which record bigger losses, are the ports of Long Beach, Honolulu,
Tacoma and Portland. Finally, during the last interval, Long Beach and Tacoma are the major winners with significant gains in volumes while on the contrary Seattle, Los Angeles and Portland loose the greatest market volumes.
Table 5: SSA on West Coast port range between 2005-2008, 2008 – 2012 & 2012-2015 (sample of Top 8 Ports)
SSA WEST COAST:PORT STATE 2005-2008 2008-2012 2012-2015
Los Angeles CA 1.146.077 151.127 -146.275
Long Beach CA -357.092 -129.023 458.533
Oakland CA -12.979 143.032 -34.172
Tacoma WA -86.900 -70.717 258.956
Seattle WA -218.551 210.984 -362.456
Honolulu HI 81.437 -71.666 10.625
Anchorage AK 128.262 -6.173 38.262
Portland OR 111.979 -48.172 -139.461
(Source: own illustration according to data analysis from U.S Army Corp. Of Engineers, 2018)
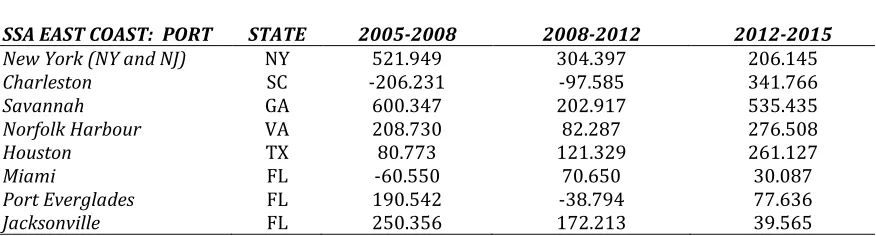
Table 6: SSA on East Coast port range between 2005-2008, 2008 – 2012 & 2012-2015 (sample of Top 8 Ports)
SSA EAST COAST: PORT STATE 2005-2008 2008-2012 2012-2015
New York (NY and NJ) NY 521.949 304.397 206.145
Charleston SC -206.231 -97.585 341.766
Savannah GA 600.347 202.917 535.435
Norfolk Harbour VA 208.730 82.287 276.508
Houston TX 80.773 121.329 261.127
Miami FL -60.550 70.650 30.087
Port Everglades FL 190.542 -38.794 77.636
Jacksonville FL 250.356 172.213 39.565
(Source: own illustration according to data analysis from U.S Army Corp. Of Engineers, 2018)
same intervals for a sample of Top 8 port in the Eastern Coast. Contrary to the large shifts of volumes observed in the West Coast, the majority of the largest Eastern Coast ports appear to gain volumes over the three intervals under examination. Amongst the winners, the ports of New York and New Jersey, Savannah, Norfolk Harbour and Huston, gain significant volumes in all three intervals. These gains are of course in the expense of small and medium size ports, which lost considerable amounts of traffic. Exception to the above is the port of Charleston, which in the first two intervals lost around 206.000 and 97.000 TEUs respectively. However, also Charleston in 2012-2015 recorded massive volume gains of more than 341.000 TEUs.
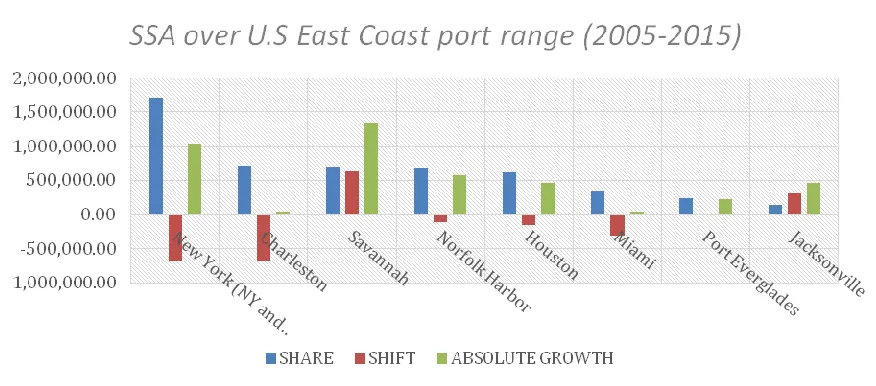
Finally, in the two Figures below (8 and 9) a SSA over the 2005-2015 period is undertaken. As it can be observed, ports of the West Coast range experienced greater shifts of volumes in comparison to those of the East. Specifically, ports of Long Beach, Seattle and Portland lost considerable amount of volumes to their rivals, while on the contrary Los Angeles, and Anchorage where among the ones that increased their market shares.
Respectively, as indicated above, the majority ports in the East Coast range illustrated an increase in market share
over the 2005-2015 period. Amongst the winners are the ports of Savannah, which recorded the biggest growth followed by NYNJ, Norfolk Harbor, Houston, Jacksonville and Port Everglades. Ports of Charleston and Miami are the only exceptions in the East Coast, recording insignificant gains.
DISCUSSION
Chlomoudis and Styliadis 11
Figure 8: SSA over U.S West Coast port range during 2005 to 2015 interval (sample of top 8 ports).
(Source: own illustration according to data analysis from U.S Army Corp. Of Engineers, 2018)
Figure 9: SSA over U.S East Coast port range during 2005 to 2015interval (sample of top 8 ports) (Source: own illustration according to data analysis from U.S Army Corp. Of Engineers, 2018)
volumes have benefited the major hub-ports, increasing their market shares.
As such, our results contradict those of previous studies on the U.S port system such as Hayuth’s (1988) and Wang & Cullinane’s (2004), denoting a progression from a decentralized port system into a concentrated one, in which a few major ports on both ranges increase their share of container volumes handled in the expense of smaller ones. However, this evolution does not come as a surprise considering collateral market factors such as the deployment of ever-larger container vessels as well as the proliferation liner alliances amongst Mega Carriers and the increasing presence of Global Operators terminal in operations. Although it is not within the scope of this study
and increase their share of volumes handled.
CONCLUSIONS
In the era of containerization, of intermodal transport evolutions, and of incumbent players both in liner shipping and terminal operations, the U.S West and East Coast port system is experiencing too, a phase of consolidation, with major ports increasing their share of the volumes handled in expense of smaller ones. Globalization of production and consumption have surely been a driving force over the aforementioned evolution. This process of concentration, extending over the port phase, has led to the domination of a handful of load-centers in both the West and East Coast port ranges. Using multiple concentration methodologies and analytical tools, our empirical results illustrate, contrary to previous studies that denoted de-concentration tendencies, that container volumes on the West Coast appear highly concentrated, while those of the East Coast also do, although in a lesser extent. As such, it can be argued that both U.S West and East Coast port ranges have evolved from being deconcentrated towards high and moderate concentration levels respectively, over the 2005-2015 period under study. To this end, the contribution of this study within literature lies in the fact that it depicts the evolved and altered market structure of the U.S port ranges.
Conflict of Interests
The authors declare that there is no conflict of interests regarding the publication of the paper.
REFERENCES
Allardice DR, Erdevig E (1966). The significance and measurement of concentration. Southern Economic J. 32: 429-39.
Ameryoun A, Meskarpour-Amiri M, Dezfuli-Nejad ML, Khoddami-Vishteh HR, Tofighi S (2011). The assessment of inequality on geographical distribution of non-cardiac intensive care beds in Iran. Iranian J. Public Health, 40(2), 25.
Angelopoulos J, Chlomoudis C, Styliadis T (2017). Effect of global supply chain developments on the governance of port regulation. In Pettit, S. & Beresford, A. (Eds.). Port Management: Cases in Port Geography, Operations and Policy (pp. 62-93). Kogan Page Publishers
Bikker JA, Haaf K (2002). Measures of competition and concentration in the banking industry: a review of the literature. Economic & Financial Modelling, 9(2): 53-98. Borenstein S, Bushnell J, Knittel CR (1999). Market power
in electricity markets: Beyond concentration measures. The Energy J., pp. 65-88
Calkins S (1983). The new merger guidelines and the Herfindahl-Hirschman Index, California Law Review. 71 (6): 402-429.
De Lombaerde P, Verbeke A (1989). Assessing International Seaport Competition: A Tool for Strategic Decision Making. Int. J. Transport Econ. 16(2): 175-192.
Elsayeh ME (2015). The Impact of Port Technical Efficiency on Mediterranean Container Port Competitiveness (Doctoral dissertation, University of Huddersfield). Fageda X (2000). Load centres in the mediterranean port
range: ports hub and ports gateway.
Gwin CR (2001). A guide for industry study and the analysis of firms and competitive strategy. http://faculty.babson.edu/gwin/indstudy/index.htm Hanafy NA, Labib AA, El-Haddad EF, Abd-El-Salam EM
(2017). Analytical approach to the market of the container ports in the east mediterranean region using the concentration ratio, HHI, shift–share analysis. The Bus. Manag. Rev. 8(5): 192-199.
Hayuth Y (1981). Containerisation and the Load Centre Concept. Economic Geography. 57: 160-176.
Hayuth Y (1988). Rationalization and Deconcentration of the US Container Port System. The Professional Geographer. 40: 279-288.
Kitsos V (2014). Changes of concentration patterns in European container ports during and after the crisis. (Doctoral dissertation, Msc thesis, Host University: Erasmus Universities of Rotterdam, Rotterdam).
Kuby M, Reid N (1992). Technological change and the concentration of the U.S. General Cargo Port System: 1970-1988, Economic Geography, 68 (3): 272-289. Lam JS, Yap WY, Cullinane K (2007).Structure, conduct and
performance on the major liner shipping routes. Maritime Pol. Manag., 34(4): 359-381.
Le Y, Ieda H (2010). Evolution Dynamics of Container Port Systems with a Geo-Economic Concentration Index. Asian Transport Studies, 1(1): 46-61.
Lee T, Yeo GT, Thai VV (2014). Changing concentration ratios and geographical patterns of bulk ports: the case of the Korean west coast. The Asian J. Shipping and Logistics. 30(2): 155-173.
Marti B (1988). The Evolution of Pacific Basin Load Centres, Maritime Policy and management. 15(1):57-66.
Merk O (2015). The Impact of Mega-Ships. Published for SRM Maritime-Economy. Available:http://www.srm- maritimeconomy.com/wp-content/uploads/2015/09/sr-megaships-eng.pdf
Miljković M, Filipović S, Tanasković S (2013). Market concentration in the banking sector: Evidence from Serbia. Industrija. 41(2): 7-25.
Development in the European Container Port System. J. Transport Geography. 5(2): 99-115.
Notteboom T (2009). Economic analysis of the European seaport system. Report for the European Sea Ports Organization, Antwerp: ITMMA, University of Antwerp, Notteboom TE (2006). Traffic inequality in seaport systems
revisited. J. Transport Geography. 14(2): 95-108.
Parola F, Satta G, Caschili S (2014). Unveiling co-operative networks and ‘hidden families’ in the container port industry. Maritime Policy & Manag., 41(4): 384-404. Pavic I, Galetic F, Piplica D (2016). Similarities and
differences between the CR and HHI as an indicator of market concentration and market power. British J. Econ. Manag. and Trade. 13(1): 1-8.
Pehlivanoğlu F, Tiftikçigil BY (2013). A concentration analysis in the turkish iron-steel and metal industry. International J. Econ. Practices and Theories. 3(3): 152-167.
Pham TY, Jeon JW, Dang VL, Cha YD, Yeo G T (2016). A Longitudinal Analysis of Concentration Developments for Container Terminals in Northern Vietnam. The Asian J. Shipping and Logistics 32(3): 157-164.
Piezas-Jerbi N, Nee C (2009). Market shares in the post-Uruguay round era: A closer look using shift-share analysis. Prepared for World Trade Organization: Economic Research and Statistics Division, Geneva. Roberts T (2014). When Bigger Is Better: A Critique of the
Herfindahl-Hirschman Index’s Use to Evaluate Mergers in Network Industries. Pace Law Review. 34(2): 894. Rodrigue JP, Guan CH (2009). Port hinterland divergence
along the North American Eastern seaboard. Notteboom, T., De langen P, Ducruet C, Ports in Proximity: Essays on Competition and Coordination among Adjacent Seaports, Londres, Ashgate: 131-160.
Rosenbluth G (1955). Measures of concentration. In Business concentration and price policy. Princeton University Press. 57-99.
Stejskal J, Matatkova K (2012). Assessment of shift-share analysis suitable for identification of industrial cluster establishing in regions. Ekonomicky casopis 60(9): 935-948.
Sys C (2009). Is the container liner shipping industry an oligopoly? Transport policy. 16 (5): 259-270.
U.S Army Corp. Of Engineers (2018). U.S. Waterborne Container Traffic in 2015 – 2005. Available: http://www.navigationdatacenter.us/wcsc/containers.ht m
U.S Maritime Administration (2009). America’s Ports and Intermodal Transportation System. Available: http://www.glmri.org/downloads/Ports&IntermodalTra nsport.pdf
Van De Voorde E, Vanelslander T (2008). Market power and vertical and horizontal integration in the maritime
Chlomoudis and Styliadis 13
shipping and port industry (No. 2009-2). OECD/ITF Joint Transport Research Centre Discussion Paper.
Varan S, Cerit AG (2014). Concentration and competition of container ports in Turkey: A statistical analysis. Dokuz Eylül Üniversitesi Denizcilik Fakültesi Dergisi, 6(1). Wang TF, Cullinane KPB (2004).Industrial concentration in
container ports. In International Association of Maritime Economists Annual Conference, Izmir (Vol. 30).