Physician and patient management of type 2
diabetes and factors related to glycemic control
in Spain
Nicole Rae Yurgin1
Kristina Secnik Boye1
Tatiana Dilla2
Núria Lara Suriñach3
Xavier Badia Llach3
1Eli Lilly and Company, Indianapolis, IN, USA; 2Eli Lilly and Company, Spain; 3HEOR, IMS Health, Spain
Correspondence: Núria Lara Suriñach Health Economics and Outcomes Research, IMS Health, Dr. Ferran 25–27, 08034 Barcelona, Spain
Email nlara@es.imshealth.com
Abstract: The objective of this study was to assess current treatment patterns, blood glucose test strip usage, and treatment compliance in patients with type 2 diabetes mellitus (T2DM) in primary care centers in Spain, and to assess factors related to glycemic control. We conducted a retrospective chart review of patients with T2DM and measured treatment compliance using the Morisky-Green questionnaire. 294 patients were included in the study from a population of patients attending 30 primary care centers throughout Spain. Results showed that the majority of patients were treated with oral monotherapy (36%) and oral combination therapy (35%). Less than half of the patients had good glycemic control (HbA1c 6.5%). Half of the patients treated pharmacologically reported good compliance with treatment. Logistic regression analyses performed to identify factors associated with glycemic control showed that high body mass index (BMI) and poor compliance were the strongest predictors of poor HbA1c control (OR: 2.198 and 1.789, respectively, p 0.05). In conclusion, in the course of managing diabetes, physicians and patients should attempt to improve compliance and lower BMI, which could lead to better glycemic control.
Keywords: treatment adherence, treatment pattern, glucose control, diabetes, primary care
Introduction
Diabetes mellitus is a highly prevalent, chronic disease which can signifi cantly impact morbidity and mortality. Type 2 diabetes mellitus (T2DM) is the most common form of diabetes and represents approximately 90% of all diagnosed cases of diabetes (Benito et al 2004). Although it is diffi cult to calculate the prevalence of T2DM accurately because of variations in the rate of nondiagnosed cases ranging from 15% to 50% (Bayo et al 1996; Laing and Williams 1996; King et al 1998; Zimmet et al 2001), estimates of the prevalence of diabetes in Europe and North America range from 5% to 10% (Laing et al 1996). Prevalence in Spain is estimated to be about 6% (Bayo et al 1996; Tamayo-Marco et al 1997). The number of cases of diabetes in Spain is therefore high and is expected to continue rising. According to the World Health Organization (WHO), in the year 2000, there were approximately 2.7 million cases of diabetes in Spain and the number was expected to increase to over 3.7 million by 2030 (WHO 2007). Diabetes is associated with chronic microvascular and macrovascular complica-tions, such as a blindness and cardiovascular disease, and is one of the leading causes of death worldwide and in Spain (Benach et al 2001; Roglic et al 2005). In 2004, the standardized mortality rate was estimated to be approximately 14 per 100,000 in Spain (WHO Regional Offi ce for Europe 2007).
good glycemic control (Cramer 2004). Poor compliance may also lead to poor outcomes with pharmacological treatment, though compliance with diabetes treatment has not been widely studied. Self-monitoring of blood glucose could also play a role in improving treatment outcomes. This is espe-cially true with insulin treatment because patients can adjust their dose depending on the outcome of their blood glucose test results. The American Diabetes Association (ADA) recommends self-monitoring of blood glucose (SMBG) as an important component of the care of all patients treated with insulin. However, the role and optimum frequency of such monitoring in patients with T2DM is still under debate (Farmer et al 2007), particularly in the case of patients receiving noninsulin treatment. Excessive use of SMBG can also lead to signifi cant economic expense and psychological impact (Gallichan 1997). To inform this debate, it would be useful to know the current level of test strip usage for patients with diabetes in Spain.
Because little information was available on how patients with T2DM are treated in the primary care setting in Spain, this study was designed to identify current treatment pat-terns, to assess patients’ compliance with their treatment plans, and to estimate the use of blood glucose test strips. A further objective of the study was to determine which sociodemographic and clinical variables were most closely associated with the likelihood of achieving target levels of glycemic control and thus with reducing the risk of morbidity and mortality.
Methods
This was a retrospective medical chart review of patients with T2DM. Data collected included patient background informa-tion and a patient self-assessment of treatment compliance. A total of 30 primary care physicians took part in the study from July 2005 to September 2006 and were selected from 16 autonomous regions based on the geographical distribution of the population of Spain (Table 1).
To be included in the study, patients had to be over 20 years of age and to have had T2DM (diagnosed using ADA criteria) (ADA 2005) for at least one year. Inclusion was also dependent on the availability in the healthcare center of a clinical record containing minimum basic information (ie, age, gender, educational level, duration of diabetes/age at diagno-sis, 1 HbA1c record within the last 12 months, a list of any prescribed glucose-lowering medications that were taken dur-ing the three months prior to the HbA1c test, a body mass index (BMI) value within the six months prior to the HbA1c test, and documentation concerning the current glucose-lowering
treatment regimen). Each physician included up to 10 patients in the study. Potential candidates for inclusion were asked to participate during one of their scheduled visits. Patients agree-ing to participate were requested to sign an informed consent form and were then given the study materials including the Morisky-Green questionnaire on treatment compliance. Sociodemographic and clinical variables relating to diabetes history, treatment patterns (duration and type of treatment), and current use of test strips (times per week) were collected by the physician from patients’ clinical records. Patients’ waist circumference was measured during this offi ce visit. The study was approved by the ethics committee of the Fundació Jordi Gol i Gurina, Barcelona, Spain.
Table 1 Distribution of sample by geographical zones and autonomous regions
Geographical areas
Autonomous regions
n (%)
East (34.6%)* Aragon 10 (3.4%)
Balearic Islands 8 (2.7%)
Catalonia 51 (17.3%)
Murcia 10 (3.4%)
Valencia 28 (9.5%)
Total 107 (36.4%)
North (16.8%)* Asturias 13 (4.4%)
Cantabria 10 (3.4%)
Galicia 10 (3.4%)
La Rioja 10 (3.4%)
Navarre 6 (2%)
Total 49 (16.7%)
South (25.1%)* Andalusia 47 (16%)
Canary Islands 12 (4.1%)
Extremadura 13 (4.4%)
Total 72 (24.5%)
Center (23.5%)* Castilla-La Mancha 13 (4.4%)
Castilla y León 14 (4.8%)
Madrid 39 (13.3%)
Total 66 (22.4%)
Treatment compliance
Treatment compliance was assessed using the Spanish ver-sion of the self-administered Morisky-Green questionnaire. The questionnaire has been shown to have good internal reliability (Morisky et al 1986) and consists of the following four items:
1. Do you ever forget to take your medicine?
2. Are you careless at times about taking your medica-tion?
3. When you feel better, do you sometimes stop taking your medicine?
4. Sometimes if you feel worse when you take the medicine, do you stop taking it?
Response options are dichotomous (yes = 1, no = 0). The total score ranges from 0 to 4. Treatment compliance was categorized as high (score = 0), moderate (score between 1 and 2), and low (score 3) based on the overall Morisky-Green score. This questionnaire was administered only to patients receiving pharmacological treatment. Treatment compliance was analyzed descriptively and comparatively based on treatment type.
Analysis
Data analysis was performed using SAS 8.02 software (SAS Inc., Cary, NC, USA). A signifi cance level of less than 0.05 was used as a criterion for statistical signifi cance in all statistical comparisons. Prior to performing statistical analyses, data completeness and data quality were assessed. In general, analysis of variance (ANOVA) was used to analyze continuous variables and the χ2 test was used for
categorical variables. Other statistical techniques were used as required.
A descriptive analysis of sociodemographic character-istics and T2DM history was performed. Current treatment patterns and the length of time the patient had been receiv-ing pharmacological treatment were assessed. For patients on insulin treatment, the current number of insulin units per week and the type of insulin (brand name) were collected at 1, 6, 12, and 18 months after initiation of insulin treatment. In addition, the proportion of patients using glucose test strips for SMBG and the number of times per week they used them were analyzed for the sample as a whole and by treatment type. Patients were categorized by BMI as follows: overweight (25 BMI 30), obese (30 BMI 35) or severely obese (BMI 35).
A logistic regression was conducted to analyze factors associated with the level of compliance. The dependent vari-able was categorized as high, moderate or low compliance.
The independent variables used in the model were: treatment type (treatment with oral antidiabetic medications [OAMs], and insulin treatment with or without OAM[s]), HbA1c value, sociodemographic variables, and complications of diabetes mellitus (no complications, only microvascular complications, only macrovascular complications, and both microvascular and macrovascular complications).
A second logistic regression was conducted to analyze factors associated with the level of HbA1c control. The dependent variable was defi ned as a dichotomous variable, which categorized an HbA1c of less than or equal to 6.5% as good glycemic control and an HbA1c of greater than 6.5% as poor glycemic control (IDF 2005). The independent variables introduced were: patient education level (completed at least primary education and less than primary education), number of years since T2DM diagnosis, patient treatment (no phar-macological treatment, treatment with OAM[s], and insulin treatment with or without OAM[s]), BMI (nonobese versus obese/severely obese), vascular complications of diabetes mellitus (no complications, only microvascular complications, only macrovascular complications, and both microvascular and macrovascular complications), and treatment compliance (high compliance versus low/moderate compliance).
Results
A total of 339 patients with T2DM visited their physicians during the study period. Of these, 294 (86.7%) were selected to take part in the study. Of the 45 patients that did not partici-pate, the main reasons for nonparticipation were: no available data (35.7%), did not meet inclusion criteria (30.8%), with-held consent to take part in the study (11.5%), and exclusion for other reasons (22%). Because the study consisted of only one visit, there were no withdrawals during the study.
Patient characteristics
6.5%) in fewer than half of the patients. Almost half of patients in this study (47.4%) had microvascular complications, mac-rovascular complications, or both micro- and macmac-rovascular complications. More specifi cally, cardiovascular disease was present in 38.1% of the patients, renal complications in 28.9%, retinopathy complications in 17.7%, neuropathy in 12.2%, and foot ulcer complications in 4.1%. In terms of body weight, only 16.1% of patients had a BMI that was considered normal or underweight (BMI less than 25). More than 45% were over-weight (25 BMI 30), and 38% were obese (30 BMI 35) or severely obese (BMI 35). The mean BMI was 28.9 kg/m2
(SD = 4.5), and the mean waist circumference was 99.2 cm (SD = 16.2). With regard to duration of T2DM, 34.5% had had T2DM for 6 years; 43% between 6 and 14 years, and 22.5% 15 years. As expected, the mean HbA1c was higher for patients with diabetes complications. HbA1c was also higher for patients with a higher BMI and was generally higher in patients who had been diabetic for longer.
Treatment patterns
Almost all (93.9%) study participants were receiving some form of pharmacological treatment for their diabetes
(Table 3). On average, patients had been receiving treatment for 8.2 years (SD = 7.5). The most common treatments were oral monotherapy (35.7%) and therapy with more than one OAM (34.7%). With regard to the type of treatment, 43.8% of the patients who received oral monotherapy used metformin and 40% used sulfonylureas. Of those receiv-ing oral combination therapy, 60.8% took a combination of metformin and sulfonylureas. A total of 23.5% of the
Table 2 Description of sociodemographic characteristics of T2DM patients included in this study
Sex (n, %)
Male 147 (50%)
Female 147 (50%)
Age (years)
Mean (SD) 67.5 (10.2)
Range 24–91
65 years old 123 (41.8%)
65 years old 171 (58.2%)
Level of education (n, %)
Below primary studies 99 (33.9%)
Completion of primary studies 136 (46.6%) Completion of secondary studies 39 (13.4%) At least completion of university studies 18 (6.1%) Ethnicity (n, %)
European 280 (95.2%)
Other 14 (4.8%)
Smoking habit (n, %) 35 (11.9%)
Alcohol consumption (n, %) 59 (20.6%) Family history of diabetes 136 (46.4%) Time since T2DM diagnosis (years)
Mean (SD) 9.9 (8.7)
Abbreviations: SD, standard deviation; T2DM, type 2 diabetes mellitus.
Table 3 Clinical characteristics of T2DM patients and mean HbA1c per group
Clinical characteristic n, % Mean (SD) HbA1c
P value*
Level of glycemic control
HbA1c6.5 123 (41.8%) HbA1c6.5 and 7 62 (21.1%) HbA1c7 and 8 64 (21.8%)
HbA1c8 45 (15.3%)
Diabetes complications
No complications 150 (52.6%) 6.69 (1.48) (P 0.001) Microvascular complications 60 (21.1%) 6.92 (1.17)
Macrovascular complications 33 (11.6%) 6.61 (1.21) Microvascular and
macrovas-cular complications
42 (14.7%) 7.68 (1.75)
BMI
Mean (SD) 28.9 (4.5) Normal or underweight (BMI 25)
45 (16.1%) 6.58 (1.51) (P 0.05)
Overweight (25
BMI 30)
128 (45.9%) 6.65 (1.30)
Obese (30 BMI 35) 75 (26.9%) 7.16 (1.67) Severely obese (BMI 35) 31 (11.1%) 7.45 (1.34) Duration of T2DM
Mean (SD) 9.9 years (8.7)
2 years 48 (16.4%) 6.28 (1.38) (P 0.001) 3–5 years 53 (18.1%) 6.70 (1.48)
6–9 years 81 (27.6%) 6.88 (1.46) 10–14 years 45 (15.4%) 7.40 (1.83)
15 years 66 (22.5%) 7.08 (1.09) Treatment
No pharmacological treat-ment
18 (6.1%) 6.04 (0.69) (P 0.05)
Oral monotherapy 105 (35.7%) 6.52 (1.10) Oral combination therapy 102 (34.7%) 7.05 (1.65) Insulin monotherapy 24 (8.2%) 7.19 (1.31) Insulin combination therapy 8 (2.7%) 8.00 (1.27)
Insulin and oral treatment 37 (12.6%) 7.72 (1.97)
Notes: *p values indicate level of signifi cance in differences of HbA1c values among categories in ANOVA test.
study participants were on insulin therapy: 8.2% of the total sample used only one insulin, 2.7% used a combination of more than one type of insulin, and 12.6% of patients were treated with a combination of insulin and OAM(s). The most commonly prescribed type of insulin among these patients was intermediate-acting (49.3%), followed by the combina-tion of intermediate-acting and fast-acting (30.4%) insulins. The least prescribed type of insulin was fast-acting insulin alone (14.5%). The mean number of insulin units per week was 262.37 (SD = 124. 17), or about 37 insulin units daily. The mean HbA1c generally increased in patients on more intensive therapy, which is likely due to the longer duration of disease for patients taking insulin. The mean HbA1c was lowest in patients on no pharmacological treatment (mean
= 6.04, SD = 0.69) and highest in patients taking more than one type of insulin therapy (mean = 8.00, SD = 1.27).
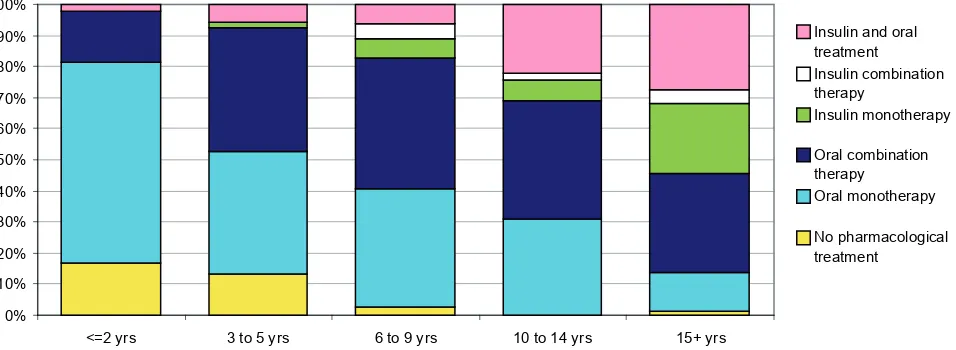
Analysis of treatment patterns according to time since diagnosis showed that oral monotherapy was the most com-mon treatment in patients with 2 years since diagnosis (Figure 1). For all other patients (ie, patients with more than 2 years since diagnosis), the most common treatment was an oral combination therapy. Nevertheless, insulin treatment became more frequent the longer the duration of diabetes. In patients with a time since diagnosis over 15 years, 55% were treated with insulin, either alone or in combination with an OAM(s).
A total of 66% of patients used test strips to monitor their blood glucose levels (Table 4). There were statistically sig-nifi cant differences among groups regarding test-strips usage according to their T2DM treatment type (p 0.05). Among patients treated with insulin, 90% used test strips, whereas
among patients with no treatment or who were only taking oral treatment, the corresponding percentages were 33.3% and 59.4%, respectively. The number of test strips used per week was higher in patients taking insulin (ranging from 6.3 to 7.7) than in those with no treatment or only oral treatment (5.2 and 4.4, respectively). The number of strips used was numerically higher in the group who were not receiving pharmacological treatment compared with the group on oral therapy but the difference was not statistically signifi cant.
Table 5 reports patient compliance by treatment type. Using the self-administered Morisky-Green questionnaire, 50 % of patients taking a pharmacological treatment reported high compliance with treatment. The highest proportion of patients reporting good compliance (67%) was found in the group treated with insulin monotherapy, and the low-est proportion (39%) was in patients treated with insulin in combination with OAM(s). Treatment type and HbA1c level were the only signifi cant factors related to compliance in the multivariate logistic regression analysis that examined factors related to levels of compliance after controlling for socio-demographic variables and complications. More spe-cifi cally, the results showed that the probability of having a high level of compliance is signifi cantly higher in patients receiving only insulin (OR: 2.7) than in patients on OAM(s). Moreover, the likelihood of better compliance increases with lower HbA1c values (OR of 1.3 for improved compliance given a one percentage point reduction in HbA1c values).
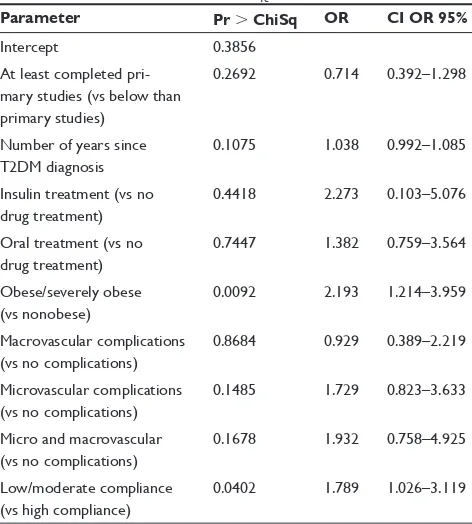
Table 6 shows the outcomes of the logistic regression to examine factors associated with poor glycemic control. Level of education, T2DM duration, treatment type, and presence and type of complications were not individually signifi cant.
0% 10% 20% 30% 40% 50% 60% 70% 80% 90% 100%
<=2 yrs 3 to 5 yrs 6 to 9 yrs 10 to 14 yrs 15+ yrs
Insulin and oral treatment Insulin combination therapy
Insulin monotherapy
Oral combination therapy
Oral monotherapy
No pharmacological treatment
Figure 1 Distribution of current treatment patterns of T2DM patients according to number of years since T2DM diagnosis.
The only signifi cant variables (p 0.05) were obesity and treatment compliance (ORs of 2.193 and 1.789, respectively, for patients with a BMI greater than 30 and for patients with low to moderate compliance).
Discussion
This study provides a general overview of the management of T2DM in Spain from both a physician and a patient per-spective. Physicians who took part in the study were selected so as to provide a representative sample based on popula-tion distribupopula-tion in Spain. Typical of studies in T2DM, the population included in the study had a high mean age. The population was equally distributed in terms of sex. A rela-tively low percentage of patients in this study had completed secondary or university studies (about 20%); however, educa-tion level did not explain glycemic control in the multivariate analysis. With regard to lifestyle, the percentage of smokers and drinkers is similar to that of other studies (Benito et al 2004; Arroyo et al 2005), but less than that reported for the Spanish population as a whole (Clemente et al 1999). This low percentage could be explained by the fact that it relied on patient self-reports. Over 80% of patients had a BMI of
25 kg/m2, which is similar to other studies indicating that up
to 90% of the T2DM population is overweight (Tremble and
Donaldson 1999). The percentage of patients with a family history of T2DM and the mean duration of the disease (about 10 years) were also comparable to fi gures in other Spanish studies (González-Clemente 1997; Zorrilla Torras et al 1997; Clua Espuny et al 1999; Arroyo et al 2005).
The ADA (ADA 2006) recommends that HbA1c in dia-betes patients should be under 7% as these levels of HbA1c are associated with a lower risk of long-term microvascular complications. Nevertheless, a 7% threshold does not com-pletely rule out the risk of complications and other medical societies have proposed a lower level of 6.5% (BCS et al 2005; IDF 2005). Of the patients in this study, 42% had an HbA1c less than or equal to 6.5%, and 63% had an HbA1c of less than or equal to 7%. These values are similar to those from other studies carried out in Spain: Mata Cases and colleagues (2003) reported 62% of patients with an HbA1c
7.5% and Sender Palacios and colleagues (2002) reported a similar percentage (66%). Different estimates of the pro-portion of individuals with good glycemic control have been obtained in other settings. For example, in a study carried out in the United States, Spann and colleagues (2006) reported that only 40% of patients had an HbA1c level less than or equal to 7%. These data were similar to those observed in the Third National Health and Nutrition Examination Survey
Table 4 Proportion of use of test strips and test strip usage per week of type of pharmacological treatment
No treatment Oral treatment Insulin Insulin and oral treatment Total Use of test strips n (%)
Yes 6 (33.3%)A,B,C 123 (59.4%)A,B,C 31 (96.9%)B 34 (91.9%)C 194 (66%)
No 12 (66.7%) 84 (40.6%) 1 (3.1%) 3 (8.1%) 100 (34%)
Test strips per week
Mean (SD) 5.2 (2.9) 4.4 (3.8) 7.7 (6.4) 6.3 (5.8) 5.3 (4.8)
Range 1–7 1–18 1–21 1–21 1–21
Notes: In each row, statistically signifi cant differences (p 0.05) were obtained between values with the same letter ( A, B, or C). A compares “oral treatment” with “no treatment”; B compares “no treatment” with “oral treatment” and with “insulin treatment,”; and C compares “no treatment” with “oral treatment” and with “insulin and oral treatment.”
Table 5 Percentage of patients with reporting various levels of treatment compliance by type of pharmacological treatment
Compliance (%) No pharmacolog-ical treatment
All treatments Oral treatment Insulin treat-ment Oral monotherapy Oral treatment
combination
Insulin monotherapy
Insulin combination
Insulin and oral treatment
High compliance n.a. 50 49 50 67 57 39
Moderate compliance n.a. 41 41 42 29 29 47
Low compliance n.a. 9 10 8 4 14 14
(Harris 2000), which was conducted between 1991 and 1994 and which reported 42.3% of patients with an HbA1c under 7%. A recent retrospective study (Grant et al 2005) of gen-eral practice and endocrine specialists in the United States demonstrated even poorer levels of control, with only 34% of patients achieving glycemic control targets. Although this may indicate that glycemic control is better in Spain, it may also be due to different methodological characteristics. For example, in our study, only patients treated by general prac-titioners were included. By not including patients treated by diabetes specialists we may have biased our sample towards patients with better glycemic control.
Regardless of the comparisons, the HbA1c values are clearly suboptimal. One possible reason for this is that patients are noncompliant with their prescribed treatment regimen. Another possibility is that in real clinical prac-tice, physicians prescribe insuffi cient hypoglycemic drugs. Although we found that patients receiving more than one hypoglycemic drug and/or insulin had worse glucose control than patients on none or only one oral hypoglycemic drug, this is probably because the most severe patients are usually treated with a greater number of drugs. In similar studies of
primary care patients, a signifi cant correlation was found to exist between levels of HbA1c and diabetes duration (Fernán-dez Herraez et al 1999). This illustrates how diffi cult it is for physicians and patients to manage T2DM and to achieve control objectives when the disease progresses and multiple medications are subsequently needed (UKPDS 1998).
It is worth noting that, despite a mean duration with the disease of almost 10 years and, therefore, progressive beta-cell failure, only 34.7% of patients were receiving oral combination therapy and 23.5% received insulin alone or in combination. The relatively low use of drug combinations or insulin in clinical practice is surprising given the well-known fi ndings of landmark studies, which have demonstrated that a greater use of these therapies lead to better HbA1c control. For example, the United Kingdom Prospective Diabetes Study (UKPDS) showed that only 24% of patients treated with sulfonylureas in monotherapy and 13% of those treated with metformin maintained levels of HbA1c lower than 7% after 9 years of treatment. In more than 50% of the cases, combined therapy was needed to achieve better HbA1c control (Turner et al 1999). Nevertheless, the prescription of hypoglycemic drugs in actual clinical practice appears to be suboptimal (Mata Cases et al 2003; Spann et al 2006).
Although some oral hypoglycemic drugs can produce hypoglycemia, it is a more frequent problem in patients treated with insulin. Therefore, blood glucose monitoring is suggested to help optimize dosing and to avoid hypoglycemia. Consis-tent with these guidelines, the results of this study suggest that patients taking insulin regularly test their blood glucose levels. The generally accepted diabetes guidelines in Spain do not recommend self-monitoring in patients who are treated with diet only (García Soidán et al 2005). The same is true of the ADA guidelines, which also do not establish an optimum frequency or regularity of self-monitoring in patients treated with OAMs (ADA 2006). Our study showed a high use of test strips in patients treated only with diet or OAMs. Other studies conducted in Spain also show test strip usage which are above the recommended levels (Olveira et al 1998; Clua Espuny et al 1999). The high use of test strips produces signifi cant costs to the Spanish health system yet there is still some debate as to whether these higher monitoring costs lead to improved outcomes (Oliva et al 2004; Guerci et al 2003; Franciosi et al 2005; Martín et al 2006). Some critics even suggest that such monitoring could worsen a patient’s metabolic control and cause greater psychological problems (Oliva et al 2004). Given the controversy regarding the effectiveness of SMBG in patients treated with diet or with an OAM, it is surprising that patients on these treatments make such frequent use of test strips.
Table 6 Logistic regression of HbA1c control
Parameter Pr ChiSq OR CI OR 95%
Intercept 0.3856
At least completed pri-mary studies (vs below than primary studies)
0.2692 0.714 0.392–1.298
Number of years since T2DM diagnosis
0.1075 1.038 0.992–1.085
Insulin treatment (vs no drug treatment)
0.4418 2.273 0.103–5.076
Oral treatment (vs no drug treatment)
0.7447 1.382 0.759–3.564
Obese/severely obese (vs nonobese)
0.0092 2.193 1.214–3.959
Macrovascular complications (vs no complications)
0.8684 0.929 0.389–2.219
Microvascular complications (vs no complications)
0.1485 1.729 0.823–3.633
Micro and macrovascular (vs no complications)
0.1678 1.932 0.758–4.925
Low/moderate compliance (vs high compliance)
0.0402 1.789 1.026–3.119
Notes: Dependent variable HbA1c scored as 0 for values 6.5% and 1 for values
6.5%.
According to the results of this study, fewer than 50% of patients on pharmacological treatment reported high compli-ance. The proportion of good compliers was higher in patients treated in insulin than in those treated with OAMs and much lower in those treated with a combination of insulin and OAMs. Although it might be expected that compliance would be lower for injectable treatments, our results suggest that compliance is related more to the severity of diabetes than to the type of drug administration. Insulin treatment may also have a psychologi-cal effect on the patient in the sense that initiating treatment with insulin forces the patient to think seriously about the dis-ease and possibly makes the patient more conscientious about taking his or her medication. Our results are consistent with a systematic review of compliance to diabetes treatment, which concluded that many diabetic patients complied poorly with treatment that included both OAMs and insulin and indicated that, as with other chronic diseases, treatment compliance was not related to the complexity of the treatment regimen, the severity of the disease, or the possible consequences of the forgotten doses (Cramer 2004).
Some of the most interesting contributions of the cur-rent study may be the conclusions derived from the logistic regression analysis conducted to determine the factors associ-ated with glycemic control. The results show that treatment compliance and BMI are the best predictors for not achieving optimal glycemic control. In our model, patient education level, treatment type, disease progression, and the presence and type of complications were not signifi cantly associated with poor HbA1c control. While other studies have also examined predictors of glycemic control, our study includes an important variable that is often missing in these types of analyses, namely, compliance (Sender Palacios et al 2002; Díaz Grávalos et al 2006; Spann et al 2006). The fact that the two most important variables – BMI and compliance – are largely dependent on the patient’s behavior, demonstrates the importance of the patient’s role in achieving target clinical outcomes. Clinicians should continue to help their patients to understand the importance of weight management and treatment compliance and how they are associated with clinical outcomes, such as HbA1c control.
This study provides a comprehensive examination of actual clinical practice for patients with type 2 diabetes in Spain; however, the study had several limitations. First, the recruitment of patients from among those consulting their physician within a three-month period infl uenced selection. Although all patients with diabetes, including those with dif-ferent treatment patterns and at difdif-ferent stages of the disease, should consult their physicians, the three-month enrolment period could have led to the recruitment of patients who
consult more regularly with their physicians. The direction of this bias is unknown as patients in good health may be in good health because they see their physicians more often and our sample would therefore tend to include patients with better outcomes. On the other hand, patients with poor health may visit their physicians more often and in that case our sample would be biased towards patients with a poorer health status. Another source of potential bias for this study was recruiting only patients who were treated by a general practitioner. As more patients with poor glycemic control are likely treated by diabetes specialists, the results from our study are not likely to be representative of the overall management and outcomes of patients with type 2 diabetes in Spain. Finally, an indirect method which relies on patient self-report (ie, the Morisky-Green questionnaire) was used to measure treatment compliance. This might be expected to produce infl ated compliance scores; however, the propor-tion of patients reporting good compliance in our study was actually lower than that found in other recent studies on compliance (Grant et al 2003; Mino-Leon et al 2005).
Disclosure
Funding for this study was provided by Eli Lilly and Company.
References
[ADA] American Diabetes Association. 2005. Diagnosis and classifi cation of diabetes mellitus. Diabetes Care, 28:S37–S42.
[ADA] American Diabetes Association. 2006 Standards of medical care in diabetes. Diabetes Care, 29(Suppl 1):S4–42.
Arroyo J, Badía X, de la Calle H, et al. 2005. Tratamiento de los pacien-tes con disbepacien-tes mellitus tipo 2 en españa. Medicina Clínica (Barc), 125:166–72.
Bayo J, Latorre PM, García F, et al. 1996. Factores de riesgo asociados a la prevalencia de diabetes mellitus no insulinodependiente en Lejona (Vizaya). Medicina Clínica (Barc), 107:572–7.
Benach J, Yasui Y, Borrell C, et al. 2001. Material deprivation and leading causes of death by gender: evidence from a nationwide small area study. J Epidemiol Community Health, 55:239–45.
Benito LP, Garcia MR, Puig DM, et al. 2004. Pathological characteristics of patients with diabetes mellitus type 2 in Spanish primary care. Revista Clínica Española, 204:18–24.
[BCS] British Cardiac Society, British Hypertension Society, Diabe-tes UK, et al. 2005. JBS2: Joint British Societies’ guidelines on prevention of cardiovascular disease in clinical practice. Heart, 91(Suppl. 5):1–52.
Clemente ML, Alonso JA, Córdoba R, et al. 1999. Descripción de las guías disponibles en España para el abordaje del tabaquismo en Atención Primaria. Atención Primaria, 24:101–8.
Clua Espuny JL, Puig Junoy J, Ciuranan Roca E, et al. 1999. Self-monitoring of blood glucose: evaluation of its prescription and results in type-2 diabetes. Atención Primaria, 24:316–25.
Cramer JA. 2004. A systematic review of adherence with medications for diabetes. Diabetes Care, 27:1218–24.
Díaz Grávalos GK, Palmeiro Fernández G, Casado Górriz I, et al. 2006. Cumplimiento de los objetivos de control metabólico en diabetes mellitus en el medio rural de Ourense. Revista Española de Salud Pública, 80:67–75.
Farmer A, Wade A, Goyder E, et al. 2007. Impact of self monitoring of blood glucose in the management of patients with non-insulin treated diabetes: open parallel group randomised trial. BMJ, 335:132. Fernández Herraez E, Ferré Larrosa F, Jiménez Alfonso L, et al. 1999.
Valoración de los factores relacionados con el control de la glucemia en la diabetes mellitus tipo 2. Atención Primaria, 24:39–43. Franciosi M, Pellegrini F, De Berardis G, et al. 2005. Self-monitoring of blood
glucose in non-insulin treated diabetic patients: a longitudinal evaluation of its impact on metabolic control. Diabetic Med, 22:900–6.
Gallichan M. 1997. Self monitoring of glucose by people with diabetes: evidence based practice. BMJ, 314:964–7.
García Soidán FJ, Novo Rodríguez JM, Vázquez Troitiño F, et al. 2005. Dia-betes Mellitus tipo 2 [online]. Guías Clínicas, 5(15). Accessed on March 3, 2007. URL: http://www.fi sterra.com/guias2/diabetes_mellitus.asp. González-Clemente JM. 1997. Non-insulin dependent diabetes mellitus: care
in an area of Barcelona. Medicina Clínica (Barc), 108:91–7. Grant RW, Buse JB, Meigs JB. 2005. Quality of diabetes care in US
aca-demic medical centers: low rates of medical regimen change. Diabetes Care, 28:337–442.
Grant RW, Devita NG, Singer DE, et al. 2003. Polypharmacy and medi-cation adherence in patients with type 2 diabetes. Diabetes Care, 26:1408–12.
Guerci B, Drouin P, Grange V, et al. 2003. Self-monitoring of blood glu-cose signifi cantly improves metabolic control in patients with type 2 diabetes mellitus: the Auto-Surveillance Intervention Active Study. Diabet Metabol, 29:587–94.
Harris MI. 2000. Health care and health status and outcomes for patients with type 2 diabetes. Diabetes Care, 23:754–8.
[IDF] International Diabetes Federation. 2005. Global guideline for type 2 diabetes [online]. Accessed March 3, 2007. URL: http://www.idf. org/webdata/docs/IDF%20GGT2D.pdf.
[INE] Instituto Nacional de Estadistica [National Institute of Statistics]. 2006. Population referring to January 1, 2005 by autonomous com-munities and sex. Demographics and Population. INEbase [online]. Madrid: National Institute of Statistics. Accessed on December 14, 2006. URL: http://www.ine.es.
King H, Aubert RE, Herman WH. 1998. Global burden of diabetes 1995–2025: prevalence, numerical estimates, and projections. Diabetes Care, 21:1414–31.
Laing W, Williams R. 1996. Diabetes, a model for health care management, Offi ce of Health Economics, London, 1989 (Paper 92). Cited by: Marks L. Counting the cost: the real impact of non-insulin-dependent diabetes. A King’s Fund report commissioned by the British Diabetic Association. Martín S, Schneider B, Heinemann L, et al. 2006. Self-monitoring of blood
glucose in type 2 diabetes and long-term outcome: an epidemiological cohort study. Diabetologia, 49:271–8.
Mata Cases M, Roset Gamisans M, Badia Llach X, et al. 2003. Impacto de la disbetes mellitus tipo 2 en la calidad de vida de los pacientes tratados en las consultas de atención primaria en España. Atención Primaria, 31:493–9.
Mino-Leon D, Figueras A, Amato D, et al. 2005. Treatment of type 2 diabetes in primary health care: a drug utilization study. Ann Phar-macother, 39:441–5.
Morisky DE, Green LW, Levine DM. 1986. Concurrent and predictive validity of a self-reported measure of medication adherence. Med Care, 24:67–74.
Oliva J, Lobo F, Molina B, et al. 2004. Direct health care costs of diabetic patients in Spain. Diabetes Care, 27:2616–21.
Olveira G, Soriguer F, Ortega C, et al. 1998. Use of reagent materials for self-monitoring in the metropolitan area of Malaga (1994–1996). Atención Primaria, 21:75–80.
Roglic G, Unwin N, Bennett PH, et al. 2005. The burden of mortality attributable to diabetes: realistic estimates for the year 2000. Diabetes Care, 28:2130–35.
Sender Palacios MJ, Vernet Vernet M, Larrosa Sáez P, et al. 2002. Carac-terísticas sociodemográfi cas y clínicas de una población de pacientes con diabetes mellitus. Atención Primaria, 29:474–80.
Spann SJ, Nutting PA, Galliher JM, et al. 2006. Management of type 2 diabetes in the primary care setting: a practice-based research network study. Ann Fam Med, 4:23–31.
Tamayo-Marco B, Faure-Nogueras E, Roche-Asensio MJ, et al. 1997. Prevalence of diabetes and impaired glucose tolerance in Aragon, Spain. Diabetes Care, 20:534–6.
Tremble JM, Donaldson D. 1999. Is continued weight gain inevitable in type 2 diabetes mellitus? J Royal Soc Health, 119:235–9.
Turner R, Cull C, Frighi V, et al. 1999. Glycemic control with diet, sulfonylurea, metformin, or insulin in patients with type 2 diabetes mellitus: progressive requirement for multiple therapies (UKPDS 49). JAMA, 281:2005–12.
[UKPDS] UK Prospective Diabetes Study Group. 1998. Intensive blood-glucose control with sulphonylureas or insulin compared with con-ventional treatment and risk of complications in patients with type 2 diabetes (UKPDS 33). Lancet, 352:837–53.
[WHO] World Health Organization. 2007. Prevalence of diabetes in the WHO European region [online]. Accessed March 3, 2007. URL: http:// www.who.int/diabetes/facts/world_fi gures/en/print.html.
World Health Organization Regional Offi ce for Europe. 2007. European mortality database. Accessed March 3, 2007. URL: http://data.euro. who.int/hfamdb/.
Zimmet P, Alberti KG, Shaw J. 2001. Global and societal implications of the diabetes epidemic. Nature, 414:782–7.