United Kingdom ISSN 2348 0386 Vol. VIII, Issue 2, February 2020
Licensed under Creative Common Page 166
http://ijecm.co.uk/
INFLUENCE OF ADVERTISING VALUE ON ATTITUDE IN
INCREASING REPURCHASE INTENTION
I Gusti Agung Putu Gita Purnama Mandasari
Master of Management Study Program, Faculty of Economics and Business, Udayana University, Indonesia
gita.limax@gmail.com
Ni Wayan Sri Suprapti
Master of Management Study Program, Faculty of Economics and Business, Udayana University, Indonesia
Abstract
International Data Corporation (IDC) (2019) reported smartphone brands that dominated the
Indonesian market in the period of 2014 to 2018. The data showed that the largest market share
within five years consecutively led by Samsung smartphones. Samsung smartphones’ sales
decreased by 4.8 percent in 2018. In order to possibly tackle this condition, Samsung has been
conducting business efforts by increasing its customers repurchase intention, and minimizing its
customers desire to move to another brand, and one of the engagements is by advertising
through the Instagram application. This research aims are to analyse the influence of
advertising value on advertising attitude, the influence of advertising attitude on brand attitude,
influence advertising attitude on repurchase intention, and the influence of brand attitude on
repurchase intention. Results of the research show that advertising value has a significant
positive influence on advertising attitude, advertising attitude has a significant positive influence
on brand attitude, advertising attitude has significant positive influence on repurchase intention,
and brand attitude have a significant positive influence on repurchase intention.
Licensed under Creative Common Page 167 INTRODUCTION
International Data Corporation (IDC) (2019) reports smartphone brands that dominate the Indonesian market in the period 2014 to 2018. The data shows the largest market share in five years consecutively held by the Samsung smartphones. The highest market share grew up to 6.1 percent in 2016. In 2018, Samsung sales decreases by 4.8 percent. In line with Cellular ID on March 5, 2019, the causes of Samsung's sales drops down in 2018 is due to the aggressiveness of Chinese vendors entering the Indonesian market with a variety of products and leading technology but at a more affordable price, and another reason is that Samsung has not been aggressively marketing or selling their products yet by online.
Numerous attempts have been made by Samsung to maintain its market share in order that its existing customers do not switch to other brands. One of them is by doing ads via the Instagram application. One of the biggest active users of Instagram is Indonesians with third rank position among 55 million users (Katadata, 2018). In Indonesia, social media is the second rank application for the most frequently accessed applications after chatting, that is 87.13 percent (APJII, 2017). Advertising by using mobile advertising has proven to be quite influenceive. This can be seen from the release of PWC (PriceWaterhouseCoopers), mobile advertising revenue in Indonesia has been estimated to have quadrupled from US $ 6 million in 2013 to US $ 24 million in 2018 (PWC, 2019).
Licensed under Creative Common Page 168 LITERATURE REVIEW
Advertising Value
Ducoffe (1996) stated that Advertising value is best understood as an overall representation of the worth of advertising to consumers. From this definition advertising value is understood as an overall presentation concerning valuable advertising for consumers. Ducoffe (1996) introduced the concept of value for advertising, which is called advertising value, and advertising value consists of three facets: informativeness, entertainment, and irritation (Ducoffe, 1995). Entertainment can be defined as the ability to fulfil an audience's needs for escapism, diversion, aesthetic or emotional pleasure (Ducoffe, 1996, McQuail, 1983). Informativeness means that advertising should inform consumers about product alternatives, thus ensuring that purchases have the highest possible satisfaction (Ducoffe, 1995a, 1996b). An advertisement is considered to be irritated when the advertiser connects with advertising system that irritates, affronts, or is excessively manipulative. Therefore consumers’ take that as undesirable and aggravated advertising (Ducoffe, 1995a, 1996b, Ha et al, 2014).
Advertising Attitude
Advertising attitude is a response or response both positive and negative towards an advertisement (Ducoffe, 1996, Hamouda, 2017, Murillo, 2017, and Murat et al., 2016). Torres (2015) define attitude toward social media advertising as a predisposition to respond favorably or unfavorably to advertising content on social media services. The indicators used to measure advertising attitude are cognitive, affective and conative components.
Brand Attitude
Chaudhuri (2001) stated that attitude towards a brand is interpreted as a comprehensive consumer evaluation of the brand and forms the basis used by consumers in their decisions and behaviour. A positive attitude towards consumers will enable consumers to make purchases of the brand, but otherwise a negative attitude will prevent consumers from make a purchase. The indicators used to measure advertising attitude are cognitive, affective and conative components.
Repurchase Intention
Licensed under Creative Common Page 169 becomes the main consideration, will definitely choose the same product, will not choose another product and will choose the same product in the next purchase.
Millennium Generation
Tapscott (1998) in Profil Generasi Milineal Indonesia (2018) mentions millennial generation with the term digital generation born between 1976-2000. Then Zemke et al. (2000) in Profil Generasi Milineal Indonesia (2018) refers to millennial generation with the term Nexters born in 1980-1999. Oblinger (2005) in Profil Generasi Milineal Indonesia (2018) refers to the millennial generation with the term Generation Y or NetGen, born between 1981-1995. Based on the opinions of some of these experts, the age of Indonesian millennial generation is Indonesian population born between 1980-2000 (Profil Generasi Milineal Indonesia, 2018: 33). Furthermore, the concept of Indonesian millennial generation used in this study is Indonesian population born between 1980-2000.
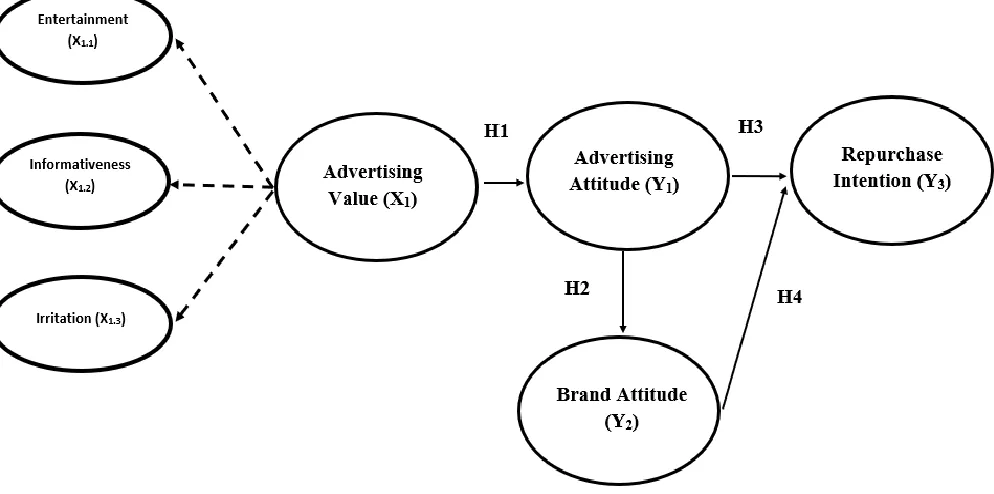
Figure 1. Conceptual Framework
Influence of Advertising Value on Advertising Attitude
Licensed under Creative Common Page 170 studies. Based on the research of Hashim et al. (2017) R2 value of the advertising value to advertising attitude is 0.70 and based on research conducted by Lee et al. (2017) the value of R2 0.412 which means that for the value of R2 0.70 that is 70 percent of the variable advertising attitude can be explained by the variable advertising value and 30 percent is influenced by other variables, and it occurs on the value of R2 0,412 as well. Based on the GAP, the hypothesis is formulated as follows:
H1: Advertising value has a positive and significant influence on advertising attitude.
Influence of Advertising Attitude on Brand Attitude
Advertising attitude has also been debated simultaneously on affecting brand attitude and purchase intention directly in research (MacKenzie et al., 1986). The positive influence of advertising attitude on brand attitude is supported by the theory of attitude formation by Edell.et.al (1987) in (Schiffman and Kanuk, 2018: 231), which means that better attitude of consumers towards advertising will have a positive influence on the attitudes towards brands. So the hypothesis is formulated as follows:
H2: Advertising attitude has a positive and significant influence on brand attitude.
Influence of Advertising Attitude on Repurchase Intention
Advertising attitude has been proven to have a positive influence on purchase intention based on research (Xu et al., 2009, Lee et al., 2017, Hashim et al., 2018, Noor et al., 2013, Wahid and Ahmed, 2011). There is no research that says there is a positive influence between advertising attitude on repurchase intention. Purchase intention and repurchase intention are intentions to make a purchase, the difference is on whether the purchase has occurred or has never happened. So the hypothesis is formulated as follows:
H3: Advertising attitude has a positive and significant influence on repurchase intention.
Influence of Brand Attitude on Repurchase Intention
Brand Attitude has a positive influence on purchase intention based on research results (Dodds et al., 1991, Shah et al., 2012, Abzari et al., 2014, Lee et al., 2017). Peyrot and Doren (1994) stated that there is a positive relationship between attitudes towards brands to consumer’s repurchase intention. This happens when consumers feel satisfied with the product or service received from a company providing the goods or services, it is very likely for consumers to make a repurchase. So the hypothesis is formulated as follows:
Licensed under Creative Common Page 171 RESEARCH METHODS
The approach in this research was confirmatory research by collecting data which was carried out simultaneously in one phase (one short study) or by cross-section. The primary data was collected through questionnaires distributed via Google Docs with 5 Likert scales. This type of research according to its level of explanation was associative research because it investigated the influence of advertising value on advertising attitude, advertising attitude on brand attitude, advertising attitude on repurchase intention, and brand attitude on repurchase intention especially on millennial generation for Samsung smartphone products that its advertisements using Instagram. This research was conducted in Denpasar City and Badung Regency. The sampling technique used in this study is purposive sampling with 263 samples. This research used Structural Equation Modeling (SEM) with Partial Least Square (PLS) approach and using smart PLS 3.0 software.
ANALYSIS AND RESULTS
Instrument Testing
The research instruments (questionnaire) was assured its feasibility and persistency through the validity and reliability tests of its first 30 respondents. An instrument is said to be valid if it has a correlation coefficient between the items with a total score in the instrument greater than 0.30. Cronbach's alpha value is reliable if its value is greater than or equal to 0.60.
Inferential Analysis
Testing the outer model
1) Convergent Validity Test
Convergent validity with reflexive indicator can be seen from the correlation between the indicator scores and its variable scores. Individual indicators are considered reliable if they have a correlation value higher than 0.50. The convergent validity test results show that all outer loading indicators of variables have values greater than 0.50. Thus, it can be concluded that all indicators have met the requirements of convergent validity.
2) Discriminant validity test
Licensed under Creative Common Page 172 Table 1. Discriminant Validity Result
Advertising value
(X1)
Advertising attitude
(Y1)
Brand attitude
(Y2)
Repurchase
intention (Y3)
AVE 0,870 0,647 0,711 0,716
3) Composite reliability test
Variables are declared reliable if the composite reliability and Cronbach's alpha values are higher than 0.70. The results of composite output reliability and Cronbach's alpha variable advertising value, advertising attitude, brand attitude, and repurchase intention are all higher than 0.70. Thus, it can be explained that all variables have good reliability.
Table 2. Research Result on Reliability Instruments Variabel Composite
Reliability
Cronbachs
Alpha
Remarks
Advertising value (X1) 0,953 0,925 Reliable
Advertising attitude (Y1) 0,879 0,817 Reliable
Brand attitude (Y2) 0,908 0,864 Reliable
Repurchase intention (Y3) 0,910 0,867 Reliable
The inner model testing
The influence of advertising value on advertising attitude gives an R-square value of 0.793. Furthermore, the influence of advertising attitude on brand attitude gives an R-square value of 0.798. Then, the influence model of advertising attitude, and brand attitude on repurchase intention gives an R-square value of 0.809.
Table 3. Determination Coefficient Values
Variables) R-square R-square
Adjusted
Advertising Value (X1) Advertising
Attitude (Y1)
0,771 0,768
Advertising Attitude (Y1) Brand attitude
(Y2)
0,781 0,779
Advertising Attitude (Y1) ans Brand
attitude (Y2) Repurchase intention (Y3)
Licensed under Creative Common Page 173 To measure how well the observational values generated by the model and also the estimated parameters, it is necessary to calculate Q-square (Q2) as follows:
Q2 = 1- (1 - R12) (1 - R22) (1 - R32)
= 1- (1 - 0.771) (1 - 0.781) (1 - 0.804) = 1- (0,229) (0,219) (0,196)
= 1-0.0098 = 0.9902
Q2 value has a value with a range of 0 <Q2 <1, where the closer to 1 means the better is getting better. The calculation results obtained Q2 value of 0.9902, so it can be concluded that the model has a very good predictive relevance.
Hypothesis Testing
Table 4 Hypothesis Test
The Influence of Advertising Value (X1) on Advertising Attitude (Y1)
Hypothesis testing on the influence of advertising value on advertising attitude produces a correlation coefficient of 0.878. The value of t Statistics is 22,470 (> t-critical 1.96), so the influence of Advertising value on advertising attitude is significant. Thus, the first hypothesis (H1) which states that advertising value has a positive and significant influence on advertising attitude is acceptable. The results of this study are supported by researches (Murillo, 2016a, 2017b, Hamouda, 2018, Aktan, 2016, and Lee et al., 2017).
The Influence of Advertising Attitude (Y1) on Brand Attitude (Y2)
Hypothesis testing on the influence of advertising attitude on brand attitude produces a correlation coefficient of 0.884. The value of t Statistics is 23,532 (> t-critical 1.96), so the
Coefficient Paths Among Variables Coefficient
Path
t Statistics
Remarks
Advertising value (X1) → Advertising
attitude (Y1)
0,878 22,470 Significant
Advertising attitude (Y1) → Brand attitude
(Y2)
0,884 23,532 Significant
Advertising attitude (Y1) → Repurchase
intention (Y3)
0,267 2,138 Significant
Brand attitude (Y2) → Repurchase
intention (Y3)
Licensed under Creative Common Page 174 influence of advertising attitude on brand attitude is significant. Thus, the second hypothesis (H2) which states that advertising attitude has a positive and significant influence on brand attitude is acceptable. The results of this study indicate that the indicators forming advertising attitude can significantly influence consumer attitudes towards the Samsung brand. The results of this study are supported by research (Lee et al., 2017) and also supported by the theory of attitude formation by (Edell.et.al, 1987) in (Schiffman and Kanuk, 2018: 231).
The Influence of Advertising Attitude (Y1) on Repurchase Intention (Y3)
Hypothesis testing on the influence of advertising attitude on repurchase intention produces a correlation coefficient of 0.267. The value of t Statistics is 2.138 (> t-critical 1.96), so the influence of advertising value on repurchase intention is significant. Thus, the third hypothesis (H3) which states that advertising attitude has a positive and significant influence on repurchase intention is acceptable. There are no studies that examine the influence of advertising attitude on repurchase intention, but the influence of advertising attitude on purchase intention has been widely studied and produces positive and significant influences in accordance with research Xu et al., (2009), Lee et al., (2017), Hashim et al., (2018), Noor et al., (2013), Wahid and Ahmed, (2011). Purchase intention and repurchase intention are an intention to make a purchase, the difference is whether or not the purchase has occurred.
The Influence of Brand Attitude (Y2) on Repurchase Intention (Y3)
Hypothesis testing on the influence of brand attitude on repurchase intention produces a correlation coefficient of 0.675. The value of t Statistics is 9,326 (> t-critical 1.96), then the
influence of brand attitude on repurchase intention is significant. Thus, the fourth hypothesis (H4) which states that brand attitude has a positive and significant influence on Repurchase intention is acceptable. The results of this study are supported by research by Peyrot and Doren (1994) which states that there is a positive relationship between attitudes towards brands to consumer repurchase intention.
CONCLUSION AND SUGGESTIONS
Licensed under Creative Common Page 175 Advertising attitude has a positive and significant intention on brand attitude. This means that the better the attitude towards Samsung smartphone advertisements advertised with the Instagram application, the better will be the attitude towards the Samsung brand.
Advertising attitude has a positive and significant intention on repurchase intention. This means that the better the attitude of consumers towards Samsung smartphone advertisements advertised with the Instagram application, the stronger the desire to repurchase Samsung smartphone products will be.
Brand attitude has a positive and significant intention on repurchase intention. This means that the more positive attitude towards Samsung smartphone brands, the desire to buy back on Samsung products will be stronger.
Based on the results of the research analysis and the results of the discussion in the previous chapter, the suggestions of this study are as follows:
- In an effort to maintain and increase the advertising value of Samsung smartphone products that are displayed through the Instagram application, Samsung must conduct periodic evaluations to reduce the irritation arising from advertisements that are displayed.
- In an effort to maintain and enhance a positive attitude towards Samsung smartphone product advertisements displayed on the Instagram application, Samsung must be able to convince its customers that the advertisements and information displayed through the Instagram application are in accordance with reality in the field.
- In an effort to maintain and improve brand attitude for the better, then Samsung should periodically have to improve its brand image by continuing to innovate and promote the attention of consumers so that consumers do not hesitate to make Samsung their first choice brand.
- In an effort to maintain and increase repurchase intention, Samsung should continuously improve product excellence and add features that customers want, so that customers remain loyal to choosing a Samsung brand smartphone when they want to change smartphones.
For further studies, it is recommended to expand samples of the researches, and it is not only limited to millennial generation. In addition, further research is also suggested to add other variables besides advertising value, advertising attitude, brand attitude and repurchase intention. For instance, by adding brand trust, country of origin, price and celebrity endorse variables.
REFERENCES
Licensed under Creative Common Page 176 Aktan, Murat, Sibel Aydogan, and Ceyda Aysuna. 2016. Web Advertising Value and Students’ Attitude Towards Web Advertising, European Journal of Business and Management, Vol 8,No 09.
Alwitt, L.F. dan Prabhakar, P.R. (1992) Functional and belief dimensions of attitudes to television advertising, Journal of Advertising Research, No.32, pp. 30-42.
APJII (Asosiasi Penyelenggara Jasa Internet Indonesia). 2017. Survey Penetrasi dan Perilaku Pengguna Internet Indonesia. (online). Diakses pada tanggal 28 Maret 2019 pada Pukul 20.30 WITA.( https://apjii.or.id/survei2017). Assael,Henry. 1995. Customer Behavior And Marketing Action, Keat Publishing Company, Boston.
Badan Pusat Statustik Kabupaten Badung.2019.Jumlah penduduk badung berdasarkan usia.(online). Diakses pada tanggal 05 November 2019 pada pukul 14.00 Wita. (https://badungkab.bps.go.id/).
Barczyk, C. Casimir dan Doris G. Duncan.2011.Social networking media as a tool for teaching business administration courses. International Journal of Humanities and Social Science, Vol. 1 No. 17, pp. 267-276.
Blight, G. Michael, Erin K. Ruppel, dan Kelsea V. Schoenbauer .2017. Sense of community on Twitter and instagram: exploring the roles of motives and parasocial relationships, Cyberpsychology.Behavior, and Social Networking, Vol. 20 No. 5, pp. 314-319.
Bolton, N. Ruth, A. Parasuraman, Ankie Hoefnagels, Nanne Migchels, Sertan Kabadayi, Thorsten Gruber, Yuliya Komarova Loureiro,dan David Solnet .2013. Understanding Generation Y and their use of socialmedia: a reviewand research agenda. Journal of Service Management, Vol. 24,No. 3, pp. 245-267.
Chaudhuri, Arjun dan Morris B. Holbrook .2001.The Chain of Influence from Brand Trust and Brand Influence to Brand Performance: The Role of Brand Loyalty. Journal of Market Focused Management.Vol 65, pp 81-93.
Cho,Hoan Chang dan Hongsik John Cheon .2004. Why do people avoid advertising on the internet? Journal of advertising, Vol.4, No. 33, pp 89-97.
Dao, William Van-Tien , Angelina Nhat Hanh Le, Julian Ming-Sung Cheng dan Der Chao Chen (2014), Social media advertising value. The case of transitional economies in Southeast Asia. International Journal of Advertising, Vol. 33 No. 2, pp. 271-294.
Dehghani, Milad dan Mustafa Tumer .2015. A research on influenceiveness of Facebook advertising on enhancing purchase intention of consumers. Computers in Human Behavior, No. 49, pp.587-600.
Dehghani, Milad, Mojtaba Khorram Niaki, Iman Ramezani, dan Rasoul Sali .2016. Evaluating the influence of YouTube advertising for attraction of young customers. Computers in Human Behavior, No. 59, pp. 165-172.
Dodds, B.William, Kent B.Monroe dan Dhruv Grewal.1991. Influences of Price, Brand, and Store Information on Buyers’ Product Evaluations. Journal of Marketing Research, Vol.3, No.3, pp.307-319.
Ducoffe, R. H. 1995. How consumers assess the value of advertising. journal of Current Issues and Research in Advertising, Vol. 17, No. 1, pp. 1-18.
Ducoffe, R. H. .1996.Advertising value and advertising on the web. Journal of Advertising research, Vol. 36. No. 5, pp. 21-3
Echdar,Saban.2017. Metode Penelitian Manajemen dan Bisnis.Penerbit:Ghalia Indonesia
Edwards, M. Steven, Hairong Li, dan Joo-Hyun Lee .2002. Forced exposure and psychological reactance: antecedents and consequences of the perceived intrusiveness of pop-up ads. Journal of Advertising, Vol 3,No.31, pp.83-95.
Ferdinand,Augusty. 2006. Metode Penelitian Manajemen: Pedoman Penelitian untuk skripsi, Tesis dan Disertai Ilmu Manajemen. Semarang: Universitas Diponegoro.
Fischer, Eileen and A. Rebecca Reuber .2011. Social interaction via new social media: (How) can interactions on Twitter affect influenceual thinking and behavior? Journal of Business Venturing, Vol 1, No 26, p 1-18.
Gangadharbatla, Harshaa dan Terry Daugherty.2013. Advertising Versus Product Placements: How Consumers Assess the Value of Each. Journal of Current Issues and Research in Advertising, Vol 1, No. 34, pp. 21-38.
Ghozali, Imam. 2011. Aplikasi Analisis Multivariate Dengan Program SPSS. Semarang: Badan Penerbit Universitas Diponegoro.
Licensed under Creative Common Page 177 Ha, Young Wook, Myeong-Cheol Park, dan Euehun Lee .2014. A framework for mobile sns advertising influenceiveness: User perceptions and behaviour perspective. Behaviour and Information Technology, Vol. 33, No. 12, pp. 1333-1346.
Haghirian, Parissa .2007. An advanced model of consumer attitudes toward advertising on the mobile internet. International Journal of Mobile Communications, Vol. 5, No. 1, pp. 48-67.
Hamouda, M. .2018. Article information : Understanding social media advertising influence on consumers’ responses: an empirical investigation of tourism advertising on Facebook. International Journal for Researcher Development,Vol 1, No.7,pp.63–83.
Hashim, Nor Hazlina, Normalini and Norhazlina Sajali .2018. The Influence Factors Towards Mobile Advertising Message Content on Consumer Purchase Intention. Global Business Review, Vol 5, No.19,pp. 1187–1206.
Heru Sulistiyo, 1999, Hubungan antara Kualitas dan Kepuasan Pelanggan Dalam Pembentukan Intensi Pembelian Pelanggan: Studi pada empat Industri Jasa di Semarang, Journal Bisnis Strategi, Vol.4.
Hicks, Marie Jessica.2005. Delighted Consumers Buy Again. Journal of Consumer Satisfaction,Dissatisfaction and Complaining Behavior, No.18, pp. 94-104.
IDNTIMES .2018. Gokil! Pemilih Millennial di Bali Mencapai 1,25 Juta Orang. (online), Diakses pada tanggal 30 April 2019 pada Pukul 23.00 WITA, (https://bali.idntimes.com/news/bali/imamrosidin/jumlah-pemilih-milenial-di-bali/full). IDC.2019. market share merek smartphone periode 2014-2018 di Indonesia. (online). Diakses pada tanggal 28 Maret 2019 pada Pukul 21.00 WITA (https://www.idc.com/) .
Jin, Hyun Seung., .2003. Compounding Consumer Intention: Influence of Advertising Campaign Publicity on the Ability to Recall Subsequent Advertisement, Journal of Advertising. Vol 32,No 4, pp.29-41.
Kata Data .2018. Berapa Pengguna Instagram dari Indonesia?.(online) Diakses pada tanggal 28 Maret 2019 pada Pukul 21.00 WITA
Kementerian Pemberdayaan Perempuan dan Perlindungan Anak. 2018. Statistik Gender Tematik: Profil Generasi Milenial Indonesia: Jakarta, Kementerian Pemberdayaan Perempuan dan Perlindungan Anak.
Ko, Hanjun , Chang-Hoan Cho dan Marilyn S. Roberts .2005. Internet uses and gratifications: A structural equation model interactive advertising. Journal of Advertising, Vol. 34, No. 2, pp. 57-70.
Kotler, P., Armstrong, G. (2001). “Prinsip-prinsip Pemasaran”, Jilid kesatu, Jakarta: Penerbit Erlangga
Lee, Wei-Na dan Sejung Marina Choi.2005. The Role of Horizontal and Vertical Individualism and Collectivism in Online Consumers' Responses Toward Persuasive Communication on the Web. Journal of Computer-Mediated Communication J Comp Mediated Comm, Vol 1, No.11, pp.317-336.
Lee,Bang Eui, Sang-Gun Lee dan Chang-Gyu Yang. 2017. The influences of advertisement attitude and brand attitude on purchase intention of smartphone advertising. Industrial Management and Data Systems, Vol. 117, No.6, pp.1011-1036.
Mackenzie, B. Scott, Richard J. Lutz, dan George E. Belch (1986), The role of attitude toward the ad as a mediator of
advertising influenceiveness: A test of competing explanations. Journal of Marketing Research, Vol. 23, No. 2, pp. 130-143.
Mackenzie, B. Scott dan Richard J. Lutz .1989. An empirical examination of the structural antecedents of attitude toward the ad in an advertising pretesting context. The Journal of Marketing, Vol. 53, No. 2, pp. 48-65.
Madahi, Abdolrazagh dan Inda Sukati. 2012. The Influence of External Factors on Purchase Intention amongst Young Generation in Malaysia. IBR International Business Research, Vol. 5, No. 8.
McQuail, Dennis. Mass Communication Theory: An Introduction. London: Sage, 1983.
Milenial.(online).Diakses pada tanggal 20 Mei 2019 pada Pukul 18.00 WITA (https://id.wikipedia.org/wiki/Milenial). Mooij,De Marieke dan Geert Hofstede .2010. The Hofstede model: applications to global branding and advertising strategy and research. International Journal of Advertising, Vol 1, No. 29, pp. 85-110.
Murillo, Enrique. 2016. The advertising value of Twitter Ads: a study among Mexican Millennials, Review of Business Management., Vol. 18, No. 61, pp.436-456.
Murrilo, Enrique .2017., Attitudes toward mobile search ads: a study among Mexican millennials , Journal of Research in Interactive Marketing, Vol. 11 No. 1 pp.91-108.
Licensed under Creative Common Page 178 Noor, Mohd Nazri Mohd, Jayashree Sreenivasan dan Hishamuddin Ismail.2013. Malaysian consumers attitude towards mobile advertising, the role of permission and its impact on purchase intention: A structural equation modeling approach. Asian Social Science, Vol 9,No. 5, pp 135–153.
Peyrot, mark and Doris Van Doren .1994. Influence of Class Action Suit on Consumer Repurchase Intention, The Journal of Consumer Affairs, Vol 28 No. 2, pp 361-79.
Phua, Joe dan Sun Joo Ahn .2014. Explicating the ‘like’ on Facebook brand pages: The influence of intensity of Facebook use, number of overall ‘likes’, and number of friends’ ‘likes’ on consumers’ brand outcomes. Journal of Marketing Communications, Vol V,No.22.pp.544–559.
Pratomo,Yudha.2019. 5 Besar Penguasa Pasar Smartphone Dunia di Kuartal Pertama, Kompas, 02 Mei 2019.(online). diakses 10 Agustus 2019 pukul 14.00.(https://tekno.kompas.com/read/2019/05/02/09180027/5-besar-penguasa-pasar-smartphone-dunia-di-kuartal-pertama-2019,.).
PWC, 2019. Indonesia— set for rapid spending growth powered by Internet-based segments. (online). Diakses pada tanggal 28 Maret 2019 pada Pukul 21.00 WITA.(https://www.pwc.com/gx/en/global-entertainment-media-outlook/hot-topics/assets/pwc-indonesia-summary.pdf).
Rahyuda.2017.Metode Penelitian Bisnis.Badan Penerbit Udayana University Press
Rayana,Uday.2019.Mengapa market Share Samsung terus Anjlok. SelularID,05 Maret 2019. (online).Diakses pada tanggal 20 September pukul 19.00 Wita (https://selular.id/2019/03/mengapa-market-share-samsung-terus-anjlok/). Saxena, Anant. and Uday Khanna .2013. Advertising on social network sites: a structural equation modelling approach. The Journal of Business Perspective, Vol. 17 No. 1, pp. 17-25.
Schiffman dan Kanuk. 2008. Perilaku konsumen. Edisi 7. Jakarta: Indeks
Shah, Syed Saad Hussain, Jabran Aziz, Ahsan raza Jaffari, Sidra Waris, Wasiq Ejaz, Maira Fatima dan Syed Kamran Sherazi .2012. The Impact of Brands on Consumer Purchase Intentions. Asian Journal of Business Management, Vol. 4, No.2, pp.105–110.
Shapiro,Stewart. dan H. Shanker Krishnan .2001. Memory Based Measures for Assessing Advertising Influence: A Comparison of Explicit and Implicit Memosy influence. Journal of Advertising Vol.30 ,No.3.
Sheldon, Pavica dan Katherine Bryant.2016. Instagram: motives for its use and relationship to narcissism and contextual age. Computers in Human Behavior, Vol. 58, pp. 89-97.
Sugiyono. 2018. Metode Penelitian Kuantitatif Kualitatif dan R&B. Bandung: Alfabeta.
Sun, Yongqiang , Kai H. Lim , Chunping Jiang, Jerry Zeyu Peng and Xiaojian Chen .2010., Do males and females think in the same way? An empirical investigation on the gender differences in web advertising evaluation. Computers in Human Behavior, Vol. 26, No. 6, pp. 1614-1624.
Supriyadi,Edy dan Lies Putriana, 2010. Pengaruh Entertainment, Irritation Dan Informativeness Iklan Di Website di Kalangan Mahasiswa Fakultas Ekonomi Universitas Pancasila. Journal The Winners, Vol. 11, No. 2, pp.179-187. Teng, Lefa, Nan Ye , Ying Yu , dan Xiaochuang Wu .2014. Influences of culturally verbal and visual congruency/incongruency across cultures in a competitive advertising context. Journal of Business Research,Vol 3, No. 67, pp. 288–294.
Till, D.Brian and Daniel W. Baack .2005. Recall and persuasion: Does creative advertising matter?. Journal of Advertising, Vol 3, No.34,pp 47–57.
Wen, Chao, Victor R. Prybutok And Chenyan Xu. 2011. An Integrated Model For Customer Online Repurchase Intention. The Journal Of Computer Information Systems, Vol 1, No 52, pp. 14-23.
Wiyono, Gendro. 2011. Merancang Penelitian Bisnis dengan Alat Analisis SPSS 17.0 dan Smart PLS 2.0. Yogyakarta: Percetakan STIM YKPM.
Xu, Heng, Lih-Bin Oh, dan Hock-Hai Teo.2009. Perceived influenceiveness of text vs. Multimedia location-based advertising messaging. International Journal of Mobile Communications, Vol. 7, No. 2, pp. 154-177.
Yen, Chiahui, Meng-Hsiang Hsu, dan Chun-Ming Chang .2013. Exploring the online bidder’s repurchase intention: a cost and benefit perspective. Inf Syst E-Bus Manage, No11, pp. 211–234.