Rare Decays
Christian Elsasser1,a[on behalf of the LHCb collaboration]
1Physics Institute, University of Zurich, Winterthurerstrasse 190, CH-8057 Zürich
Abstract.This review presents recent results on key measurements of rareBandτdecays performed at the LHC and the TeVatron. Its main focus lies on recent measurements of the decayB0
(s) → µ+µ− at the two
colliders and of angular observables for the decayB0 →K∗0µ+µ−at the LHC experiments ATLAS, CMS and LHCb. Furthermore, the branching fraction measurement at low dilepton masses in the channelB0→K∗0e+e− from LHCb and results on the decayB±→π±µ+µ−as well as on lepton-flavour- and baryon-number-violating rare decays ofτleptons are discussed.
1 Introduction
The GIM-Mechanism [1] forbids processes involving Flavour-Changing Neutral Currents (FCNC) at tree level in the Standard Model (SM). Therefore decays of hadrons involvingb → s,b → d,s→ dorc→ utransitions are only allowed via box or penguin diagrams leading to a large suppression in the SM. This means that contributions from new physics (NP) involving “new” virtual particles might be of the same order of magnitude than the one from SM making these decays possible places to search for effects from NP.
Due to the full spectrum of B and D hadrons pro-duced at hadron colliders there is a large variety of decays to study FCNC (e.g. for ∆B = ±1 B0 → K0∗γ, B0
s → µ+µ−,Λb0 → Λ0µ+µ−) with a rich phenomenology of observables which can be modified by NP contributions (e.g. B0 → K0∗γ: ACP,B0
s → µ+µ−: branching fraction, Λ0b→Λ0µ+µ−: differential branching fraction).
Processes of FCNC can be described by an effective Hamiltonian [2], e.g. for theb→ stransition
Heff=−
4GF √
2VtbV ∗ ts e
2
16π2 X
i
(CiOi+C0iO0i)+h.c. (1)
whereO(0)i are the local operators describing the long dis-tance interaction while the Wilson coefficients C(0)i de-scribe the short distance couplings.
Effects of NP can either modify the Wilson coefficients or lead to contributions from additional operators not present in the SM.
2 The Decay
B
0→
K
∗0µ
+µ
−The decay B0 → K∗0µ+µ− is sensitive to the Wilson co-efficientsC(0)9 andC(0)10 assigned to the semileptonic
opera-ae-mail: [email protected]
]
4
c
/
2
[GeV
2
q
0 5 10 15 20
]
-2
GeV
4
c
×
-7
[10
2
q
/d
B
d
0 0.5 1 1.5
Theory Binned
LHCb CDF BaBar Belle CMS
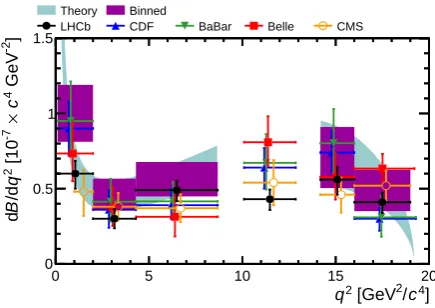
Figure 1.The differential branching fraction dB/dq2for the
de-cayB0 →K∗0µ+µ−as a function of the invariant dimuon mass squaredq2. The coloured error bars represent the latest
measure-ments from LHC, TeVatron andBfactory experiments while the SM prediction [10] and its average over the experimental bins are shown by the blue band and the purple rectangles, respectively.
tors. In addition the decay is at low invariant dimuon mass squared (q2) also sensitive toC(0)
7 assigned to the magnetic operator asq2is approaching the photon pole.
The branching fraction of the decay has been measured by several experiments [3–5] and good agreement with the SM prediction [6–9] has been found. Nevertheless NP might affect the differential branching fraction dB/dq2and the angular distribution of the final state particles.
The B factories as well as CDF have measured the differential branching fraction in the past [11–13]. In spring 2013 LHCb [14] and CMS [15] published results based on their full 2011 data sets of 1.0 fb−1and 5.2 fb−1, respectively.
The analyses have been done by fitting the invariant mass distribution of the B0 candidates in bins of q2. The q2
EPJ Web of Conferences 60, DOI: 10.1051/epjconf/201360
© Owned by the authors, published by EDP Sciences, 2013
04003 (2013) 040 30
1 Introduction
Within the Standard Model the decay
B
0d
!
K
⇤0µ
+µ
occurs via loop diagrams that mediate the transition
b
!
s
`
+`
and therefore has a small branching fraction of (1
.
06
±
0
.
1)
·
10
6[1]. It is found [2] that
angular distributions of the 4-particle final state, as well as the decay amplitudes, are sensitive to physics
beyond the Standard Model, mainly as a result of the interference of new diagrams with the Standard
Model diagrams.
The decay
B
0d
!
K
⇤0µ
+µ
with
K
⇤0!
K
+⇡
is described by four kinematic variables, one is
the invariant mass
q
2of the di-muon system and the other three are angles describing the geometrical
configuration of the final state as shown in Figure 1:
✓
Lis the angle between the
µ
+and the direction
opposite to the
B
0din the di-muon rest frame,
✓
Kis the angle between the
K
+and the direction opposite
to the
B
0d
in the
K
⇤0rest frame, and is the angle between the plane defined by the two muons and the
plane defined by the kaon-pion system in the
B
0d
rest frame. In the case of the
B
0dthe angles
✓
Land
✓
Kare defined with respect to the
µ
and the
K
, respectively.
When the amount of data is insu
ffi
cient to study the 4-di
↵
erential decay rate, the di
↵
erential decay
rate is projected from the four kinematic variables into the 2-dimensional distributions d
2/
d
q
2dcos
✓
L
and d
2/
d
q
2dcos
✓
K
by integrating over the two other variables. These distributions are binned in intervals
of
q
2, and the values of the
K
⇤0longitudinal polarisation fraction
F
L
and of the lepton forward-backward
asymmetry
A
FBare extracted, averaged in the
q
2bins. This measurement was previously performed by
A
FBand
F
Lin five out of the six
q
2<
q
<
.
B
d0µ
+µ
K
+⇡
✓
L✓
KFigure 1: Definition of the kinematic angles in the decay
B
0d!
K
⇤0µ
+µ
.
2 Event Reconstruction and Signal Selection
2.1 The ATLAS Detector
The ATLAS experiment [8] at the LHC is a general purpose particle detector covering almost the full
solid angle around the
pp
collision point with layers of tracking detectors, calorimeters and muon
track-ing chambers. The measurement presented here is mainly based on the Inner Detector (ID) and the Muon
System (MS).
The ID consists of a silicon pixel detector, surrounded by a silicon strip detector (SCT) and a
transi-tion radiatransi-tion tracker, embedded in a 2 T axial magnetic field. Charged particle trajectories are measured
for
|
⌘
|
<
2
.
5
1. Enclosing the calorimeter, the MS has a toroidal magnetic field and contains a combination
of monitored drift tubes and cathode strip chambers, capable of measuring muon trajectories in a range
1
The pseudorapidity is
⌘
=
ln(tan(
✓/
2)), where
✓
is the polar angle measured from the beam line.The ATLAS coordinate
system is described in reference [8].
1
Figure 2. Helicity angle definition ofθl, θK and φ in B0 →
K∗0µ+µ−.θ
lis the angle between the flight direction ofB0and the decay line of the muons in the dimuon rest frame andθKthe one between the flight direction ofB0 and the flight direction of the
charged kaon in theK∗0rest frame whileφis the angle between
the dimuon andK∗0decay plane.
regions at q2 = 9.5 GeV2/c4 and 13.5 GeV2/c4 corre-sponding to theJ/ψandψ(2S) resonances are excluded. The number of signal events has been normalized to the decay channel B0 → J/ψK∗0. This is also the source of the largest systematic uncertainty. A possible K+π− S-wave contamination from B0 → K+π−µ+µ− has been only taken into account as a systematic uncertainty by ATLAS and LHCb. CMS incorporates it into the fit. The measurements show good agreement with the SM prediction [10]1 (cf. Fig. 1). The prediction has large uncertainties induced by the form factor calculation. This leads to a reduced sensitivity to NP effects.
The angular distribution of the decay can be fully de-scribed by the three helicity anglesθl,θK andφ (defined in Fig. 2) as well asq2. An angular analysis of the decay gives access to several observables with small theoretical uncertainties and possible large effects from NP [17]. The two most prominent ones, measured by all three LHC ex-periments2 are the fraction of longitudinal polarized K∗0 mesons,FL, and the forward-backward asymmetry of the leptons with respect to theB0flight direction,A
FB, which can be determined through the double differential decay rates integrated overθlandφ
1 Γ
d2Γ dq2d cosθl =
3 4FL(q2)
1−cos2θ l+3
8
1−FL(q2)
1+cos2θl
+AFB(q2) cosθl (2) and integrated overθKandφ,
1 Γ
d2Γ dq2d cosθK =
3
2FL(q2) cos2θK+ 3
4
1−FL(q2)1−cos2θK. (3)
1An alternative set of predictions consistent with the SM, averaged over eachq2bin, has been recently published in Ref. [16].
2LHCb has also measured other observables including the theoreti-cally very clean transverse asymmetriesA2
TandAReT [17].
] 4 c / 2 [GeV 2 q
0 5 10 15 20
L F 0 0.2 0.4 0.6 0.8 1 Theory Binned
LHCb CDF BaBar Belle ATLAS CMS
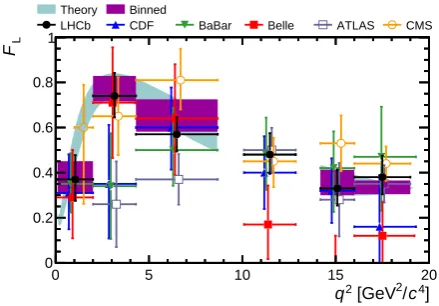
Figure 3.The fraction,FL, of longitudinal polarizedK∗0mesons
in the decayB0→K∗0µ+µ−as a function of the invariant dimuon mass squared,q2, measured by LHC and TeVatron experiments
as well as theBfactories. The SM prediction [10] and its average over the experimental bins are shown by the blue band and the purple rectangles, respectively.
Recent measurements of LHCb [14], CMS [15] and AT-LAS using their 2011 data set of 4.9 fb−1 [18] are based on a simultaneous fit of the B0 candidate mass distribu-tion as well as the cosθKand cosθldistributions3 in bins ofq2. Fig. 3 and 4 show the measured values forF
Land AFBfrom the three LHC experiments as well as previous measurements from theBfactories [11, 12] and CDF [13]. In case of FL, no significant deviation from the SM prediction [10] has been observed. Especially the most precise measurements from LHCb and CMS show in all bins ofq2a good agreement with respect to the SM pre-diction.
A similar situation is present inAFB: No experiment sees a significant deviation from the SM prediction. CMS and LHCb show particularly in the lowq2 region a good agreement with the theoretical prediction and therefore clearly disfavor a possible deviation from SM predictions which could not have been ruled out by BELLE in this region. In addition LHCb measured for the first time the zero-crossing point q2
0 of AFB. The result, (4.9 ± 0.9) GeV2/c4[14] is in good agreement with SM predic-tions of 3.9−4.3 GeV2/c4[19–21]. The quoted uncertainty is only the statistical one as the systematical uncertainty on the measured value of q2
0 is so far negligible in com-parison to the statistical one. Note, that the existence of a zero-crossing point fixes the sign ofC7relative to the sign ofC9[22].
3LHCb also fits the ˆφdistribution where
ˆ φ=
φ+π ifφ <0
φ else.
which leads to a better sensitivity and allows to determine additional ob-servables.
]
4
c
/
2
[GeV
2
q
0 5 10 15 20
FB
A
-1 -0.5 0 0.5 1
Theory Binned
LHCb CDF BaBar Belle ATLAS CMS
Figure 4. The lepton forward-backward asymmetry,AFB, with respect to the flight direction of theB0meson as a function of the
invariant dimuon mass squared,q2, measured by LHC and
TeVa-tron experiments as well asBfactories. The SM prediction [10] and its average over the experimental bins are shown by the blue band and the purple rectangles, respectively.
3 The Decay
B
0→
K
0∗e
+e
−Similar measurements – although experimentally more challenging – can be performed with electrons instead of muons in the final state. The channelB0 → K0∗e+e−can be used to probe the very lowq2region due to the smaller mass of the final state leptons. Therefore this channel is more sensitive to the photon coupling described byC7(0). As a first step toward a full angular analysis, LHCb has measured [23] based on the 2011 data set the branching fraction at lowq2 with p
q2 =mee ∈ [30,1000] MeV/c2. The number of signal events is normalized using the decay channelB0→J/ψ(→e+e−)K∗0. The measured branching fraction is:
B(B0→K∗0e+e−)
[30,1000]=(3.1+−00..89(stat.+−00..34(syst))×10−7.
The dominating systematic uncertainty is due to the uncertainty on the branching fraction of the normalization channel. There is also a 2.5 % uncertainty due to possible contamination from the decay B0 → K∗0γ with photon conversion.
4 The Decay
B
±→
π
±µ
+µ
−The decayB±→π±µ+µ−involves ab→ dtransition and can therefore be used to test the flavour structure of possi-ble NP models.
Under the assumption of Minimal Flavour Violation (MFV), i.e. a similar flavour structure as in the SM, the ratio of the branching fractions between B± → π±µ+µ− andB±→K±µ+µ−is
B(B±→π±µ+µ−)
B(B±→K±µ+µ−) =|Vtd/Vts|2·f2 (4) where f covers differences in the form factors of the two decay channels.
] 2 c [MeV/
-µ
+
µ
+
π
M
5000 5500 6000 6500
)
2
c
Candidates / (20 MeV/
0 5 10 15 20
(a)
-µ
+
µ
+
π →
+
B
-µ
+
µ
+
K →
+
B
-π
+
π
+
π →
+
B
Part. reco.
Combinatorial LHCb
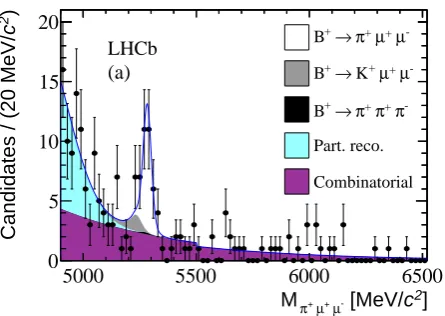
Figure 5. The invariant mass distribution of theB± →µ+µ−π± candidates. Beside background coming from combinatorics as well as partial reconstruction also background coming from mis-identification of the pion or the two muons are considered in the signal yield fit.
LHCb has measured this ratio based on the full 2011 data sample [24]. Fig. 5 shows theπµµinvariant mass distribu-tion of the candidates selected by a boosted decision tree (BDT). The signal yield has been extracted by a unbinned maximum-likelihood fit taking into account combinatorial background as well as backgrounds from partially recon-structed decays and mis-identified final state particles. The resulting ratio has been
B(B±→π±µ+µ−)
B(B±→K±µ+µ−) =0.053±0.014(stat.)±0.001(syst.) (5)
translating into
|Vtd/Vts|=0.266±0.035(stat.)±0.003(syst.) (6)
using f =0.87 [25] and neglected the uncertainty on f in calculating the systematical uncertainty on the CKM ma-trix elements ratio. No large enhancement of b → d is observed as the extracted ratio does not significantly devi-ate from the World average of|Vtd/Vts|=0.211±0.001± 0.006 [26] dominated by the ratio of the measurements of ∆mdand∆ms.
5 The Decays
B
0(s)→
µ
+µ
− The very rare decays B0(s) → µ+µ−are in addition to the GIM suppression also suppressed by helicity in the SM. Therefore they are particularly sensitive to possible NP contributions in the scalar and pseudo-scalar sector, i.e. to the Wilson coefficientsCS(0),Passigned to the scalar and pseudo-scalar operator. Thus the branching fraction mea-surements can test models with an extended Higgs sector. The predicted values for the branching fractions are
B(B0
s →µ+µ−) = (3.25±0.17)×10−9 B(B0→µ+µ−) = (1.07±0.10)×10−10
where both values are evaluated for a decay timet = 0 of the meson [27]. This fact has to be taken into account for the decay B0
s → µ+µ− as the B0s meson has a finite width difference∆Γswhich leads to a modified branching fraction of
B(B0
s→µ+µ−)hti = 1+Aµµ∆Γ·∆Γs/2Γs
1−(∆Γs/2Γs)2 · B(B 0
s →µ+µ−) = (3.56±0.18)×10−9
when averaging over all decay time values [28].Aµµ ∆Γis an
observable sensitive to NP. It can take values between−1 and+1 withAµµ∆Γ;SM= +1. As all analyses ofB0s →µ+µ− have so far been performed in a time-integrated way, one has to compare the results with this modified prediction. The TeVatron experiments CDF and D0 published at the beginning of 2013 results based on the full data samples collected in the TeVatron run II [29, 30]. Both experiments use multivariate classifiers as well as the invariant dimuon mass to separate signal and background and normalize the signal yield using the decayB± → J/ψK±. D0 measures an upper limit of
B(B0
s →µ+µ−) < 15×10−9@ 95 % C.L. while CDF – analyzing events where both muons fly into the central region of the detector (CC) or one muon flying into the forward direction (CF) separately – sees on excess in the CC channel translating into a double-sided limit of
B(B0s →µ+µ−) ∈ [0.8,34]×10−9@ 95 % C.L., which is compatible with the SM prediction.
The latest results from ATLAS [31] and CMS [32] are based on 2.4 fb−1and 5.0 fb−1of 2011 data, respectively. ATLAS has used a similar approach in analyzing the decay as the TeVatron experiments and determined an upper limit of
B(B0
s →µ+µ−) < 22×10−9@ 95 % C.L. while CMS performs a cut based analysis leading to an upper limit of
B(B0
s →µ+µ−) < 7.7×10⁻⁹@ 95 % C.L. . The most powerful result on this decay comes from LHCb based on a combined analysis of 1.0 fb−1of 2011 data and 1.1 fb−1of 2012 data [33]. The measurement is based on a BDT and the invariant dimuon mass to separate signal and background and uses the decaysB± → J/ψK± andB0→K±π∓to normalize the observed number of sig-nal events.
In this analysis LHCb has seen for the first time an evi-dence of the decayB0
s → µ+µ−as there has been a 3.5σ deviation from the background only hypothesis.
Furthermore, LHCb has measured the branching fraction by fitting the invariant dimuon mass distribution simulta-neously in eight bins of the BDT classifier (cf. Fig. 6).
This leads to
B(B0
s →µ+µ−)=(3.2−1+1..42(stat)−0+0..53(syst))×10−9 (7)
]
2 c
[MeV/
−
µ
+
µ m
5000 5500 6000
)
2
c
Candidates / (50 MeV/
0 2 4 6 8 10 12 14
LHCb
(8TeV)
1
−
(7TeV) +1.1 fb
1
−
1.0 fb
BDT > 0.7
Full PDF
B0
s→µ+µ−
B0→µ+µ−
Comb. background
B0
(s)→h+h0−
B0→π−µ+ν
µ
B0(+)→π0(+)µ+µ−
Figure 6.The invariant dimuon mass distribution for very signal-likeB0
(s) →µ+µ−candidates together with the signal and
back-ground contributions included in the branching fraction fit.
in good agreement with the SM prediction. Fig. 7 shows the most recent results on the B0
s → µ+µ− branching fraction compared to SM predictions. All recent measurements are in agreement with the SM. The result from LHCb gives strong constraints on possible NP in the scalar and pseudo-scalar sector. This means also that the decay starts to be sensitive to the Wilson coefficient C10(0) associated to the axial-vector operator, which is the only one allowed in the SM.
In the case of B0 → µ+µ− no significant excess over background has been seen by CDF, CMS and LHCb which have analyzed this decay. The most stringent upper limit has been observed by LHCb using 1.0 fb−1 of 2011 data and 1.1 fb−1of 2012 data [33], resulting in
B(B0→µ+µ−)<9.4×10⁻¹⁰@ 95 % C.L.
6 Lepton Flavour and Baryon Number
Violating Decays
Besides hadronic rare decays, LHCb also studies rare de-cays of leptons, including searches for the lepton vio-lating decay τ± → µ±µ+µ−. In the SM this decay is only allowed via neutrino oscillation resulting in a pre-dicted branching fraction of the order of 10−54 [34]. But many extensions of the SM, e.g. supersymmetric mod-els, allow flavour violation in the charged lepton sector and therefore predict a branching fraction of the order of 10−10 to 10−8 [35] which is in reach of LHCb. So far, the world’s best upper limit has been set by BELLE with
B(τ±→µ±µ+µ−)<2.1×10⁻⁸@ 90 % C.L. [36]. The decayτ±→µ±µ+µ−has been studied in LHCb using the 1.0 fb−1 data sample collected in 2011. The analysis follows a similar path as the search forB0
0.1 1 10 100
D0 (10.4 fb-1)
CDF (10 fb-1)
ATLAS (2.4 fb-1)
CMS (4.9 fb-1)
LHCb (1.0 fb-1+1.1 fb-1)
Theo. Prediction time-av. Theo. Prediction t=0
B(B
s0 µ+µ-) [10-9]95 % C.L.
Figure 7. Summary plot of the most recent branching fraction measurements ofB(B0
s→µ+µ−) at LHC and TeVatron. All mea-surements are in perfect agreement with the SM prediction (light-gray: prediction for proper timet=0, dark-gray: time-averaged
prediction)
The signal yield is normalized using the decayD± s →φ(→ µ+µ−)π±. The upper limit is extracted using a binned CLs method [37] and gives an upper limit of [38]
B(τ±→µ±µ+µ−)<8.0×10⁻⁸@ 90 % C.L.
LHCb has also set in a similar manner for the first time di-rect limits on the branching fractions for the baryon num-ber violating decaysτ+→pµ+µ−andτ+→ pµ+µ+[38]
B(τ+→pµ+µ−) < 3.3×10⁻⁷@ 90 % C.L. B(τ+
→pµ+µ+) < 4.4
×10−7@ 90 % C.L..
7 Summary
In recent months many interesting measurements in the field of rare decays have been performed at hadron col-liders. So far, there is no significant disagreement between the SM predictions and the measurements. This leads to tight constraints on possible NP models.
The data samples collected at LHC in the 2012 run have been only partially analyzed. Especially the measurements based on these data samples ofB0 → K∗0µ+µ−as well as of radiative rare decays likeB0→K∗0γwill be interesting probes of possible effects beyond the SM.
References
[1] S. Glashow, J. Iliopoulos, L. Maiani, Phys. Rev.D2, 1285 (1970)
[2] M. Beneke, T. Feldmann, D. Seidel, Nucl. Phys. B612, 25 (2001),hep-ph/0106067
[3] A. Ishikawa et al. (BELLE collaboration), Phys. Rev. Lett.91, 261601 (2003),hep-ex/0308044
[4] B. Aubert et al. (BaBar collaboration), Phys. Rev. Lett.91, 221802 (2003),hep-ex/0308042
[5] T. Aaltonen et al. (CDF collaboration), Phys. Rev. D79, 011104 (2009),0804.3908
[6] A. Ali, P. Ball, L. Handoko, G. Hiller, Phys. Rev. D61, 074024 (2000),hep-ph/9910221
[7] D. Melikhov, N. Nikitin, S. Simula, Phys. Lett.B442, 381 (1998),hep-ph/9807464
[8] H.M. Choi, C.R. Ji, L. Kisslinger, Phys. Rev.D65, 074032 (2002),hep-ph/0110222
[9] A. Ali, E. Lunghi, C. Greub, G. Hiller, Phys. Rev. D 66, 034002 (2002)
[10] C. Bobeth, G. Hiller, D. van Dyk, JHEP 1107, 067 (2011),1105.0376
[11] B. Aubert et al. (BaBar collaboration), Phys. Rev. D73, 092001 (2006),hep-ex/0604007
[12] J.T. Wei et al. (BELLE collaboration), Phys. Rev. Lett.103, 171801 (2009),0904.0770
[13] T. Aaltonen et al. (CDF collaboration), Phys. Rev. Lett.108, 081807 (2012),1108.0695
[14] R. Aaij et al. (LHCb collaboration) (2013), submitted to JHEP,1304.6325
[15] S. Chatrchyan et al. (CMS collaboration), CMS PAS BPH-11-009 (2013)
[16] S. Descotes-Genon, T. Hurth, J. Matias, J. Virto, JHEP1305, 137 (2013),1303.5794
[17] W. Altmannshofer, P. Ball, A. Bharucha, A.J. Buras, D.M. Straub et al., JHEP0901, 019 (2009), 0811.1214
[18] G. Aad et al. (ATLAS collaboration), ATLAS-CONF-2013-038 (2013)
[19] C. Bobeth, G. Hiller, D. van Dyk, C. Wacker, JHEP 1201, 107 (2012),1111.2558
[20] M. Beneke, T. Feldmann, D. Seidel, Eur. Phys. J. C41, 173 (2005),hep-ph/0412400
[21] A. Ali, G. Kramer, G.H. Zhu, Eur. Phys. J.C47, 625 (2006),hep-ph/0601034
[22] P. Gambino, U. Haisch, M. Misiak, Phys. Rev. Lett. 94, 061803 (2005),hep-ph/0410155
[23] R. Aaij et al. (LHCb collaboration) (2013), submitted to JHEP,1304.3035
[24] R. Aaij et al. (LHCb collaboration), JHEP 12, 125 (2012),1210.2645
[25] P. Ball, R. Zwicky, Phys. Rev.D71, 014015 (2005), hep-ph/0406232
[26] J. Beringer et al. (Particle Data Group), Phys. Rev. D86, 010001 (2012)
[27] A.J. Buras, R. Fleischer, J. Girrbach, R. Knegjens (2013),1303.3820
[28] K. De Bruyn, R. Fleischer, R. Knegjens, P. Koppen-burg, M. Merk et al., Phys. Rev.D86, 014027 (2012), 1204.1735
[29] V.M. Abazov et al. (D0 collaboration), Phys. Rev. D87, 072006 (2013),1301.4507
[30] T. Aaltonen et al. (CDF collaboration), Phys. Rev. D87, 072003 (2013),1301.7048
[31] G. Aad et al. (ATLAS collaboration), Phys. Lett. B713, 387 (2012),1204.0735
[32] S. Chatrchyan et al. (CMS collaboration), JHEP 1204, 033 (2012),1203.3976
[33] R. Aaij et al. (LHCb collaboration), Phys. Rev. Lett. 110, 021801 (2013),1211.2674
[34] M. Raidal, A. van der Schaaf, I. Bigi, M. Mangano, Y.K. Semertzidis et al., Eur. Phys. J.C57, 13 (2008), 0801.1826
[35] A. Ilakovac, A. Pilaftsis, L. Popov (2012), 1212.5939
[36] K. Hayasaka et al. (BELLE collaboration), Phys. Lett.B687, 139 (2010),1001.3221
[37] A. Read, J. Phys. G: Nucl. Part. Phys28, 2693 (2002) [38] R. Aaij et al. (LHCb collaboration) (2013), submitted