www.nat-hazards-earth-syst-sci.net/15/1483/2015/ doi:10.5194/nhess-15-1483-2015
© Author(s) 2015. CC Attribution 3.0 License.
Modeling debris-flow runout patterns on two alpine fans with
different dynamic simulation models
K. Schraml1, B. Thomschitz1, B. W. McArdell2, C. Graf2, and R. Kaitna1
1Institute of Mountain Risk Engineering, University of Natural Resources and Life Sciences, 1190 Vienna, Austria 2Swiss Federal Research Institute WSL, Zürcherstrasse 111, 8903 Birmensdorf, Switzerland
Correspondence to: K. Schraml ([email protected])
Received: 29 January 2015 – Published in Nat. Hazards Earth Syst. Sci. Discuss.: 13 February 2015 Revised: 18 May 2015 – Accepted: 23 May 2015 – Published: 02 July 2015
Abstract. Predicting potential deposition areas of future debris-flow events is important for engineering hazard as-sessment in alpine regions. To this end, numerical simulation models are commonly used tools. However, knowledge of appropriate model parameters is essential but often not avail-able. In this study we use two numerical simulation models, RAMMS–DF (rapid mass movement system–debris-flow) and DAN3D (dynamic analysis of landslides in three dimen-sions), to back-calculate two well-documented debris-flow events in Austria and to compare the range and sensitivity of input parameters for the Voellmy flow model. All simu-lations are based on the same digital elevation models and similar boundary conditions. Our results show that observed deposition patterns are best matched with a parameter set of µ[–] andξ[m s−2], ranging between 0.07 to 0.11 and 200 to 300 m s−2, respectively, for RAMMS–DF, and between 0.07 to 0.08 and 300 to 400 m s−2, respectively, for DAN3D. Sen-sitivity analysis shows a higher senSen-sitivity of model parame-ters for the DAN3D model than for the RAMMS–DF model. This contributes to the evaluation of realistic model parame-ters for simulation of debris-flows in steep mountain catch-ments and highlights the sensitivity of the models.
1 Introduction
Debris-flows are mass wasting processes which occur in alpine regions and regularly cause loss of human life and property. It is therefore of great public and private inter-est to delineate hazardous areas where future debris-flows are expected to occur. For this, various types of simula-tion models provide useful guidance and are often used
in engineering practice. Such models range from purely empirical–statistical approaches (e.g.„ Scheidegger, 1973; Körner, 1976; Rickenmann, 1999; Legros, 2002; Scheidl and Rickenmann, 2010) to more physically based, determinis-tic approaches, mostly based on depth-averaged flow equa-tions and a simple flow resistance term (e.g., Takahashi, 1991; Hungr, 1995; O’Brien et al., 1993; Medina et al., 2008; Christen et al., 2010a, b).
Independent of the constitutive relation used, a common caveat for all numerical simulation tools remains model cal-ibration (i.e., appropriate choice of flow-resistance param-eters). In the case of simple stress–strain relations (e.g., Bingham, Herschel Bulkley model), laboratory experiments have been conducted to derive material parameters for highly concentrated grain–fluid mixtures (e.g., Phillips and Davies, 1991; Major and Pierson, 1992; Contreras and Davies, 2000; Kaitna and Rickenmann, 2007; Kaitna et al., 2007). How-ever, direct application of the results is complicated be-cause scaled experiments together with the simple flow re-sistance models do not themselves represent full mixture dynamics of a real scale debris-flow (Iverson, 1997, 2003; Ancey, 2006; Kaitna et al., 2014). Therefore, as for con-ceptual depth-averaged flow resistance approaches (Voellmy model, Coulomb, etc.), model parameterization based on the back-calculation of well-documented past events appears to be preferable for engineering application (e.g., Hungr et al., 2005; Rickenmann et al., 2006; Hürlimann et al., 2008; Christen et al., 2010a).
rock avalanches and debris-flows (e.g., Hungr, 1995; Revel-lino et al., 2004; Naef et al., 2006; Sosio et al., 2008; Deline et al., 2011). For snow avalanches, a reasonable database of model parameters for different types of snow and land cover is available (e.g., Bartelt et al., 2013a). However, there is much less experience in the case of debris-flows.
We therefore present our experiences with back-calculating Voellmy parameters for two well-documented debris-flow events in Austria. We do this using the simula-tion platforms, RAMMS–DF (rapid mass movement system– debris-flow) and DAN3D (dynamic analysis of landslides in three dimensions). Because a plausible representation of sim-ulation results requires knowledge of the sensitivity of model input parameters, we additionally carried out a comparative sensitivity analysis for both models. Section 2 gives a brief overview of the technical background of RAMMS–DF and DAN3D, the Voellmy model and the application to the two study sites. The best-fit parameters and the sensitivity analy-ses are presented in Sect. 3 and discussed in Sect. 4.
2 Methodology and study area 2.1 Study sites
Reiselehnrinne Creek is located in the Pitztal Valley, south-west of Innsbruck, Tyrol, Austria (46◦590N, 10◦520E) (Fig. 1a). The catchment extends from 3343 to 1620 m a.s.l. and covers an area of 0.7 km2. The source area of the catch-ment is dominated by gneiss and mica schists. The mid-dle, channelized part of the watershed consists of debris-overlaying bedrock, whereas coarse debris-flow material comprises the fan (Kogelnig-Mayer et al., 2011). Data from a rain gauge located in Plangeross (1620 m a.s.l.) show that annual rainfall varies between 600 and 1150 mm. Detailed information on the long-term event history of this site can be found in Kogelnig-Mayer et al. (2011), who reconstructed several debris-flows and snow avalanches during the last century using dendro-geomorphic methods. The best docu-mented debris-flow event occurred in August 2009 and de-posited around 20 000–25 000 m3 of material on the oro-graphic right side of the fan and ran out onto the provincial road, which was subsequently blocked for several hours. This event was back-calculated within the present study.
The second study area is the densely forested fan of Fes-teticgraben Creek, situated in the Gesäuse National Park, Styria, Austria (47◦350N, 14◦380E). The Festeticgraben
Creek extends from the Planspitze summit (2117 m a.s.l.) to 570 m a.s.l. at the confluence of the Enns River oppo-site the small village of Gstatterboden (Fig. 1b). The small catchment area (0.7 km2) is dominated by Triassic limestone (Dachsteinkalk) and dolomites and the material deposited on the fan has a mean grain size of 84 mm. A rain gauge in the village of Gstatterboden, opposite the fan, recorded a mean annual precipitation between 1000 and 1700 mm.
Figure 1. (a) The Reiselehnrinne Creek in the Pitztal study area in the western part of Austria, and (b) Festeticgraben Creek (source aerial photo: GIS-Steiermark, 2013) in the eastern part of the Aus-trian Alps. The catchment areas (white dashed lines) are defined as the source zones and deliver material to the fans (red solid lines).
Schraml et al. (2015) reconstructed debris-flow events on several gullies of the steep Planspitze north face through dendro-geomorphic techniques, including an event chronol-ogy of the Festeticgraben debris fan, as well as information on the geology and forest stand of the northern Planspitze area. In this study we focus on the most recent event, for which material deposited on the forested fan widely spread on both sides of the channel. Our back-calculation was for the 2006 event. Through field investigation we estimated a total volume of∼10 000 m3deposited on the fan. We assume that the evenly distributed forest stand influenced the debris-flow deposition behavior, which we attempted to account for in our simulations.
2.2 Simulation tools and friction relation
coordinate system for RAMMS (Christen et al., 2010b). A number of studies can be found in literature in which similar depth-averaged equations were derived, such as Iverson and Denlinger (2001) and Pastor et al. (2002) for Eulerian forms, and e.g., Savage and Hutter (1989) and Gray et al. (1999) for Lagrangian forms.
RAMMS uses the total variation diminishing (TVD) finite volume scheme (FVM) applied on 3D terrain (Christen et al., 2005; Graf and McArdell, 2008). By this method, aver-aged cell values are calculated for each place in a grid by the means of the edge fluxes from the neighboring cells (Toro, 1999). Detailed information on the discretization technique and the numerical background of RAMMS can be found in Christen et al. (2008, 2010a, b). The frictional behavior inx andy is represented by the Voellmy model, which includes the resistance parametersµandξ(described below).
Contrary to RAMMS, DAN3D is based on smoothed par-ticle hydrodynamics (SPH) (Lucy, 1977; Gingold and Mon-aghan, 1977) to solve the governing equations resulting in flow depths, velocities and erosion thickness. Here the equa-tions are solved in the center of reference columns and these mass particles are in the flow and progressed to a new posi-tion for each time step individually (Monaghan, 1989; Benz, 1990; Sosio et al., 2008). The SPH method uses the Lan-grangian reference frame and does not need a computational grid. DAN3D allows a selection of different types of resis-tance laws, including a laminar, turbulent, plastic, Bingham, frictional or Voellmy rheology (Hungr, 1995 and Hungr and McDougall, 2009 and references therein). For comparative reasons, in this study we only focused on the Voellmy rheol-ogy.
From theoretical reasoning, Voellmy (1955) divided total resistance of the flowing media into two parts: a Coulomb-type friction (coefficientµ [–]) that scales with the normal stress, and a turbulent drag coefficientξ [m s−2] that scales with the velocity squared. A simplified representation of the total resistanceS[Pa] used in both simulation tools is as fol-lows:
S=µρH gcosφ+ ρgU2
ξ
, (1)
whereρis the bulk density,gis gravitational acceleration,φ is the slope angle, H is the mean flow height andU is the mean flow velocity (Eq. 1). The snow avalanche and hills-lope versions of RAMMS additionally offer the option of a velocity-dependent friction parameter for an improved rep-resentation of physical processes within the flow. In the ver-sion of RAMMS–DF used for this study, this option was not applied. Details of the random kinetic energy model can be found in Bartelt et al. (2006), Preuth et al. (2010) and Chris-ten et al. (2010b).
In both simulation tools, modeling of internal pressure gradients is guided by Rankine’s earth pressure theory, as similarly applied by Savage and Hutter (1989) (Bartelt et al., 1999; Hungr, 2008a). Here an internal friction angle
con-trols the resulting stresses of longitudinal straining. A min-imum value of the pressure coefficientk appears when the flowing material extends under “active” conditions. In con-trast, if the flow sheet is compressed, a maximum value re-sults under “passive” conditions (Bartelt et al., 1999; Hungr and McDougall, 2009). DAN3D uses the approach of Sav-age and Hutter (1989) to calculate stress ratios parallel and perpendicular to the bed (Hungr, 2008a):
ka/p=2
1±
q
1−cos2φ
i 1+tan2φb cos2φ
i
−1, (2)
whereφiis the internal friction angle andφbis the basal fric-tion angle (representing the ratio of basal shear stress to total normal stress). In the case ofφb=0 (basal friction is neg-ligible compared to internal friction), Eq. (2) reduces to the classic Rankine form
ka/p=tan2
45◦±φi 2
, (3)
which is implemented in RAMMS. Within our study we used the default values ofφi=35◦for DAN3D and a fixed value ofka=kp=1 for RAMMS. The consequences of this choice are discussed in Sect. 4.
2.3 Input parameters, evaluation criteria and sensitivity analysis
In engineering applications, the uncertainties are not only connected to the choice of flow resistance parametersµand ξ, but also to the magnitude of an expected future event. Therefore, we performed a sensitivity analyses for both the RAMMS–DF and the DAN3D code by separately varying each of the Voellmy input parameters,µandξ, as well as the event magnitude (source volume), while keeping the other parameters constant. The variation inµranges from 0.01 to 0.32, andξ from 100 to 1400 m s−2 and the initial volume was increased up to 100 %. For the Festeticgraben Creek in the Gesäuse area (Fig. 1b) we delineated the forested area be-side the channel. We tested increasedµvalues (between 100 and 150 %) for the forested areas to account for the resilience of trees against the impact of debris-flows. No direct relation to calibrate the frictional parameters to the topography was considered.
∼23 000 m3and∼10 000 m3, respectively, corresponding to observed deposition volumes. Sediment entrainment along the channel was neglected for all scenarios. All simulations performed in this study were made using grids based on air-borne LIDAR DEMs with a 1 m resolution. To reduce calcu-lation time and susceptibility of numerical instabilities dur-ing the calculation process, we effectively used a calculation grid of 2 m resolution for both case studies.
Because we do not have any reliable information on flow parameters in the transit reach during the events (i.e., flow depth, flow velocity), the evaluation of model performance focused solely on the deposition pattern. Since the event at Reiselehnrinne Creek as well as first simulation runs showed limited spreading of the material, the runout length of the simulated debris-flow deposits appeared to be the most use-ful evaluation criteria. Observed debris-flow material of the Festeticgraben Creek event in 2006 overtopped the channel and widely spread over the fan in form of tongues or lobes. We therefore compared observed and simulated deposition areas by using a similar approach to Carranza and Castro (2006) and Scheidl and Rickenmann (2010). For this, subar-easAx,AxandAx, resulting from superposition of observed and simulated areas (Fig. 2), were systematically compared (Eqs. 4–6). Subsequently a coverage index () is derived us-ing Eq. (7) and the closeris to unity, the more accurate the simulation results are.
α=Ax/Aobserved, (4)
β=Ay/Aobserved, (5)
γ=Az/Aobserved, (6)
:=α−β−γ . (7)
3 Results
3.1 Back-analysis of the events
First back-calculations of the event at the Reiselehnrinne Creek with both models led to differences to observed de-position patterns. Specifically, most of the material left the channel close to the distal limit of the fan and ran out straight into the forest instead of following the channelized path to the orographic right section of the fan (see dashed lines in Fig. 3a and c). To overcome this problem, we assigned an area with increased roughness(µ∗=0.9)at the left channel bank of the transit reach, that acted like a deflection dam. Subsequent simulations of both models were successful; the parameter set for the best-fit simulations using RAMMS–DF and DAN3D were:µ=0.11 andξ=200 m s−2andµ=0.08 andξ=400 m s−2, respectively.
For the second study site (Festeticgraben, Gesäuse) we dif-ferentiated between the roughness within the channel (µ) and the roughness outside of the channel, which is expected to
Figure 2. Superposition of the simulated area with the observed area of recently deposited debris-flow material at the Festeticgraben debris fan (a). Sub-areas were derived through superimposing the simulated deposits and the observed deposits (b) and following the approach of Carranza and Castro (2006), we assessed our simula-tion results. AreaAxrepresents the simulated deposits within the observed area, whereasAzindicates the non-simulated debris-flow deposits within the observed area. Simulated deposition outside the observed area is shown asAy.
be influenced by the forest stand (µF). With this modifica-tion we obtained a satisfying fit between observed and simu-lated deposition areas for the RAMMS–DF model. DAN3D was less sensitive to the separation between channelized and non-channelized flow forµ. Best-fit Voellmy parameters for the channelized flow at Festeticgraben wereµ=0.07 and ξ=300 m s−2 for both simulation models (Fig. 3b and d). The friction parameter representing the forest stand (µF) was remarkably different between the models. We usedµF=0.23 for the RAMMS–DF and µF=0.07, the same as for the channel, for the DAN3D code.
3.2 Sensitivity analyses
Figure 3. Best-fit simulations of RAMMS–DF and DAN3D for both study areas, the Reiselehnrinne (a and c) and the Festeticgraben (b and d; source aerial photo: National Park Gesäuse GmbH). Deposition heights are represented using blue color shading, for the results for the event in 2009 at the Reiselehnrinne Creek as well as for the event in 2006 at the Festeticgraben Creek. The red dashed lines represent the observed deposits. Areas of increased roughness are depicted in light yellow.
Figure 4. Variation of the Voellmy parameters (0.03–0.16 for µ
and 100–700 m s−2 forξ) and the initial volume (from 15 000 to 50 000 m s−2) for the RAMMS–DF and the DAN3D codes for the Pitztal study area. When varying one parameter, the others were kept constant. Outlines of the simulation runs are given in black, and the best-fit simulation in green. The observed deposits of the event in 2009 are presented in red.
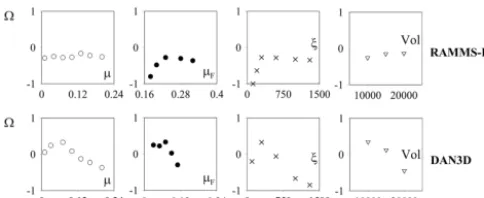
In the case of the Festeticgraben Creek, the evaluation parametergives an indication of the quality of the sim-ulated debris-flow pattern relative to the observed deposits, with=1 representing a perfect match. Note that material which was deposited in the transit zone before reaching the fan was neglected. We varied the Voellmy parameters from 0.01 to 0.24 forµand 100 to 1400 m s−2forξ. Different ini-tial volumes between 10 000 and 20 000 m3were tested. We additionally varied the roughness of the area outside of the channel (µF) between 0.03 and 0.32. Intermittent variation steps are the same for both models. Generally we detected a higher sensitivity of the friction parameterµthan of the tur-bulent coefficientξ(Fig. 5). This is mainly due to the form of the Voellmy equation, for which the Coulomb-friction term dominates flow resistance at low speeds (e.g., in the depo-sition zone), whereas the turbulent term becomes relevant when the flow is fast (e.g., in the transit zone). Because we only evaluate deposition pattern on the fan rather than flow parameters (v,h) in the transit zone, this sensitivity pattern is expected. Comparing sensitivity between simulation models, we find that RAMMS–DF is rather insensitive to parameter variations compared to DAN3D.
4 Discussion
Figure 5. Sensitivity of the dimensionlessvalue (Eq. 7) toµ,µF,
ξ and the initial volume for the Gesäuse case study for both simu-lation models. While varying one parameter, the other parameters were kept constant.
(2) erosion/deposition processes during the event itself, or (3) an overestimation of simulated flow depth. We have no data to quantify these effects, but we can make qualitative assessments. The grid size of the DEM used in this study was set to 2 m to reduce the calculation time and yet pro-vide simulation results with a relatively high spatial resolu-tion. Resulting simulated maximum flow depths between 5 and 10 m are plausible for both model results. However, the DEM used in our calculations was derived by air-borne laser scanning 3 years before the event occurred and therefore does not account for potential morphological changes in the mean-time. In an earlier study, Kogelnig-Mayer et al. (2011) re-constructed debris-flows and snow avalanches back to 1868 by tree ring analysis. The results showed that no debris-flow events were detectable between 2006 and 2009. Therefore morphological changes in the channel are expected to be mainly due to fluvial processes. For practical engineering ap-plications, there are several ways to direct the flow in a cer-tain direction, including modification of the DEM (adding a dam structure or changing the height in the original grid of the DEM), change of resistance parameters of the flow-ing mass along the channel (thereby alterflow-ing the shape of the hydrograph), or localized increase of roughness of one chan-nel bank. We chose the latter approach and increased the left channel bank roughness toµ∗=0.9 (yellow shaded area in Fig. 3). This leads to deposition along the left channel bank and acts like a deflection dam.
For the second study site at the Festeticgraben Creek we assumed that the forested fan has considerably influ-ence on the deposition behavior of debris-flows and sepa-ratedµvalues between friction within the channel and out-side of the channel. Others have addressed the significance of interactions between forest and snow avalanches (e.g., Teich, 2013; Feistl et al., 2014) which can be accounted for by adjusting the Voellmy friction parameters for sim-ulations. For the RAMMS–AV model, resistance parame-ters for forested areas of µ=0.02 and ξ=400 m s−2 for all magnitudes of avalanches can be found in the handbook (Bartelt et al., 2013a), but yet few suggestions are avail-able for debris-flows. Within this study we increasedµFfor
RAMMS–DF to 0.23, whereas for DAN3D best results were returned with the same value of µ within and outside of the channel. Similarly, Hauser (2011) increased the chan-nel friction parameter only in a minor way, fromµ=0.25 toµF=0.27 to account for roughness due to a forest when reproducing a∼70 000 m3debris-flow event in Switzerland with RAMMS–DF. Subsequent sensitivity analysis showed that the output of RAMMS–DF is mainly sensitive to varia-tions inµF rather than to variations inµin the channel. For DAN3D,µandµFinfluence results similarly.
Though we used the same input parameters for both mod-els, there are several differences between the simulation pro-grams leading to the results (Table 1). The main differences arise from different stopping criteria, calculation of the pres-sure term, and the numerical solution schemes of the mass and momentum conservation equations. For quantifying the effect of the different stopping criteria, we conducted some additional simulations to evaluate the repeatability and rel-ative sensitivity of the outcomes. RAMMS–DF stops calcu-lation at a user-defined percentage value of the total mass momentum (or it can be stopped manually or after a user-defined run duration). In this study we consistently used a value of 15 %. Changing this stopping criteria to other plau-sible values (5, 10 and 20 %), indicates that the overall sen-sitivity can be similar to that of the variation inµ(Fig. 6). Alternatively, choosing a much larger threshold leads to un-realistically early stopping, while very small thresholds may cause numerical diffusion of the simulation results (Bartelt et al., 2013b). The DAN3D code can be stopped manually or automatically after a predetermined duration. Here we manu-ally stopped the simulation when the flow front visumanu-ally came to a halt. This method is expected to be biased to some extent, but repeating identical runs gave confidence in the repeatabil-ity of our simulations.
Table 1. Comparison of model input conditions within our study. Grids, triggering conditions, excluded erosion, rheology and the governing equations are identical, whereas the numerical solution, the reference system as well as the stopping of the simulations are different.
RAMMS–DF DAN3D
Depth-averaged shallow water equations conserving mass and momentum √ √
Friction relation used Voellmy Voellmy
Numerical solution scheme FVM (finite volume) SPH (smoothed particle hydrodynamics)
Reference system Eulerian framework Lagrangian framework
Grid Fixed grid in the space Affiliated to the flowing material
DEM resolution 1 m 1 m
Source Block release mass Block release mass
Erosion Neglected in this study Neglected in this study
Stopping criteria Percentage of momentum End of visual movement
Pressure term ka=kp=1 Dynamicka/p(Eq. 2)
Figure 6. Variations of stopping criteria using the RAMMS–DF model for the Reiselehnrinne Creek case study. Outlines of the sim-ulations are presented in black; observed deposits are given in red.
value of 1 which corresponds to a hydrostatic stress distribu-tion. Variations inka/pby a factor of 2–3 had similar effects on the runout as variation of the Voellmy friction parameter µ (Bartelt et al., 2013b). The effect of the method for de-scribing the earth pressure would also influence the runout in a similar way, but it may also change the mobility of the flow in general.
Besides these differences in program code, there are also other factors that may influence model output, like the ques-tion of DEM and calculaques-tion resoluques-tion (Rickenmann et al., 2006; Hungr, 2008b; Christen et al., 2010a; Bühler et al., 2011), or erosion along the path (e.g., Hungr, 1995; Mc-Dougall and Hungr, 2005; Christen et al., 2010b; Berger et al., 2011). Effects of both were not investigated in this study. A general observation is that for both programs, chang-ing the friction parameterµhas a stronger influence on the runout distances of the simulated debris-flows than varying the ξ value in the case of the Pitztal area. This is in ac-cordance to expectations, because other studies have also shown that ξ is mainly responsible for the flow behavior along the channel andµdetermines runout (e.g., Barbolini
et al., 2000). A similar sensitivity behavior is observed for the evaluation parameterat the second test site, Festetic-graben Creek. Interestingly, the variation in the initial vol-ume provides little variation in the output of RAMMS–DF for both of our study sites. In contrast, DAN3D shows more pronounced sensitivity to initial volume variations, but sensi-tivity is similar as for the variation of resistance parameters. This moderate sensitivity to event magnitude uncertainty of ±20 % may be considered for engineering scenario design for runout prediction.
Figure 7. Voellmy resistance parameter sets from back-calculation of different events with RAMMS (R) and DAN(3D) (D). Debris-flow parameters from our study are presented as yellow crosses and triangles, respectively. Debris-flow parameters from other studies (Scheidl et al., 2013; McDougall et al., 2006; Hungr et al., 2002; Hungr, 2008b; Bartelt et al., 2013b; Jakob et al., 2000), are given as brown squares. Rock avalanches are illustrated as green circles and ice-rock avalanches are denoted by blue diamonds (Pirulli et al., 2004; Hungr and Evans, 1996, 2004; Hungr and McDougall, 2009; Hungr, 2008b; Evans et al., 2007; Allen et al., 2009; Sosio et al., 2008; Lipovsky et al., 2008; Schneider et al., 2010). Suggested parameter ranges for small (<25 000 m3) and large (>25 000 m3) snow avalanches are given in two different shaded areas (Bartelt et al., 2013a).
data show thatµdecreases andξ increases with increasing event volume, reflecting higher velocities and larger runout for large avalanches. Searching for a similar relation in pub-lished data available for other processes, we only found a weak trend for rock avalanches.
5 Conclusions
Two documented debris-flow events in Austria were back-calculated with two different simulation tools, the RAMMS– DF code and the DAN3D code: the Reiselehnrinne Creek (Pitztal) event in 2009, which released a total volume of ∼23 000 m3, and a debris-flow in the Festeticgraben Creek (Gesäuse), which delivered ∼10 000 m3 of material to the fan. Areas of increased roughness were included to account for additional surface roughness due to the interaction of the
flow with the forest. Best-fit parameter sets for both models and for both study sites are in a similar range (µ=0.07–0.11 andξ=200–400 m s−2), which is in accordance with the ex-perience of other studies. Focusing only on deposition pat-tern, sensitivity analyses using two different evaluation crite-ria showed a significant sensitivity to the vacrite-riation inµand event volume, and lower sensitivity to variation inξ. DAN3D and RAMMS–DF react differently to the variation of input parameters, which might be due to different numerical solu-tion schemes to solve the depth-averaged equasolu-tions of mo-tion in the models or due to the calculamo-tion of the resultant of the internal pressure gradients in the momentum equations. For an improved engineering hazard assessment, more expe-rience on a reasonable Voellmy parameter range for flows is desirable. Additionally, future simulations of debris-flows using the Voellmy model may be useful to differentiate between different types of surface roughness, with the goal of providing a database of recommended model parameters.
Acknowledgements. This project received financial support from
the Climate and Energy Fund and is carried out within the frame-work of the “ACRP” Program. The authors would like to thank Oldrich Hungr for providing the DAN3D code to perform our simulations within this study and for helpful discussion.
Edited by: F. Guzzetti
Reviewed by: C. Huggel and one anonymous referee
References
Allen, S. K., Schneider, D., and Owens, I. F.: First approaches to-wards modelling glacial hazards in the Mount Cook region of New Zealand’s Southern Alps, Nat. Hazards Earth Syst. Sci., 9, 481–499, doi:10.5194/nhess-9-481-2009, 2009.
Ancey, C.: Plasticity and geophysical flows: a re-view, J. Non-Newton. Fluid Mech., 142, 4–35, doi:10.1016/j.jnnfm.2006.05.005, 2006.
Barbolini, M., Gruber, U., Keylock, C. J., Naaim, M., and Savi. F.: Application of statistical and hydraulic-continuum dense-snow avalanche models to five real European sites, Cold Reg. Sci. Technol., 31, 133–149, doi:10.1016/S0165-232X(00)00008-2, 2000.
Bartelt, P., Salm, B., and Gruber, U.: Calculating dense-snow avalanche run-out using a Voellmy-fluid model with ac-tive/passive longitudinal straining, J. Glaciol., 45, 242–254, doi:10.3189/002214399793377301, 1999.
Bartelt, P, Buser, O., and Platzer, K.: Fluctuation–dissipation re-lations for granular snow avalanches, J. Glaciol., 52, 631–643, doi:10.3189/172756506781828476, 2006.
Bartelt, P., Bühler, Y., Christen, M., Deubelbeiss, Y., Salz, M., Schneider, M., and Schumacher, L.: RAMMS-AV User Man-ual, WSL Institute for Snow and Avalanche Research SLF, Davos, Birmensdorf, Switzerland, available at: http://ramms.slf. ch/ramms/, last access: 28 January 2015, 2013a.
User Manual, WSL Institute for Snow and Avalanche Re-search SLF, Davos, Birmensdorf, Switzerland, available at: http: //ramms.slf.ch/ramms/, last access: 28 January 2015, 2013b. Benz, W.: Smooth particle hydrodynamics: a review, in: The
Nu-merical Modelling of Nonlinear Stellar Pulsations, edited by: Buchler, J. R., Kluwer Academic, Dordrecht, 269–288, 1990. Berger, C., McArdell, B. W., and Schlunegger, F.: Direct
measure-ment of channel erosion by debris flows,Illgraben, Switzerland, J. Geophys. Res., 16, F01002, doi:10.1029/2010JF001722, 2011. Bühler, Y., Christen, M., Kowalski, J., and Bartelt, P.: Sen-sitivity of snow avalanche simulations to digital elevation model quality and resolution, Ann. Glaciol., 52, 72–80, doi:10.3189/172756411797252121, 2011.
Carranza, E. J. M. and Castro, O. T.: Predicting lahar-inundation zones: case study in West Mount Pinatubo, Philippines, Nat. Hazards, 37, 331–372, doi:10.1007/s11069-005-6141-y, 2006. Christen, M., Bartelt, P., and Gruber, U.: Numerical calculation of
snow avalanche runout distances, in: Computing in Civil Engi-neering, Proceeding of the 2005 International Conference, edited by: Soibelman, L. and Pena-Mora, F., Cancun, Mexico, 12–15 July 2005.
Christen, M., Bartelt, P., Kowalski, J., and Stoffel, L.: Calcula-tion of dense snow avalanches in three-dimensional terrain with the numerical simulation programm RAMMS, in: International Snow Science Workshop 2008, Proceedings, 21–27 September, Whistler, BC, CAN, 709–716, 2008.
Christen, M., Bartelt, P., and Kowalski, J.: Back calcula-tion of the In den Arelen avalanche with RAMMS: in-terpretation of model results, Ann. Glaciol., 51, 161–168, doi:10.3189/172756410791386553, 2010a.
Christen, M., Kowalski, J., and Bartelt, P.: RAMMS: nu-merical simulation of dense snow avalanches in three-dimensional terrain, Cold Reg. Sci. Technol., 63, 1–14, doi:10.1016/j.coldregions.2010.04.005, 2010b.
Contreras, S. M. and Davies, T. R.: Coarse-grained debris flows: hysteresis and time-dependent rheology, J. Hydraul. Eng., 126, 938–941, 2000.
Deline, P., Alberto, W., Broccolato, M., Hungr, O., Noetzli, J., Ra-vanel, L., and Tamburini, A.: The December 2008 Crammont rock avalanche, Mont Blanc massif area, Italy, Nat. Hazards Earth Syst. Sci., 11, 3307–3318, doi:10.5194/nhess-11-3307-2011, 2011.
Evans, S. G., Guthrie, R. H., Roberts, N. J., and Bishop, N. F.: The disastrous 17 February 2006 rockslide-debris avalanche on Leyte Island, Philippines: a catastrophic landslide in tropi-cal mountain terrain, Nat. Hazards Earth Syst. Sci., 7, 89–101, doi:10.5194/nhess-7-89-2007, 2007
Feistl, T., Bebi, P., Teich, M., Bühler, Y., Christen, M., Thuro, K., and Bartelt, P.: Observations and modeling of the braking effect of forests on small and medium avalanches, J. Glaciol., 60, 124– 138, doi:10.3189/2014JoG13J055, 2014.
Gingold, R. A. and Monoghan, J. J.: Smoothed parti-cle hydrodynamics: theory and application to non-sperical stars, Mon. Not. R. Astron. Soc., 181, 375–389, doi:10.1093/mnras/181.3.375, 1977.
GIS-Steiermark: http://www.gis.steiermark.at, last access: 25 November 2013.
Graf, C. and McArdell, B. W.: Simulation of debris flow run out be-fore and after construction of mitigation measures: an example
from the Swiss Alps, in: Debris Flows: Disasters, Risk, Fore-cast, Protection, edited by: Chernomorets, S. S., Proceedings of the International Conference, Pyatigorsk, Russia, 22–29 Septem-ber 2008, Sevkavgiprovodkhoz Institute, Pyatigorsk, 233–236, 2008.
Gray, J. M. N. T., Wieland, M., and Hutter, K.: Gravity-driven free surface flow of granular avalanches over com-plex basal topography, P. Roy. Soc. Lond. A, 455, 1841–1874, doi:10.1098/rspa.1999.0383, 1999.
Hauser, D.: Interaktion Murgang – Wald: Rekonstruktion von Ereignissen mit Hilfe von RAMMS, MS Thesis, Department of Environmential Systems Science, Swiss Federal Institute of Technology, Zurich, 2011.
Hungr, O.: A model for the runout analysis of rapid flow slides, de-bris flows, and avalanches, Can. Geotech. J., 32, 610–623, 1995. Hungr, O.: Simplified models of spreading flow of dry granular
ma-terial, Can. Geotech. J., 45, 1156–1168, 2008a.
Hungr, O.: Numerical modelling of the dynamics of debris flows and rock avalanches, Geomech. Tunnelb., 1, 112–119, doi:10.1002/geot.200800010, 2008b.
Hungr, O. and Evans, S. G.: Rock avalanche runout prediction us-ing a dynamic model, in: Proceedus-ings of the Seventh Interna-tional Symposium on Landslides, Trondheim, Norway, 1, 233– 238, 1996.
Hungr, O. and Evans, S. G.: Entrainment of debris in rock avalanches: An analysis of a long run-out mechanism, Geol. Soc. Am. Bull., 116, 1240–1252, doi:10.1130/B25362.1, 2004. Hungr, O. and McDougall, S.: Two numerical models for
landslide dynamic analysis, Comput. Geosci., 35, 978–992, doi:10.1016/j.cageo.2007.12.003, 2009.
Hungr, O., Dawson, R., Kent, A., Campbell, D., and Morgenstern, N. R.: Rapid flow slides of coal-mine waste in British Columbia, Canada, in: Catastrophic Landslides: Effects, Occurrence, and Mechanisms, v. XV, edited by: Evans, S. G. and DeGraff, J. V., Geol. Soc. Am. Rev. Eng. Geol., 33, 191–208, 2002.
Hungr, O., Corominas, J., and Eberhardt, E.: Estimating landslide motion mechanism, travel distance and velocity, in: Landslide Risk Management, edited by: Hungr, O., Fell, R., Couture, R., and Eberhardt, E., Taylor & Francis Group, Vancouver, 99–128, 2005.
Hürlimann, M., Rickenmann, D., Medina, V., and Bateman, A.: Evaluation of approaches to calculate debris-flow pa-rameters for hazard assessment, Eng. Geol., 102, 152–163, doi:10.1016/j.enggeo.2008.03.012, 2008.
Iverson, R. M.: The physics of debris flows, Rev. Geophys., 35, 245–296, 1997.
Iverson, R. M.: The debris flow rheology myth, in: Proceedings of the 3rd International Conference on Debris flow Hazard Mitiga-tion: Mechanics, Prediction and Assessment, edited by: Ricken-mann, D. and Chen, C.-L., Davos, Millpress, Rotterdam, 303– 314, 2003.
Iverson, R. M. and Denlinger, R. P.: Flow of variably fluidized granular masses across three-dimensional terrain, 1. Coulomb mixture theory, J. Geophys. Res., 106, 537–552, doi:10.1029/2000JB900329, 2001.
Kaitna, R. and Rickenmann, D.: A new experimental facility for laboratory debris flow investigation, J. Hydraul. Res., 45, 797– 810, doi:10.1080/00221686.2007.9521817, 2007.
Kaitna, R., Rickenmann, D., and Schatzmann, M.: Determina-tion of rheologic informaDetermina-tion from laboratory experiments, Acta Geotech., 2, 71–85, 2007.
Kaitna, R., Dietrich, W. E., and Hsu, L.: Surface slopes, veloc-ity profiles and fluid pressure in coarse-grained debris flows saturated with water and mud, J. Fluid Mech., 741, 377–403, doi:10.1017/jfm.2013.675, 2014.
Kogelnig-Mayer, B., Stoffel, M., Schneuwly-Bollschweiler, M., Hübl, J., Rudolf-Miklau, F.: Possibilities and limitations of den-drogeomorphic time-series reconstructions on sites influenced by debris flows and frequent snow avalanche activity, Arct. Antarct. Alp. Res., 43, 649–658, 2011.
Körner, H. J.: Reichweite und Geschwindigkeit von Bergstürzen und Fliesslawinen, Rock Mech., 8, 225–256, 1976.
Legros, F.: The mobility of long-runout landslides, Eng. Geol., 63, 301–331, 2002.
Lipovsky, P. S., Evans, S. G., Clague, J. J., Hopkinson, C., Couture, R., Bobrowsky, P., Ekström, G., Demuth, M. N., Delaney, K. B., Roberts, N. J., Clarke, G., and Saeffer, A.: The July 2007 rock and ice avalanches at Mount Steele, St. Elias Mountains, Yukon, Canada, Landslides, 5, 445–455, doi:10.1007/s10346-008-0133-4, 2008.
Lucy, L. B.: A numerical approach to testing the fission hypothesis, Astron. J., 82, 1013–1024, 1977.
Major, J. J. and Pierson, T.: Debris flow rheology: experimental analysis of fine-grained slurries, Water Resour. Res., 28, 841– 857, doi:10.1029/91WR02834, 1992.
McDougall, S. and Hungr, O.: Modeling of landslides which entrain material from the path, Can. Geotech. J., 42, 1437–1448, 2005. McDougall, S., Boultbee, N., Hungr, O., Stead, D., and Schwab,
J. W.: The Zymoetz River landslide, British Columbia, Canada:description and dynamic analysis of a rock slide-debris flow, Landslides, 3, 195–204, doi:10.1007/s10346-006-0042-3, 2006.
Medina, V., Hürlimann, M., and Bateman, A.: Application of FLAT-Model, a 2D finite volume code, to debris flows in the north-eastern part of the Iberian Peninsula, Landslides, 5, 127–142, doi:10.1007/s10346-007-0102-3, 2008.
Monaghan, J. J.: On the problem of penetration in particle methods, J. Comput. Phys., 82, 1–15, doi:10.1016/0021-9991(89)90032-6, 1989.
Naef, D., Rickenmann, D., Rutschmann, P., and McArdell, B. W: Comparison of flow resistance relations for debris flows us-ing a one-dimensional finite element simulation model, Nat. Hazards Earth Syst. Sci., 6, 155–165, doi:10.5194/nhess-6-155-2006, 2006.
O’Brien, J. S., Julien, P. Y., and Fullerton, W. T.: Two-dimensional water flood and mudflow simulation, J. Hydraul. Eng., 119, 244– 261, doi:10.1061/(ASCE)0733-9429(1993)119:2(244), 1993. Pastor, M., Quecedo, M., Fernandez Merodo, J. A., Herrores,
M. I., Gonzalez, E., and Mira, P.: Modelling tailings dams and mine waste dumps failures, Geotechnique, 52, 579–591, doi:10.1680/geot.2002.52.8.579, 2002.
Phillips, C. J. and Davies, T. R. H.: Determining rheological param-eters of debris flow material, Geomorphology, 4, 101–110, 1991.
Pirulli, M., Scavia, C., and Hungr, O.: Determination of rock avalanche run-out parameters through back analyses, in: Land-slides: Evaluation and Stabilization, edited by: Lacerda, W. A., Ehrlich, M., Fontoura, S. A. B., and Sayao, A. S. F., Proceed-ings of the Ninth International Symposium on Landslides, June 28–July 2 2004, Taylor & Francis Group, Rio de Janeiro, Brazil, 1361–1366, doi:10.1201/b16816-194, 2004.
Preuth, T., Bartelt, P., Korup, O., and McArdell, B. W.: A random kinetic energy model for rock avalanches: eight case studies, J. Geophys. Res., 115, F03036, doi:10.1029/2009JF001640, 2010. Revellino, P., Hungr, O., Guadagno, F. M., and Evans, S. G.: Veloc-ity and runout simulation of destructive debris flows and debris avalanches in pyroclastic deposits, Campania region, Italy, Envi-ron. Geol., 45, 295–311, doi:10.1007/s00254-003-0885-z, 2004. Rickenmann, D.: Empirical relationships for debris flows, Nat.
Haz-ards, 19, 47–77, doi:10.1023/A:1008064220727, 1999. Rickenmann, D., Laigle, D., McArdel, B. W., and Hübl, J.:
Com-parison of 2D debris-flow simulation models with field events, Comput. Geosci., 10, 241–264, doi:10.1007/s10596-005-9021-3, 2006.
Savage, S. B. and Hutter, K.: The motion of a finite mass of granular material down a rough incline, J. Fluid Mech., 199, 177–215, doi:10.1017/S0022112089000340, 1989.
Scheidegger, A. E.: On the prediction of the reach and ve-locity of catastrophic landslides, Rock Mech., 5, 231–236, doi:10.1007/BF01301796, 1973.
Scheidl, C. and Rickenmann, D.: Empirical prediction of debris-flow mobility and deposition on fans, Earth Surf. Proc. Land., 35, 157–173, doi:10.1002/esp.1897, 2010.
Scheidl, C., Rickenmann, D., and McArdell, B. W.: Runout predic-tion of debris flows and similar mass movements, Landslide Sci. Pract., 3, 221–229, doi:10.1007/978-3-642-31310-3_30, 2013. Schneider, D., Bartelt, P., Caplan-Auerbach, J., Christen, M.,
Huggel, C., and McArdell, B. W.: Insights into rock-ice avalanche dynamics by combined analysis of seismic record-ings and a numerical avalanche model, J. Geophys. Res., 115, F04026, doi:10.1029/2010JF001734, 2010.
Schneider, D., Huggel, C., Haeberli, W., and Kaitna, R.: Unraveling driving factors for large rock–ice avalanche mobility, Earth Surf. Proc. Land., 36, 1948–1966, doi:10.1002/esp.2218, 2011. Schraml, K., Oismüller, M., Stoffel, M., Hübl, J., and Kaitna, R.:
Debris-flow activity in five adjacent gullies in a limestone moun-tain range, Geochronometria, 42, 60–66, doi:10.1515/geochr-2015-0007, 2015.
Sosio, R., Crosta, G. B., and Hungr, O.: Complete dy-namic modeling calibration for the Thurwieser rock avalanche (Italian Central Alps), Eng. Geol., 100, 11–26, doi:10.1016/j.enggeo.2008.02.012, 2008.
Takahashi, T.: Debris Flow, International Association for Hydraulic Research Monograph, A. A. Balkema, Rotterdam, 1991. Teich, M.: Snow avalanches in forested terrain, PhD thesis,
Depart-ment of Civil, EnvironDepart-mental and Geomatic Engineering, ETH Zurich, Switzerland, 2013.
Toro, E. F.: Riemann Solvers and Numerical Methods for Fluid Dy-namics, 2nd Edn., Springer-Verlag, Berlin, 1999.