3925
ANALYSIS OF PERFORMANCE OF
NON-GOVERNMENT MICROFINANCE INSTITUTIONS
IN ENTREPRENEURIAL DEVELOPMENT OF
WOMEN
Ram Milan, Dr. Noorul Hasan, Zaibun Nisa
Abstract- Non-Governmental Organization (NGOs), being in social developmental objective, have been playing important roles as facilitator or intermediary in microfinance movement in India. NGO-MFIs have been playing significant roles in supporting and nurturing SHGs (Self-help groups) by not only extending credit or other financial services to SHGs but also in many ways. Such NGOs do perform a commendable role in the development efforts in different capacities.The present paper aims to understand how non-government micro finance institutions (NGO-MFIs) in Uttar Pradesh function and operate the microfinance programmes. The major parameters considered for study of operational efficiency of non-government micro finance institutions are in terms of number of clients, Years in Microfinance, Management, Profitability and Sustainability of Operation. Non-Governmental Organisations for the purpose of this study include any organisation apart from government need not necessarily be a voluntary organisation.
Index Terms: financial services, microfinance, Non-Governmental Organization, Self-help groups, Sustainability, Social developmental
————————————————————
1.
INTRODUCTION
Advancia International Seminar on NGO and Entrepreneurship (2008) observed that entrepreneurs are actors that combine innovation with rapid growth and risk taking. A social entrepreneur brings innovative solutions to persistent social problems. Social entrepreneurship articulates the fuelling of a sustainable entrepreneurial spirit and the search for solutions (in the products, the processes, the positioning and the paradigms of the organization) to establish a balance between economic profits and the respect for social, environmental, cultural, and spiritual ecosystems. As social entrepreneurs, NGOs can contribute to more equitable and rights-based approaches to globalization by developing models that balance profit and non-profit objectives. NGOs can advance respect for human rights and corporate social responsibility by engaging large corporations as well as small and medium enterprises in entrepreneurial initiatives that benefit social and humanitarian causes. Entrepreneurship has different implications for NGOs depending on the size and scope of the organization. The seminar generally approved that Entrepreneurship could become a shared value for both NGOs and for Private Sector. The international seminar further established that there existed few limitations for NGOs in their pursuits. A major limitation put forth was that when NGOs become large and established organizations there is less ability to take on entrepreneurial projects.
---
Prof. Ram Milan is currently placed as HOD, Dept. of Commerce, University of Lucknow, India, PH-9453024425
Dr. Noorul Hasan is currently working as Associate professor, Shia P.G. College, University of Lucknow, PH-9936420813, E-mail- ambarprakashan@gmail.com
Zaibun Nisa is currently pursuing PhD. from Dept. of Commerce, University of Lucknow, India, PH -9936667120, E-mail-zaibunrizvi@gmail.com
Further, both the private sector and NGOs experience a tension between control and creativity. Regarding the standardization of the managerial processes of NGOs, transparency and accountability, as organizations, NGOs present striking differences when compared with for profit organizations. In addition to these,NGOs need specific types of management that are adapted to the social, cultural, ethical dimensions of their work, and that take into account the international and local operational needs
2.
LITERATURE REVIEW
3926
significant criticism. Achtenhagen, L., Naldi, L., & Melin, L., (2010) , outline the difficulty of including all the different stakeholders views on growth and how this leads to an overly broad definition, legitimizing the question of, do practitioners and scholars really talk about the same thing? Related concerns could be whether such a broad view could be measured quantitatively? Yet another question would be if it is relevant to use excessively aggregated yardsticks, such as sales, to capture growth for all stakeholders simultaneously. McKelvie, A., & Wiklund, J. (2010), identified at least five different explanations as to why the results of this approach are limited. They argue that the problem is based in the heterogeneity of the object and the following areas are identified (i) unit of analysis (ii) differences in modes of growth (iii) variation in growth rates over time (iv) indicators of growth and not taking account of differences in the willingness to grow. This increased attention is long overdue. Too often, entrepreneurial efforts by women have gone unnoticed, and their contributions have been underappreciated. In a way, this is because, women‘s business ventures, particularly those in less developed countries, function more in the informal rather than formal economy (Welter, F., 2007).In the article on measuring women’s empowerment, Kabeer, N. (2000) suggests a key element of empowerment which is the ability to make choices. Kabeer qualifies his argument by suggesting that there are three interrelated dimensions required for women to be empowered to make decisions in their lives that are- access to resources, including preconditions; agency, including process; and achievements, including outcomes.
3.
RESEARCH METHODOLOGY
The overview of the performance of non-government micro finance institutions in Uttar Pradesh in the present study is based on the primary data collected by researcher by personally visiting the functional offices of MFIs. The analysis is based on primary data collected through pre-constructed questionnaire and the secondary data provided by the micro finance organisations such as their publications, internal report, balance sheet and information are also gathered from the websites of the Micro finance institutions. Finally, the common strength and weaknesses of these non-government micro finance institutions are also highlighted in this paper.
4.
OBJECTIVES OF THE STUDY:
To understand how non-government micro finance institutions (NGO-MFIs) in Uttar Pradesh function and operate the microfinance programmes
to identify the limitations of non-government micro finance institutions (NGO-MFIs) operating in Uttar Pradesh
To identify the strengths of non-government micro finance institutions (NGO-MFIs) operating in Uttar Pradesh
5.
ANALYSIS OF PERFORMANCE OF
NON-GOVERNMENT
MICROFINANCE
INSTITUTIONS (NGO-MFIS)
A significant improvement in the outreach of microfinance has occurred in Uttar Pradesh in last couple of decades due
to promotion programme by NABARD and by government promotional schemes encouraging micro entrepreneurship. The non-government micro finance institutions too emerged recently in the state. The researcher observed from the study that though there are number of such organisations functioning in state there are rare organisations actively fulfilling the core objective of these organisations. Rest of the organisations are only extending credit provided by government schemes launched time to time. As there is no regular funding to these organisations in the state, the organisations bound to restrict their activities. The present chapter will focus on the efficiency of the selected non-government organisations actively involved in microfinance. Client outreach measures the number of clients, target clients and geographical coverage of its microfinance operation whereas portfolio growth measures loan portfolio outstanding, average loan outstanding per borrower, loan disbursement, depth of client outreach
5.1.Number of years of experience in microfinance Table 1; Years of experience in microfinance
Source: Primary Data
Majority of the sample non-government micro finance institutions had experience of microfinance for less than 20 years indicating microfinance activities were recent developmental activities taken up by these NGOs especially after the NABARD initiative in year 2000. Microfinance operation is relatively new in urban area in Uttar Pradesh as compared to rural area. It is due to the focus of government on the development of rural areas.
5.2: Coverage of Villages by non-government microfinance institutions
The core objective of microfinance programme is the financial inclusion of those living in remote areas where banking and credit facilities are inaccessible. The geographical coverage of microfinance institutions is measured in terms of village covered.
Locality of MFIs
No. of MFIs Average Age of MFIs
Average Age in Microfinance
Rural 4 19.3 13.75
Urban 3 17.5 11.6
3927
Source: Primary Data
Fig. 1; Average age of MFI & Villages covered
The study revealed that the non-government organisations that are working in rural area having more years in microfinance have more coverage of villages whereas MFIs located in urban areas have lesser coverage to villages. This can be concluded that initiatives must be taken to encourage MFIs to operate in rural areas to have better coverage to remote areas.
5.3. Relationship between years in microfinance and geographical coverage of non-government microfinance institutions
It is generally believed that there is a positive relationship between number of years in micro finance and the geographical coverage. To verify the statement hypothesis is formulated and statistical tool is utilised.
Hypothesis Testing:
Null Hypothesis (H0): There is no linkage between years of microfinance and geographical coverage of microfinance institutions.
Alternate Hypothesis (Ha): There is a linkage between years of microfinance and geographical coverage of microfinance institutions.
Table 3; Correlation between age in microfinance & geographical coverage
Pearson co-efficient of correlation (r)
Sig. (2 tailed)
.603 .205
Statistical tool used: IBM SPSS (v. 20)
This can be analysed from the above table that there exists positive correlation between years in microfinance and geographical coverage of microfinance institutions. The value of pearson co-efficient of correlation at 0.05 level of significance is 0.603 is significant. Hence, null hypothesis rejected, and alternate hypothesis accepted.
5.4; Number of groups formed by Non-Government Microfinance Institutions
The majority of the non-government microfinance institutions considered for the present study are involved in group lending 280 (93.3 percent).
Table 4; Frequency Distribution of groups formed by MFI
N %
>1500 2 28.6
3000-5000 1 14.3
5000-8000 3 42.9
above 1 14.3
Total 7 100.0
Source: Primary Data
This can be observed from the above table and fig. that majority of microfinance institutions are successful in forming large number of groups. The microfinance institutions located in rural area and are operating for longer period of time formed more groups. This is because beneficiaries’ shows more trust towards MFIs working since long than MFIs newly stablished.
5.5; Number of Active Borrowers by Non-Government Microfinance Institutions
It is one of the important parameters to measure the client outreach and growth for MFIs. It measures the number of clients who are actively participated in its microfinance programme and availed various facilities and services offered by the MFIs.
Table 5. Frequency Distribution of number of active borrowers
Frequency Percent Valid Percent Cumulative Percent
>10000 1 14.3 14.3 14.3
10000-30000 2 28.6 28.6 42.9
60000-150000 2 28.6 28.6 71.4
above 2 28.6 28.6 100.0
Total 7 100.0 100.0
Source: Primary Data
The above table and figure show that only 28.6 percent (above 150000) active borrowers of microfinance that is far behind than the requirement of state of Uttar Pradesh. It is
0 100 200 300 400 500 600 700 800 900
Rural Urban Total
Average Age of MFIs
Average Villages Covered
Locality of MFIs
No. of MFIs Average Age of MFIs
Average Villages Covered
Rural 4 19.3 556.25
Urban 3 17.5 226.67
3928
also observed that a non-banking financial corporation (NSFC) is more active in disbursement of loan amount and in formation of groups in urban and rural areas.
5.6. Relationship between years in microfinance and number of active borrowers of non-government microfinance institutions
Number of active clients generally increases with the increase in scale of operation of the MFIs over the period of years. It is generally believed that there is a positive relationship between number of years in micro finance and the geographical coverage. To verify the statement hypothesis is formulated and statistical tool is utilised.
Table 6; Frequency Distribution of years in MFI & Active Borrowers
Source: Primary Data
Fig.2; Average age of MFI & Active Borrowers
The above table and figure show that MFIs operating at rural area have wider coverage and have more active borrowers who are benefitting from the microfinance and other programmes of non-government microfinance institutions whereas relationship between average ages of MFI in urban area is not so significant. The overall average show positive relation between age and number of active borrowers of microfinance. Further the statement is verified with the intervention of statistical tool.
Hypothesis Testing:
Null Hypothesis (H0): There is no linkage between years of microfinance and number of active borrowers of microfinance institutions.
Alternate Hypothesis (Ha): There is a linkage between years of microfinance and number of active borrowers of microfinance institutions.
Table 7; Correlation between age in microfinance & active borrowers
Pearson co-efficient of correlation (r)
.952
Sig. (2 tailed) 0.000*
Statistical tool used: IBM SPSS (v. 20)
This can be analysed from the above table that their high positive correlation between years in microfinance and geographical coverage of microfinance institutions. The value of Pearson co-efficient of correlation at 0.05 level of significance is 0.952 is significant. Hence, null hypothesis rejected, and alternate hypothesis accepted.
5.7.Average loan disbursement
Extending micro credit is most important activity of microfinance enterprise. So it is considered important to evaluate efficiency of microfinance enterprise. The microfinance institutions’ growth is determined with the increase in loan disbursement.
Table 8; Average loan disbursement
Source: Primary Data
The above figure and table show that on an average loan disbursement in rural area are 15.198 that is higher than the loan disbursement in urban area that is 7.90 lacs. The higher loan disbursement in rural areas is due lack of access to formal banking system.
Table 9; Frequency distribution of avg. loan outstanding per MFI
Source: Primary Data
The above table revealed that most of the microfinance institutions have loan disbursement less than 10 Lacs. Only one each (14.29 percent) has more than 20 lacs and 30 lacs. The individual analysis of microfinance institution shows that loan disbursement of non-banking financial institutions is highest among other microfinance institutions due to its wider outreach and aggressive lending.
0 5 10 15 20 25 30 35 40 45 50
Rural Urban Total
Active Borrowers (in Lacs)
Age of MFIs (in Yrs) Locality of
MFIs
No. of MFIs
Age of MFIs (in Yrs.)
Active Borrowers (in Lacs)
Rural 4 19.3 5.292
Urban 3 17.5 2.525
Total 7 36.8 7.817
Locality of MFIs
No. of MFIs Age of MFIs Avg. loan disbursement
(lacs)
Rural 4 19.3 15.198
Urban 3 17.5 7.90
Total 7 36.8 11.549
loan disbursement N Percentage Less than 10 lacs 3 42.85
10-20 lacs 2 28.57
20-30 lacs 1 14.29
More than 30 lacs 1 14.29
3929
5.8.Relationship between loan disbursement and number of active borrowers
Microfinance institutions having more loan disbursement have more active borrowers as compare to microfinance institutions having low loan disbursement. This shows there must be some relationship exist between loan disbursement and number of active borrowers.
Table 10; Loan disbursement VS no. of active buyers
Source: Primary Data
The above table shows that microfinance institutions having more loan disbursement have more active buyers. Further statistical tool is utilised to verify the result.
Null Hypothesis (H0): There is no linkage between number of active borrowers and loan disbursement of microfinance institutions.
Alternate Hypothesis (Ha): There is a linkage between number of active borrowers and loan disbursement of microfinance institutions.
Table 11; Correlation between number of active borrowers & loan disbursement
Pearson co-efficient of correlation (r)
Sig. (2 tailed)
-.203 .700
Statistical tool used: IBM SPSS (v. 20)
Pearson correlation analysis shows that co-efficient of correlation (r) is -.203 and the significant value is .700.Therefore, null hypothesis is accepted and alternative hypothesis is rejected. Thus, there is no significant relationship between loan disbursement and number of active borrowers.
5.9. Relationship between loan disbursement and number of years in microfinance
It is observed the more years of experience in microfinance increases disbursement of more funds. This section of the chapter tries to study the relationship between years in microfinance and loan disbursement.
Table 12; years of microfinance & loan disbursement
Source: Primary Data
The above table shows that the average age in microfinance (approx.)19 years have loan disbursement 15 Lacs and the MFI have 17 years of average age in microfinance has loan disbursement 7.90 Lacs. Further statistical tool is utilised to verify the result and hypothesis being formulated.
Null Hypothesis (H0): There is no linkage between years of microfinance and loan disbursement of microfinance institutions.
Alternate Hypothesis (Ha): There is a linkage between years of microfinance and loan disbursement of microfinance institutions
Table 13; Correlation between years in microfinance & loan disbursement
Pearson co-efficient of correlation (r)
Sig. (2 tailed)
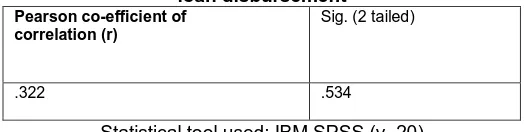
.322 .534
Statistical tool used: IBM SPSS (v. 20)
Pearson correlation analysis shows that co-efficient of correlation (r) is 0.322 and is found not significant at 0.05 level There, null hypothesis is accepted, and alternative hypothesis is rejected. There is no significant relationship between years in microfinance and loan disbursement.
5.10. Savings
The other factor worth considering in analysing the efficiency of non-government microfinance institutions is mode of saving. Saving is considered as one of the most important elements of all microfinance programme. Most of the microfinance institutions mobilise savings from the members in some or the other form. Some collect it as security against the loan disbursed. Most microfinance institutions considered for the study mobilise the savings but provides the authority to manage the savings to the members of self-help group itself except NBFC (non-banking financial corporations) which collects savings @ ₹5 per day and keep the record with itself.
Table 14: Saving Mobilisation of MFIs
Saving Mobilisation Frequency Percent
compulsory 5 71.428
optional 2 28.57
Total 7 100.0
Source: Primary Data
The above table and figure show that mobilisation of saving as an essential feature of microfinance institutions. In most of the institutions 71.428 percent saving is compulsory for are members whereas only 28.57 percent of microfinance institutions considered for study made savings optional for its members.
5.11. Support Services Provided by Non-Government Microfinance Institutions
Non-government institutions are known for providing services for the upliftment of beneficiaries economically as
Locality of MFIs
No. of MFIs Age of MFIs Active Borrowers
Loan disbursement
(in lacs)
Rural 4 19.3 529,200 15.198
Urban 3 17.5 252,500 7.90
Total 7 36.8 781,700 11.549
Locality of MFIs
No. of MFIs Age of MFIs Avg. Loan disbursement (in lacs)
Rural 4 19.3 15.198
Urban 3 17.5 7.90
3930
well as socially. Services provided by these institutions are considered as criteria for judging their efficiency.
Table 15; Frequency distribution of support services provided by MFI
Source: Primary Data
From the above table it is clearly visible that all of the non-government microfinance institutions considered for the present study provide assistance in creating awareness among the beneficiaries thus contributing in women empowerment and sustainable development. All of the MFIs also provide knowledge of bookkeeping and accountancy to the members that are an essential skill for entrepreneurship. Around 85.71 percent of the MFIs also provide services of counselling & guidance and marketing to the members. Whereas few MFIs provide all of the support services to the members considered relevant for the entrepreneurial development of the members.
5.12. Major Functional Areas of Non-Government Microfinance Institutions
Microfinance institutions aim at extending credit to the eligible, economic productive candidates for income generation. Non-government institutions entered in microfinance sector recently believed to be better performer at microfinance arena as they can better identify the eligible candidates and can ensure the proper utilisation of the funds.
Table 16; Frequency distribution of Functional Areas of MFI
Functional Areas N Percentage Microfinance
operation
2 28.57
Development Activities
7 100
Resource Mobilisation 6 85.71
Health Care 1 14.28
Education/Literacy 2 28.57
Networking 6 85.71
Enterprise Development
7 100
Source: Primary Data
The above table shows that only 28.57 percent of the non-government microfinance institutions considered microfinance as their major functional area. It can be analysed that the non-government institutions still consider other aspects as major functional area and microfinance need to be promoted among non-government microfinance institutions.
5.13. Distance from bank
Nearness of MFIs to the bank facilitates better lending and linkage of self-help groups to the banks. The operational efficiency of MFIs is depend on its nearness to banking institutions.
Table 17: Distance from Bank of MFIs
Distance from Bank Frequency Percent
less than 1 km 6 85.7
1-2 km 1 14.3
More than 2 km -- --
Total 7 100.0
Source: Primary Data
The above table shows that most that most of the MFIs are located near the bank, 85.7 percent of MFIs are located within the 1 km from the bank. Only 14.3 percent MFI is located within 2 km distance from the bank. Hence it can be analysed that nearness to banking system is important and facilitates in functioning of MFIs.
5.14. Rating of Non-government Microfinance Institutions
The rating of microfinance institutions is must in order to ensure the proper functioning of these organisations. Some of the rating agencies that rated microfinance institutions considered under the study are; CRS (comprehensive ranking system), Guide Star, Bridge (U.K based rating agency), Brickwork rating agency, RPL (Recreation of prior learning certificate of Ministry of HRD, Pradhan and TATA
Table18: Rating of MFIs
Rating of MFIs Frequency Percent
yes 6 85.7
no 1 14.3
Total 7 100
Source: Primary Data
The above table shows that most of the MFIs (85.7 percent) are rated by rating agency. This shows that microfinance institutions functioning at the selected districts of Uttar Pradesh are credible and rated satisfactory by the rating agencies for their performance. Most of the MFIs are rated by more than one agency as they are also indulge in many other activities of social upliftment and equality besides microfinance.
6.
KEY FINDINGS:
Number of years of experience in microfinance: Majority of the sample non-government micro finance institutions had experience of microfinance for less than 15 years indicating microfinance activities were recent developmental activities taken up by these NGOs. Microfinance operation is relatively new in rural area as compared to urban area.
Coverage of Villages by non-government microfinance institutions: non-government organisations working in rural area having more years in microfinance have more coverage of
Support Services N Percentage Mgt. & leadership 3 42.85
Bookkeeping & Accounts
7 100
Counselling & Guidance
6 85.71
Skill & EDP 5 71.42 Access to raw
material
2 28.57
Marketing 6 85.71
3931
villages whereas MFIs located in urban areas have lesser coverage to villages.
Relationship between years in microfinance and geographical coverage of non-government microfinance institutions: There exists high positive correlation between years in microfinance and geographical coverage of microfinance institutions. The value of Pearson co-efficient of correlation at 0.05 level of significance is 0.792 is significant.
Number of groups formed by Non-Government Microfinance Institutions: Majority of microfinance institutions are successful in forming large number of groups. The microfinance institutions located in rural area and are operating for longer period of time formed more groups. This is because beneficiaries’ shows more trust towards MFIs working since long than MFIs newly stablished.
Number of Active Borrowers by Non-Government Microfinance Institutions: Active borrowers of microfinance programme more than 150,000 is restricted to around 28 percent, that is far behind than the requirement of state of Uttar Pradesh. It is also observed that a non-banking financial corporation (NSFC) is more active in disbursement of loan amount and formation of groups in urban and rural areas.
Relationship between years in microfinance and number of active borrowers of non-government microfinance institutions: There exists positive correlation between years in microfinance and geographical coverage of microfinance institutions. The value of Pearson co-efficient of correlation at 0.05 level of significance is 0.952 is significant.
Average loan disbursement: Most of the microfinance institutions have loan disbursement less than 10 Lacs. Only one each (14.29 percent) has more than 20 lacs and 30 lacs. The individual analysis of microfinance institution shows that loan disbursement of non-banking financial institutions is highest among other microfinance institutions due to its wider outreach and aggressive lending.
Relationship between loan disbursement and number of active borrowers: Pearson correlation analysis shows that coefficient of correlation (r) is -.203 and the significant value is .700. Thus, there is no significant relationship between loan disbursement and number of active borrowers.
Relationship between loan disbursement and number of years in microfinance: Pearson correlation analysis shows that co-efficient of correlation (r) is not significant at 0 05 level. The hypothesis didn’t support the finding that there is no significant relationship between loan disbursement and number of years in microfinance.
Savings: Mobilisation of saving as an essential feature of microfinance institutions. In most of the institutions 71.428 percent saving is compulsory for are members whereas only 28.57 percent of microfinance institutions considered for study made savings optional for its members.
Support Services Provided by Non-Government Microfinance Institutions: All of the non-government microfinance institutions considered for the present study provide assistance in creating awareness among the beneficiaries thus contributing in women empowerment and sustainable development.
Major Functional Areas of Non-Government Microfinance Institutions: The non-government microfinance institutions do not consider microfinance as their major functional area. The non-government institutions still consider other aspects as major functional area and microfinance need to be promoted among non-government microfinance institutions.
Distance from bank: Most of the MFIs are located near the bank, 85.7 percent of MFIs are located within the 1 km from the bank. Only 14.3 percent MFI is located within 2 km distance from the bank.
Rating of Non-government Microfinance Institutions: The microfinance institutions functioning at the selected districts of Uttar Pradesh are credible and rated satisfactory by the rating agencies for their performance.
7.
BOTTLENECKS IN THE FUNCTIONING OF
NON-GOVERNMENT
MICROFINANCE
INSTITUTION AT UTTAR PRADESH:
The major bottlenecks on the way of entrepreneurial development of the women at Uttar Pradesh are the attitude of society, availability of resources at rural level and attitude of women herself etc. The personal interview conducted with the staff and management of microfinance institutions reveals the fact that:
Rural areas of Uttar Pradesh don’t have resources to generate income. The women of self-help groups contribute their savings but unable to utilise them in productive manner. Most of the funding from government issued for SHGs are being utilised for fulfilling personal liabilities instead of generating income.
The attitude of society towards women entrepreneurship is not positive. Though with the effort of non-government institutions people are changing their attitude but still there is lack of confidence of the skills of women.
The monthly family income of members ranges from 4000-5000 in rural areas with around 7-9 members in family. The insufficiency to earn decent livelihood is the root cause of all the issues. As most of the finance generated for entrepreneurial activities are either utilised by the male members of the family or for fulfilling personal liabilities.
Change of government at state changes the priorities of the government that badly affected the microfinance sector in disbursement of funds to the members. Irregular supply of funds ceases the flow of work. Hence, discourages the establishment of micro enterprise.
3932
in managing activities of these organisations without proper supply of finances.
8.
MAJOR
STRENGTHS
OF
NON-GOVERNMENT
MICROFINANCE
INSTITUTIONS AT UTTAR PRADESH
The non-government microfinance institutions considered for the study from the selected cities of Uttar Pradesh found to have some strength:
Most of the non-government microfinance institutions are involved in microfinance for the long period of time and their operational areas is same throughout the period. Society shows great level of trust and confidence in these organisations.
Most of the non-government institutions are have strong linkage with international agencies that support their activities.
Most non-government institutions have strong network of staff and hold regular meetings in order to ensure proper functioning of MFIs.
Besides microfinance most MFIs have elaborate experience of social development of people. So, they better understand the need of the members. They better identify eligible borrower and support in sustainable development.
9.
CONCLUSION
The overall conclusions from the study are that non-government institutions have the potential to improve the situation of women through rising awareness regarding income generation, advocacy and through imparting skill training. But according to the studied non-government microfinance institutions the responsibility also lies with the Government agencies and policy makers, which right now does not do enough when it comes to women empowerment, poverty elimination and entrepreneurial development. The government need to focus attention towards development of resources of income generation at rural level. The need of the hour is government and non-government institutions should work together and complement each other for the achievement of common goal of sustainable development and poverty elimination.
REFERENCES:
[1] Advancia International Seminar on NGO and Entrepreneurship, retrieved from http://www.un.org/dpi/ngosection/annualconfs/61/p dfs/FINAL_Report, 2008
[2] Goel,G., & Rishi,M., ‘Promoting Entrepreneurship To Alleviate Poverty In India: An Overview Of Government Schemes, Private-Sector Programmes, And Initiatives In The Citizens’ Sector’, Thunderbird International Business Review, 54(1), 45-57.Doi: 10.1002/Tie.21437, 2012.
[3] Veira, X., ‘A Comparison Between Female and Male Entrepreneurs in the Perspective of Gender Equality and Empowerment of Women, The Third Goal on the List of Millennium Development Goals’, Global Watch, 3(1), 95-99. Retrieved From Http://Search.Proquest.Com/Docview/224688819? Accountid=31551, 2008.
[4] Martinez, R. J., ‘Competitive Conformity Effects on Performance: Entrepreneurship and Radicality in Firms’ Competitive Profiles’, Proquest Dissertations and Theses, 147-147 P. Retrieved from Http://Search.Proquest.Com/Docview/304768013? Accountid=31551. (304768013),2001.
[5] Tripathy, U., & Padhi, P., ‘Socio-Economic Conditions of Self-Help Groups: A Study on Litimunda Village of Sambalpur District’, International Journal of Business Management & Economic Research, 3(5), 305-321, 2011.
[6] Achtenhagen, L., L. Naldi, and L. Melin, ―Business Growth- Do Practitioners and Scholars really talk about the same thing? Entrepreneurship Theory and Practice, 34 (2), 289–316, 2010.
[7] Mckelvie, A., & Wiklund, J., ‘Advancing Firm Growth Research: A Focus on Growth Mode Instead of Growth Rate’, Entrepreneurship: Theory & Practice, 34(2), 261-288. Doi:10.1111/J.1540-6520.2010. 00375.X, 2010.
[8] Welter, F., ‘Handbook of Entrepreneurship Research: Interdisciplinary Perspectives’, International Entrepreneurship and Management Journal, 3(2), 243-246, 2007.
[9] Kabeer, N., ‘Inter-Generational Contracts, Demographic Transitions and the Quantity-Quality Trade off: Parents, Children and Investing in the Future’, Journal of International Development, 12(4), 463. Retrieved from Http://Search.Proquest.Com/Docview/214876158? Accountid=31551,2000.