http://www.sciencepublishinggroup.com/j/hyd doi: 10.11648/j.hyd.20190704.12
ISSN: 2330-7609 (Print); ISSN: 2330-7617 (Online)
Development of a Water Allocation Model for Equitable
Water Distribution at Doho Rice Irrigation Scheme, Uganda
Erion Bwambale
1, *, Patrick Gathogo Home
2, James Messo Raude
2, Joshua Wanyama
31
Civil Engineering Department, Technology, and Innovation (PAUISTI), Pan African University Institute for Basic Sciences, Nairobi, Kenya
2
Soil, Water and Environmental Engineering Department, Jomo Kenyatta University of Agriculture and Technology (JKUAT), Nairobi, Kenya
3
Agricultural and Bio-Systems Engineering Department, Makerere University, Kampala, Uganda
Email address:
*
Corresponding author
To cite this article:
Erion Bwambale, Patrick Gathogo Home, James Messo Raude, Joshua Wanyama. Development of a Water Allocation Model for Equitable Water Distribution at Doho Rice Irrigation Scheme, Uganda. Hydrology. Vol. 7, No. 4, 2019, pp. 62-69. doi: 10.11648/j.hyd.20190704.12
Received: October 6, 2019; Accepted: January 2, 2020; Published: January 16, 2020
Abstract: The shortage of irrigation water at the tail reaches of Doho Rice Irrigation Scheme especially in the dry season has
resulted in decreased rice production. At Doho Rice Irrigation Scheme, water distribution follows a predetermined rotation system where allocated supplies are unknown and the farmer decides how much water they divert to their plot. This has resulted in water inequalities between the tail end and head end blocks of the scheme. The main objective of the study was to develop a water allocation model for equitable distribution of irrigation water taking into account crop growth stages. This study developed an equitable water allocation model by ensuring that the crop water requirements per block are matched with the available supply in the main canal. A water delivery scheduling model was developed to help deliver the decadal irrigation water requirements by grouping different blocks together. The water allocation model gives required irrigation supplies and recommended supplies depending on the crop growth stage and acreage per block. The results from the water delivery scheduling model suggest a 2 days of irrigation per week for the land preparation, development and late seasons and 3 days of irrigation per decade during the high consumptive stages of initial and midseason stages of rice development.Keywords: Equitable, Irrigation, Model, Schedule, Seepage
1. Introduction
Water development and irrigation are necessary to increase food security and to reduce the variability of food production in most food-deficit countries [1]. However, the irrigation potential in these food deficit countries has not yet been fully exploited. As the world population increases, the demand for food is increasing exponentially which calls for sustainable water resources and irrigation development [2]. Sustainable irrigation development requires scientific allocation of water both among sectors and at field level. Despite of the high quantity of rainfall experienced in Uganda, there is wide spatial and temporal variability [3]. This has resulted into flooding of irrigation schemes and water scarcity during the rain and dry seasons respectively. This has a prolonged effect on the farming communities in Uganda since water shortages
are widely spread in most parts of the country causing severe yield reduction and often total crop failure [4].
conditions, ponding water depth, acreage of the blocks and water conveyance losses.
Research carried out by [5, 7, 8] at Doho Rice Irrigation Scheme reveals inadequate irrigation supplies and poor water allocation methods. However, authors do not go further to suggest better water allocation methods for equitable water distribution. Several studies have been carried out in regard to water allocation modelling in other irrigation schemes. [9] developed the MIGRAD model to interpret water allocation patterns in the intensive agricultural district of Southern Italy, supplied by both groundwater and surface water with variable costs and specific operation. This model, however, considers two water sources that are used to come up with a decision support system. [10] developed a water allocation model to predict and allocate the available water resources equitably and more efficiently for a paddy irrigation scheme in Malaysia. However, this cannot be applicable to Doho Rice Irrigation Scheme in its current state due to the fact that it requires some level of automation.
The study addresses these gaps by developing a water allocation model derived from crop production function taking into consideration of the site conditions, crop growth stages, canal capacity and block acreage. The specific objectives were;
i. To develop a water allocation model for equitable water distribution among the blocks.
ii.To develop an irrigation scheduling model.
2. Materials and Methods
2.1. Description of the Study Area
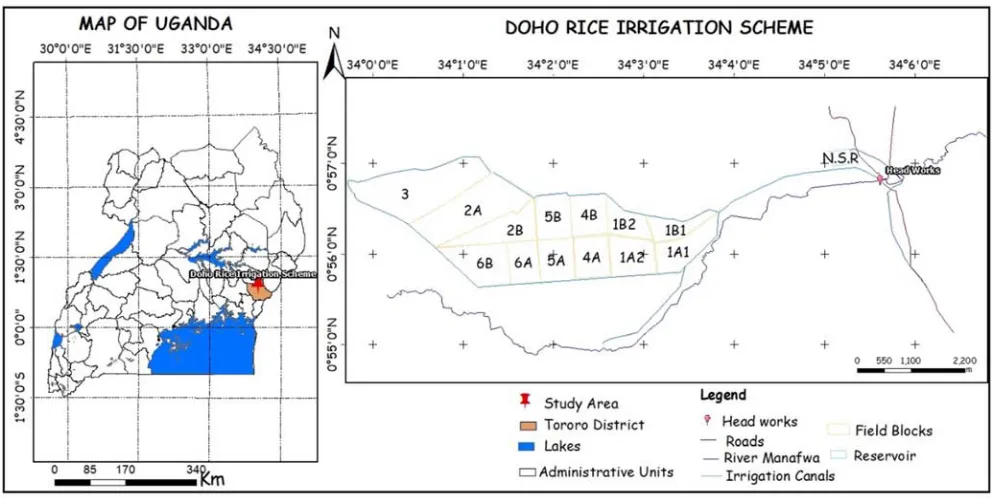
Doho Rice Irrigation Scheme is situated in both Mazimasa and Kachonga Sub-Counties of East Bunyole County in Butaleja District of Uganda as shown in Figure 1. It is located at Longitude 34°02’ East of the Greenwich and Latitude 0°56’ North of the Equator on the right bank of Manafwa River. It is found within a range of 49 km away from Tororo, 25 km away from Mbale and 260 km away from Kampala. Rice is the main crop grown at Doho Rice Irrigation Scheme with a gross area of 2500 acres of which only 2380 Acres are cultivated and the 120 Acres is covered by some irrigation infrastructure like farm roads, embankment, water conveyance channels, and b210l99 ridges. The scheme is partitioned into 11 main blocks namely: 1A, 1B, 2A, 2B, 3, 4A, 4B, 5A, 5B, 6A, and 6B. This division was made to create administrative units purposely to ease management during water distribution [6]. The main channel which is unlined conveys irrigation water from River Manafwa to the scheme. It then branches out into 2 secondary canals, the Southern canal, and the Northern canal. The northern canal also acts as a drainage channel for wastewater from the blocks and serves tail end blocks. From the secondary canals, water is conveyed through lateral canals and then to the blocks. After flowing through the paddy fields, water is collected in the main drainage channel through the tertiary and sub-drainage channels and drained back into River Manafwa [6].
Figure 1. Study area.
2.2. Development of the Water Allocation Model
To achieve equity in water distribution, it is essential to understand the crop water need at different crop stages within
given irrigation cycle. To ensure equity in water allocation in situations of water scarcity, an optimization model was developed derived from the crop production function [11]. The model has an objective function and a set of constraints. The objective is to minimize water shortage on a given day while ensuring equity of water distribution.
2.2.1. Water Allocation Model Formulation
Yield response to water can be expressed as shown in Equation 1 [11].
1 a y 1 a
x x y ET K y ET − = −
(1)
Where:
a
y =actual yields (Kg/ha)
x
y =maximum yields (Kg/ha)
a
ET =actual evapotranspiration (mm/day)
x
ET =maximum evapotranspiration (mm/day)
y
K =yield response factor
By replacing a x ET
ET with the ratio of supplied water to potential water need, then the crop function becomes and squaring both sides gives Equation 2
2 2
2
1 a y 1 s
x d y Q K y Q − = −
(2)
Where:
d
Q =water demand for a lateral canal i (m3/s)
s
Q =water supply to the lateral canal i (m3/s)
For maximum crop yields, the difference between the crop water requirements and the water supplied needs to be minimal. If the crop response factor Ky =1.0, Equation 1
becomes a water allocation function in which the objective is to meet crop water requirements with equity in the system. The water allocation function can be expressed as shown in Equation 3
minimize
(
)
2 1 n d s d i Q Q f Q = −
=
∑
(3)Where:
d
Q =water demand for a lateral canal i (m3/s)
s
Q =water supply to the lateral canal i (m3/s) i=index for lateral canals
This optimization model is subject to constraints namely: Water availability constraint, water supply constraint, canal capacity constraint, pond water constraint and the non- negativity constraint.
Water availability constraint
The total allocated water supply to all lateral canals on a certain day cannot be more than the available water supply in
the main canal on that day. This constraint is represented in Equation 4. 1 n s m i Q Q = ≤
∑
(4)Where:
s
Q =water supply in the lateral canal i, (m3/s)
m
Q =available discharge in the main canal on day j, (m3/s)
Water supply constraint
Water supplied to the lateral canals must correspond to the crop requirements of the blocks served by the lateral canal. This is represented using Equation 5
s d
Q ≤Q (5)
Canal capacity constraint
The allocated flow to a canal must not exceed its design capacity as shown in Equation 6
s D
Q ≤Q (6)
Where:
D
Q =design capacity of the tertiary canal i, (m3/s)
s
Q =water supply in the lateral canal i, (m3/s)
Ponding depth constraint
A minimum depth of standing water needs to be maintained in the rice fields and this is represented using Equation 7.
This is expressed as
max
0≤PDj ≤PD (7)
Where:
j
PD =ponding depth on day j (mm)
max
PD =maximum ponding depth (mm) Non-negativity Constraint.
The non-negativity constraint takes care of the fact that supplies in the lateral canals and the irrigation water demand should always be a positive value. This is represented in Equation 8.
, 0
s d
Q Q ≥ (8)
The irrigation demand for the lateral canals are estimated from the crop-water requirement, the command area, and system efficiency as shown in Equation 9
* 86.4 i i d a IR A Q E
= (9)
Where:
i
IR =crop water requirement in the command area under tertiary canal i (mm/day)
i
A =command area under tertiary canal i, (hm2)
a
86.4 = conversion factor.
The combined optimization model after combining Equation 3 and Equation 9 gives Equation 10.
Minimize
(
)
2
86.4* * *
86.4* * *
i i s a
i i a
IR A Q E
Z
IR A E
−
= (10)
Subject to:
1
n
s m
i
Q Q
=
≤
∑
s d
Q ≤Q Qs≤QD
max
0≤PDj ≤PD Q Qs, d ≥0
The Irrigation water requirement was determined from the paddy field water balance model as seen in Equation 11.
j j 1 j j j j j
PD =PD− +IR+RF −ET−SP−DR (11)
Where:
PDj = depth of water in the paddy field at the end of the
period, (mm)
PDj -1 = depth of water in the paddy field at the beginning
of a period, (mm)
IRj = depth of diversion of irrigation water supply during
the period, (mm)
RFj = rainfall during the irrigation period, (mm)
ETj = evapotranspiration from the paddy field during the
period, mm.
SPj = average seepage and percolation loss from the paddy
field, mm.
DRj = drainage requirement during the period, mm.
J = period of water management for an irrigation scheme, days.
2.2.2. Determination of the Supply Discharge
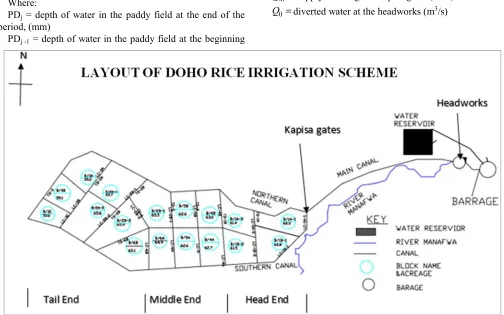
The diverted flow from the headworks undergoes conveyance losses. These losses have been factored in and the discharge at Kapisa gates (Figure 2) at any time can be represented using Equation 12.
2 0 0
0.083 0.542
m
Q = − Q +Q − (12)
Where:
m
Q =supply discharge at Kapisa gates (m3/s)
0
Q =diverted water at the headworks (m3/s)
Figure 1. Detailed layout of Doho Rice Irrigation Scheme.
Water Delivery Scheduling Model
The water delivery scheduling model allocates the required amount of water to a group of blocks on a given duration during a decade at different crop growth stages. Based on optimal irrigation water requirement IRi determined from the previous model, the volume of water requirement of the blocks to be supplied on the same day is calculated. The
decision variables are delivery discharge, the number of blocks and the operation criteria. The objective function is defined as shown in Equation 13
Maximize
0 1
n si
di i
Q f
T Q
=
Where:
f =Objective function
di
Q =Water demand for a group of blocks (m3/dec)
si
Q = Recommended supplies to a group of blocks (m3/dec)
0
T =Operation criteria
The operation criteria T0 is calculated from Equation 3.24
0 *
10 24
d h
T = (14)
Where:
d =number of days in a week/decade h=operation hours per day
The objective function is subject to the following constraints
1
n
i
di IF
=
≤
∑
(15)1
n
m i
qi Q
=
≤
∑
(16)Where:
d =number of days in a week/decade IF=Irrigation cycle (days)
qi=canal discharge (m3/dec)
m
Q =Available supplies in the main canal (m3/dec)
2.2.3. Application of the Model for Water Allocation at Doho Rice Scheme
The water allocation model was applied to Doho Rice Irrigation Scheme to equitably allocate available water supply at Kapisa gates to the lateral canals serving the irrigation blocks. Inputs to the water allocation model include decadal values of rainfall, reference evapotranspiration (ET0),
crop coefficient Kc, current ponding depth, seepage and
percolation rates, desired ponding depth and maximum ponding depth (PDmax). The model outputs include: required
irrigation supply, recommended irrigation supply. The inputs to the water delivery schedule are required irrigation supply, recommended irrigation supply, operation hours per day while the output is the number of irrigation days per week/decade.
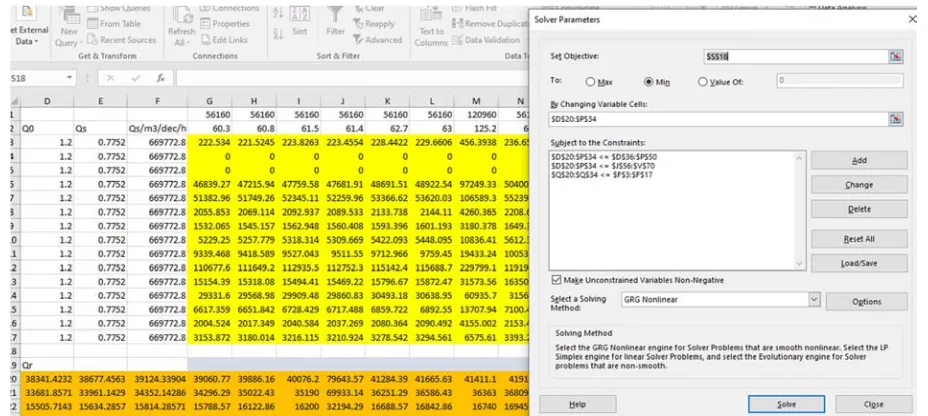
2.3. Water Allocation Optimization
Equations 10 and 13 were solved using Microsoft Excel using the Solver Box plug in in the Developer tab of Excel 2016. The Equations were written in excel formulars and the vaues of the variables in put. The constraints were put in the Excel solver box as shown in Figure 3.
Figure 2. Optimization of water allocation using Solver box plugin in Excel.
3. Results and Discussions
Table 1 presents the data that was used in the optimization model to obtains the irrigation requirements IR for each growth stage of rice.
Table 1. Data used to determine Irrigation Requirements.
Dec ade (j) Stage Kc ET0 (mm/day)
ETc (mm/day)
SAT (mm/day)
PD (mm)
PERC (mm/day)
TCWR (mm/day)
TCWR (mm/dec)
ER (mm/dec)
IRR req (mm/dec)
1 Land prep 5.79 0.00 7 0 0 7.00 70.00 22.1 47.90
Dec ade (j) Stage Kc ET0 (mm/day)
ETc (mm/day)
SAT (mm/day)
PD (mm)
PERC (mm/day)
TCWR (mm/day)
TCWR (mm/dec)
ER (mm/dec)
IRR req (mm/dec)
3 Land prep 5.81 0.00 7 0 0 7.00 56.00 38 18.00
4 Initial 1.1 4.43 4.87 0 5 3 12.87 128.73 35 93.73
5 Initial 1.1 4.34 4.77 0 5 3 12.77 127.74 31.7 96.04
6 Initial 1.1 4.3 4.73 0 0 3 7.73 85.03 30.2 54.83
7 Dev 1.1 4.43 4.87 0 0 3 7.87 78.73 25.3 53.43
8 Dev 1.1 4.55 5.01 0 0 3 8.01 80.05 19.1 60.95
9 Dev 1.1 4.6 5.06 0 0 3 8.06 80.60 14.1 66.50
10 Midseason 1.15 4.65 5.35 0 5 3 13.35 133.48 13.3 120.18
11 Midseason 1.15 4.7 5.41 0 5 3 13.41 134.05 11.5 122.55
12 Midseason 1.15 4.74 5.45 0 0 3 8.45 92.96 9.5 83.46
13 Late 1 4.73 4.73 0 0 3 7.73 77.30 14.3 63.00
14 Late 1 4.66 4.66 0 0 3 7.66 76.60 21.9 54.70
15 Late 1 4.62 4.62 0 0 3 7.62 76.20 18.9 57.30
3.1. Water Allocation Model
The results of the required irrigation supplies for each lateral canal in each crop growth period are presented in Figure 4. From the graph, the crop water requirements are high during the initial and midseason stage of rice development. The crop water requirements for each lateral canal are proportional to the canal command area and the crop growth stage.
Figure 3. Required irrigation supplies in each stage of growth for each lateral canal.
The optimization model was able to allocate irrigation supplies to the lateral canals equitably throughout the rice growth stages as shown in Figure 5.
The available discharge was allocated equitably among all the lateral canals serving the blocks. A minimum discharge of 1.2m3/s at the headworks that reduces to 0.775m3/s at Kapisa gates was used in the model testing. The available discharge is not sufficient to match the recommended irrigation supplies to the required irrigation water. The water
delivery scheduling model was used to avail the required discharges in a decade using the rotational system of water delivery
Figure 4. Recommended irrigation supplies.
3.2. Results from the Water Delivery Scheduling Model
The scheme blocks were grouped into four groups according to the proximity to each other so that they can receive all the water available at Kapisa gates on the same day. The grouping of the blocks is shown in Table 2.
Table 2. Grouped blocks for irrigation scheduling.
Group Blocks
1 1A1.1B1, 1A2, 1B2
2 4A, 4B, 5A, 5B
3 6A. 6B. 2B1, 2B2
4 2A, 3
Figure 6 presents the results from the water delivery scheduling model for the irrigation blocks in every crop stage of rice development.
During the land preparation, development and late-season stages, the irrigation frequency is 2 days a week. Whereas in the initial and midseason stages where the crop water requirements is high, the irrigation frequency was 3 days per decade. With this, the required supplies are met by allocating the recommended supplies following this schedule.
[13] Modelled irrigation water deliveries for Besut irrigation scheme in Malaysia by considering rainfall as a stochastic variable and found out that observed deliveries were more than the required deliveries.
4. Conclusion
A model for equitable water distribution was developed to allocate irrigation supplies during times of water scarcity. Required irrigation supplies were determined for each crop growth stage and irrigation deliveries to the canals allocated. A rotational system of water delivery was used and an irrigation frequency of 2 days per week was adopted for the land preparation, development and late-season stages. An irrigation frequency of 3 days per decade was adopted for all the blocks during the high crop water requirement stages of the initial and midseason stage.
Author Contributions
E. B designed the methodology, analyzed data, interpreted the results and prepared the manuscript. P. G. H conceptualization of the research topic. J. M. R helped in reviewing the work and editing the initial draft of the manuscript. J. W helped in data collection supervision, provision of secondary data and guided in the analysis of data.
Conflicts of Interest
The authors have no conflict of interest.
Acknowledgements
The Authors are grateful to Doho Rice Irrigation Scheme for granting permission to conduct the study at the scheme. Great thanks to the Uganda Meteorological department for the climate data used in the research. Sincere gratitude to the Doho Irrigation Scheme manager and the irrigation attendants who were very resourceful in this study.
References
[1] FAO. 3. Land and water systems at risk. The State of the World’s land and water resources for Food and Agriculture. Managing systems at risk. 2011. 308 p.
[2] FAO. Water for Sustainable Food and Agriculture: A report produced for the G20 Presidency of Germany. Rome. Italy; 2017.
[3] Wanyama J. Water harvesting and Improved Water Management for Enhancing Agricultural Productivity in Smallholder Irrigation Schemes in Uganda: Case study of Doho Rice Irrigation Scheme. UNESCO-UHE Institute for Water Education; 2007.
[4] Nsubuga FNW, Namutebi EN, Nsubuga-Ssenfuma M. Water Resources of Uganda: An Assessment and Review. J Water Resour Prot. 2014; 06 (14): 1297–315.
[5] Ayella P, Ishii A, Satoh M. A comparative analysis of two paddy irrigation schemes under contrasting water management of participatory and top-down systems in Uganda. Paddy Water Environ. 2019 Apr 6; 1–9.
[6] Angella N. Farmers’ Willingness To Pay For Irrigation Water: The Case Of Doho Rice Irrigation Scheme In Eastern Uganda. Makerere University; 2014.
[7] Nakano Y, Otsuka K. Determinants of household contributions to collective irrigation management: The case of the Doho Rice Scheme in Uganda. Environ Dev Econ. 2011; 16 (5): 527–51.
[8] Sserunkuuma D, Ochom N, Ainembabazi H. Collective Action in Canal Irrigation Systems Management: The Case of Doho Rice Scheme in Uganda. Agric Econ. 2003; (June): 1– 22.
[9] Zingaro D, Portoghese I, Pagano A, Giordano R, Vurro M. Migrad: A water allocation model for multi-resources irrigation supply systems in the capitanata district, Italy. WIT Trans Ecol Environ. 2017; 216: 323–34.
[10] Rowshon MK, Amin MSM, Masumoto T, Shariff ARM. Modeling Equitable Water Allocation for a Run-of-the-River Irrigation Scheme. 2nd Int Conf Water Resour Arid Environ. 2006; (April 2015): 1–14.
[11] Steduto P, Theodore c. H, Fereres E, Raes D. Crop yield response to water. Rome, Italy; 2012. Report No.: 66. [12] Bijan G, Sepaskhah A. Linear and non-Linear Optimization
Models For Allocation of a Limited Water Suppy. Irrig Drain. 2004; 54 (July): 39–54.