Volume 3, Issue 1, 31 - 40.
ISSN: 2469-9632 http://www.ijem.com/The Use of New Technologies in Basic Education: An Approach to Profile
of Indigenous Ecuadorians
Efstathios Stefos* Universidad Nacional de Educación UNAE, ECUADOR
Jose Manuel Castellano Universidad Nacional de Educación UNAE, ECUADOR
Andres Bonilla Marchan Universidad Nacional de Educación UNAE, ECUADOR
Julia Raina Sevy Biloon Universidad Nacional de Educación UNAE, ECUADOR
Abstract: This article aims to define the profile of Ecuadorian indigenous students who study at different levels of basic education in Ecuador in the context of the application and use of emerging technologies in the last five years. This approach focuses on a comparative analysis between indigenous and non-indigenous students, based on the national data from the National Survey of Employment, Unemployment and Underemployment of Ecuador (ENEMDU) 2006, 2011 and 2015, along with the contribution of other statistical sources, such as the 2001 and 2010 Census of the National Statistics Institute of Ecuador (INEC). The results show a significant difference in the use of ICTs between indigenous students and non-indigenous students, the majority of whom are mixed mestizo with minorities of montubios, blacks, whites, mulattos, afro-Ecuadorians and others. The interest in acquiring knowledge about one of the most precarious social sectors of Ecuadorian society, the indigenous population, is justified by the absence of studies about this subject, by the need to know the possible limitations or barriers, geographic, cultural and economic, and in the characterization of its profile, which will allow in future studies to deepen the process of appropriation of information and communication technologies in the applications, management and impact of ICTs and in the educational process of Ecuadorian indigenous students.
Keywords: Education, ICT, indigenous, Ecuador
To cite this article: Stefos, E., Castellano, J. M., Bonilla, A.M., & Biloon, J.R.S. (2017). The use of new technologies in basic education: an approach to profile of indigenous ecuadorians. International Journal of Educational Methodology, 3(1), 31-40. https://doi.org/10.12973/ijem.3.1.31
Introduction
The broad development and application of new information and communication technologies (ICTs) have played a key and globalizing role in 21st century societies and have been a transformative element in all areas and fields (Sandoval-Forero, 2013). In this context, a number of studies have been carried out to highlight the impact of these studies, from different disciplines, approaches (Romero, 2006; Chancay, 2009; Roca, 2016) and quantitative- qualitative methods in the academic field (CEPAL, 2014: 314), giving special attention to the Latin American and Caribbean region.
Access to information and communication is a basic and fundamental right of the citizen. Therefore, the United Nations considers access to new information and communication technologies essential in building democratic societies. However, in Latin America this access is characterized by an enormous double inequality: a) an external global gap with respect to the developed countries and b) an internal social divide caused by a digital stratification (CEPAL, 2014; 312).
These studies have also shown how in the last six years the use of the Internet in Latin America and the Caribbean has increased by 20 percentage points, from 14.1% in 2010 to 43.4% in 2015. There has also been a strong growth in broadband connections throughout the population, which has risen from 7% to 58%. There has also been a substantial improvement in the conditions of affordability. Since 2010 the cost of fixed broadband service amounted to almost 18% of average monthly incomes, while in 2016 it was only 2% (CEPAL, 2016).
However, despite these relevant advances, the literature has highlighted the persistence of inequalities (Sunkel, 2006; Sepúlveda and Leguina, n/d) and differences in access, both between in rural and urban areas (Botello, 2015), between income distribution quintiles (CEPAL 2016; 6) and among the various ethnic elements. This digital divide (Hernandez, et al., 2003; Lieberman, 2003; Sandoval, 2013) has attempted to combat national policies on ICT in education, such as the Latin American Network of Educational Portals (Sunkel, 2006) or in the context of the digital divide. In Ecuador
______________________ * Corresponding author:
Efstathios Stefos, Universidad Nacional de Educación UNAE, Azogues, Cañar, Parroquia Javier Loyola (sector Chuquipata), Ecuador
there has been the activation of programs for the spread of ICT, including the National Broadband Development Plan, which has been implemented by the Ministry of Telecommunications and the Information Society (CEPAL, 2016: 38).
The first feature that stands out, after reviewing the supporting bibliographies dedicated to studying Latin American indigenous peoples access to technologies is, on the one hand, an emerging proliferation of monographs about the indigenous population in the region (Becerra, 2012). On the other hand, there are high volumes of scientific production focused on other sectors and dominant groups (Sanchez & Ruzzi, 2011). However, despite this, in the last five years several works have been carried out in the region. On the other hand, in the Ecuadorian context, the studies carried out to date on the access and use of new technologies by indigenous groups are still a completely virgin field for research (Stefos, 2015; Roca, 2016; Castellano, 2017). Although we must highlight the quantitative work carried out by INEC.
However, this article does not attempt to analyze the factors that affect the uses, nor the process of appropriation of information and communication technologies, nor the applications, management or impact of ICTs in the educational process of the Indigenous Ecuadorian students. This study is simply a starting point, whose main purpose is to characterize the profile of a particular group. This group is made up of Ecuadorian indigenous students who study at different levels of Basic Education in relation to the use of new technologies, through a descriptive analysis and on the frequencies and percentages of the variables under investigation (Athanasiadis, 1995).
Ecuador is the result of a multicultural country integrated by diverse people and nationalities, whose distribution and ethnic composition draws on different features. The 2001 census placed the indigenous population at 6.8% and in 2010 this population increased to 7% (Table 1). For the first time the 2001 Census included the self-identification of membership for ethnic groups. However, it must be taken into account that the processes of acculturation and social criteria that conceal their indigenous roots and origins conditioned the establishments of these inter-ethnic boundaries.
Table 1. Population of Ecuador according to ethnic self-identification
Ethnicity 2001 2010
Mestizo 77.4 % 71.9%
White 10.5 % 6.1%
Indigenous 6.8 % 7.0%
Mixed 2.7 % 1.9%
Black 2.2 % 1.0%
Afro-Ecuadorian - 4.2%
Montubio - 7.4%
Other 0.3 % 0.4%
Source: 2001 and 2010 Census. Self-elaborated
The Kichwa people make up the highest demographic weight with 71.71% (Table 2), followed by 14.24% of people who identify themselves as indigenous, but are unaware of their ethnic affiliation, and third is the Shuar, which represents 7.83% of the indigenous social component (Chisaguano, 2006: 20).
Table 2. Disctribution of towns and nationalities in Ecuador
Nationalities Population %
Epera 546 0.05%
Zapara 559 0.05%
Siona 611 0.06%
Secoya 689 0.07%
Shiwiar 1.198 0.12%
Cofan 1.485 0.15%
Waorani 2.416 0.24%
Tsachila 2.956 0.29%
Awa 5.513 0.54%
Andoa 6.416 0.63%
Achuar 7.865 0.77%
Chachi 10222 1.00%
Shuar 79709 7.83%
Kichwa 730104 71.71%
Unknown 144988 14.24%
Other groups 22899 2.25%
Total 1018176 100.00%
Materials and Methods
The statistical material used in this article is based on the National Survey of Employment, Unemployment and Underemployment of Ecuador in 2006, 2011 and 2015 (ENEMDU). In addition to consulting census data of the National Institute of Statistics and Censuses (INEC), The National Child Labor Survey (ENTI), derived from the report of INEC and UNICEF (2015) on child labor in Ecuador, Child Labor in Ecuador, other sources such as the Economic Committee for Latin America and the Caribbean (ECLAC) and the System Of Educational Trends Information in Latin America (SITEAL). Data analysis was performed using statistical software R, double-entry tables are used for the comparison of the indigenous and non-indigenous population by variables.
Results and Discussion
This section is dedicated to presenting the results and their corresponding analysis grouped into two sections. The first is aimed at characterizing some variables related to demographic weight and its territorial distribution along with other socioeconomic aspects, such as indigenous self-recognition, enrollment rates and rate of attendance, gender distribution, levels of poverty and extreme poverty. The second section is aimed at defining the profile of the use of ICTs by indigenous students between the ages of 5 and 14.
3.1. Population, Geographic and Socioeconomic Characterization of Self-identified Indigenous population
The Ecuadorian student population that studies in basic education between the ages of 5 and 14 and defines itself as indigenous is represented in 2015 as 10.25% of the total student population (Table 3).
Table 3. Percentage distribution of self-identified indigenous Ecuadorian student population between the ages of 5-14 (2015-2016)
n %
Indigenous 343122 10.25%
Not indigenous 3004485 89.75%
Total 3347607 100.00%
Source: ENEMDU 2015. Self-elaborated
Enrollment is one of the criteria used to determine the effectiveness of the education system (Rivers, 2010) and is also seen as tangible evidence that education reaches all sectors of the population (UNICEF, 2011). However, in the case of Latin America and specifically Ecuador, these enrollment and attendance rates (Restrepo & Stefos, 2017) coexist with high levels of poverty (VV.AA., 2016; VV.AA., s / f) and child labor. In this sense, the data provided by the ENEMDU show that work, together with the lack of economic resources, are the main reasons for truancy among children between the ages of 5 and 17 (Almeida, 2014: 32). However, despite the fact that poverty is one of the main reasons for school absence, these indices have been progressively declining from 53.7% to 35.6% between the years of 2006 and 2012.
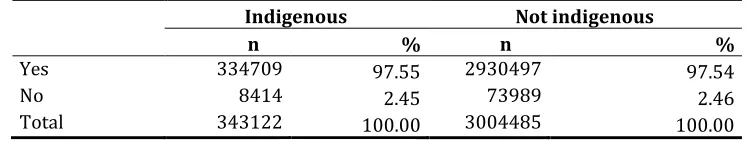
A defining feature for the enrollment process of the Ecuadorian student population within the age range mentioned above is the lack of differentiated behaviors or tendencies between the indigenous sector and the rest of the ethnic groups. This index was around 98% in 2015 (Table 4), which is eight points higher than it was in 2006-2007 (90.5%) and two points higher than it was in 2011. This evolution is the result of the policies of universal coverage promoted by the Ecuadorian government in primary, secondary and higher education, through the 2006 Ten-Year Education Plan. This plan sought together with the eradication of illiteracy, to improve the quality of life, reduce poverty and promote tolerance (Almeida, 2014).
Table 4. Percentage distribution of 2011016 school enrollment for the Ecuadorian population between the ages of 5-14
Indigenous Not indigenous
n % n %
Yes 334709 97.55 2930497 97.54
No 8414 2.45 73989 2.46
Total 343122 100.00 3004485 100.00
Source: ENEMDU 2015. Self elaborated
showing indigenous students attendance levels, which stands at 99.89%, compared to 99.63% for those enrolled in 2006. Although we must point out that in 2006, as seen previously, a lower percentage of enrollment and, therefore, there is a difference greater than a quarter of a point.
Table 5. Percentage distribution of class attendance of Ecuadorian students enrolled between the ages of 5-14 according to their self-identified indigenous heritage.
Indigenous Not indigenous
n % n %
Yes 334341 99.89 2926359 99.86
No 368 0.11 4138 0.14
Total 334709 100.00 2930497 100.00
Source: ENEMDU 2015. Self elaborated
The gender distribution of the group of students studied has a balanced composition in both indigenous and other ethnic groups. Although it should be noted that in 2006 there was an increase of 1.25% in indigenous girls, while the percentages of the non-Indigenous hardly changed (Table 6).
Table 6. Percentage of gender distribution of Ecuadorian students enrolled between the ages of 5-14 according to their self-identified indigenous heritage.
Indigenous Not indigenous
n % n %
Male 164268 49,08 1486844 50,74
Female 170441 50,92 1443653 49,26
Total 334709 100,00 2930497 100,00
Source: ENEMDU 2015. Self elaborated
As far as the territorial settlement, the Amazon and mountain regions are the main centers and have a greater concentration of indigenous populations. This can be explained as areas linked to the original cultures and characterized by the predominance of a model of agrarian subsistence and by high rates of precariousness (Table 7).
Table 7. Territorial distribution percentage of Ecuadorian students enrolled between the ages of 5-14 according to their self-identified indigenous heritage.
Indigenous Not indigenous
n % n %
Mountains 199592 59,63 1215551 41,48
Coast 28271 8,45 1600931 54,63
Amazon 106745 31,89 108582 3,71
Insular 100 0,03 5433 0,19
Total 334709 100,00 2930497 100,00
Source: ENEMDU 2015. Self elaborated
However, regarding the territorial distribution of 2011 there were significant changes in the indigenous sector. While the mountain region and island areas suffered a decrease of 11.73% and 0.48% respectively. The Amazon and coastal populations increased by 8.43% and 3.78%, respectively. This data is related to its own population dynamics throughout the territory.
Table 8. Territorial percentage distribution (urban-rural) of Ecuadorian students enrolled between the ages of 5-14 according to their self-identified Indigenous heritage
Indigenous Not indigenous
n % n %
Urban 56963 17.02 2023135 69.04
Rural 277746 82.98 907362 30.96
Total 334709 100.00 2930497 100.00
Source: ENEMDU 2015. Self elaborated
The level of poverty of indigenous Basic Education students is really high. These rates double the total number of students, with 60.71% compared to 29.13% (Table 9). However, their situation has improved compared to 2006, when the percentage of poor students stood at 72.44%. A similar trend is observed in non-indigenous people, where the poverty rate has changed from 44.09% in 2006 to 29.13% in 2015.
Table 9. Percentage distribution of poverty by income of Ecuadorian students enrolled between the ages of 5-14 according to their self-identified indigenous heritage
Indigenous Not Indigenous
n % n %
Not poor 128860 38.50 2048822 69.91
Poor 203206 60.71 853520 29.13
NA 2642 0.79 28155 0.96
Total 334709 100.00 2930497 100.00
Source: ENEMDU 2015. Self elaborated
The extreme poverty situation in 2015 of indigenous students reached 38.43% and we must point out that the data for this variable was not available in 2006 (Table 10).
Table 10. Percentage distribution of extreme poverty according to income of Ecuadorian students enrolled between the ages of 5-14 according to their self-identified indigenous heritage.
Indigenous Not indigenous
n % n %
Not indigent 203453 60.78 2625506 89.59
Indigent 128614 38.43 276836 9.45
NA 2642 0.79 28155 0.96
Total 334709 100.00 2930497 100.00
Source: ENEMDU 2015. Self elaborated
ICT Use Profile of Indigenous Students
This second block of analysis stops to look at some of the main uses of ICT by Ecuadorian indigenous students, but not from the perspective of their learning, skills and competences, but rather from the use and availability of technological resources such as cellular, computers and the Internet.
During 2015, only 10% of the total number of students enrolled in basic education had a cell phone, and of that, 2.46% were self-defined as indigenous. However, this group shows a growth of almost one point compared to 2011, which represents 4508 new indigenous mobile users compared to the half point increase of non-indigenous users.
Table 11. Percentage distribution of Ecuadorian students enrolled between the ages of 5-14 who have activated cell phones according to their self-identified indigenous heritage
Indigenous Not indigenous
n % n %
Yes 8236 2.46 221377 7.55
No 326370 97.51 2686618 91.68
NA 102 0.03 22501 0.77
Total 334709 100.00 2930497 100.00
Source: ENEMDU 2015. Self-elaborated
Table 12. Percentage distribution of Ecuadorian students enrolled between the ages of 5-14 who have a smartphone according to their self-identified indigenous heritage
Indigenous Not indigenous
n % n %
Yes 2007 0.60 100514 3.43
No 6229 1.86 120863 4.12
NA 326472 97.54 2709120 92.45
Total 334709 100.00 2930497 100.00
Source: ENEMDU 2015. Self elaborated
The frequency of computer use and the place from which technology is used are two basic indicators that allow us to characterize the use of ICTs. Thus, with respect to the frequency of computer use, both in the indigenous and non-indigenous sectors, there has been a significant increase during the last five years and especially with non-indigenous students, which has risen from 37.81% in 2011 to 47.71% in 2015. An identical trend is reproduced in the non-indigenous sector, with an upward trend of 51.44% in 2011 to 58.73% in 2015 (Table 13).
Table 13. Percentage distribution of Ecuadorian students enrolled between the ages of 5-14 who in the last 12 months have used computers according to their self identified indigenous heritage.
Indigenous Not indigenous
n % n %
Yes 159688 47.71 1721070 58.73
No 174918 52.26 1186925 40.50
NA 102 0.03 22501 0.77
Total 334709 100.00 2930497 100.00
Source: ENEMDU 2015. Self elaborated
With regard to the use of Internet in 2015, there were a low percentage of indigenous students (5.72%) who used computers from home versus non-indigenous students (24.95%). Although there as a tendency for growth in comparison to 2011, which had 0.62% and 10.37% respectively. In any case, this data clearly reflects the lack of availability of this resource in the domestic sphere and, therefore, the impossibility of access from their homes.
However, these differences have disappeared in public hotspots (18.25% in 2011 compared to 18.51% in 2015) (Table 15). This can explain new acquired social habits related to the establishment of new meeting cyber points between young people. They have been progressively joining the indigenous sector in recent years with a growth of almost ten points in 2015.
Table 14. Percentage distribution of Ecuadorian students enrolled between the ages of 5-14 who in the last 12 months have used the Internet according to their self identified indigenous heritage
Indigenous Not indigenous
n % n %
Yes 134126 40.07 1625374 55.46
No 200480 59.90 1282621 43.77
NA 102 0.03 22501 0.77
Total 334709 100.00 2930497 100.00
Table 15. Percentage distribution of Ecuadorian students enrolled between the ages of 5-14 who in the last 12 months have connected to the internet from their home, work, educational institution, etc. according to their self-identified indigenous
heritage.
Indigenous Not indigenous
n % n %
Home 19132 5.72 731081 24.95
Work 22 0.01 2344 0.08
Educational Institution 51006 15.24 278114 9.49
Hotspots 61086 18.25 542306 18.51
Another Person’s Home 2133 0.64 54925 1.87
Other 749 0.22 16605 0.57
NA 200582 59.93 1305123 44.54
Total 334709 100.00 2930497 100.00
Source: ENEMDU 2015. Self-elaborated
In contrast, the greatest difference in computer use in favor of indigenous people occurs in educational institutions, which surpassed non-indigenous people by 6 points in 2015. This is a dynamic similar to that, which occurs in other areas of the Latin American region. However, regardless of all these behaviors reported, the most significant data that remains is the low percentages of general computer use.
The use of Internet in the indigenous sector for education and learning has increased to 25.29% in 2015, compared to 13.75% in 2011 (Table 16). This information has been obtained with an increase of 7.72% in 2015 compared to 2.88% in 2011. The search for general communication has increased to 6.27% in 2015 compared to 1.70% in 2011.
Table 16. Percentage distribution of Internet use for Ecuadorian students enrolled between the ages of 5-14 in the last 12 months according to their self-identified indigenous heritage
Indigenous Not indigenous
n % n %
Get Information 25833 7.72 379762 12.96%
General Communication 20984 6.27 263155 8.98%
Buy/ Services and products ordered 33 0.01 1365 0.05%
Electronic banking and financial services 1259 0.38 2273 0.08%
Education and learning 84633 25.29 915680 31.25%
Transactions with agencies 0 0.00 275 0.01%
Entertainment activities 624 0.19 53044 1.81%
Get movies, music or software 589 0.18 6889 0.24%
Read / Downloaded electronic books 46 0.01 767 0.03%
Work Related 104 0.03 416 0.01%
Other 22 0.01 1749 0.06%
NA 200582 59.93 1305123 44.54%
Total 334709 100.00 2930497 100.00%
Source: ENEMDU 2015. Self elaborated
Table 17. Percentage distribution of the frequency of Internet use for Ecuadorian students enrolled between the ages of 5-14 in the last 12 months according to their self-identified indigenous heritage
Indigenous Not indigenous
n % n %
At least once a day 46619 13.93 952322 32.50
At least once a week 82390 24.62 630566 21.52
At least once a month 4886 1.46 38563 1.32
At least once a year 232 0.07 3240 0.11
Unknown 0 0.00 684 0.02
NA 200582 59.93 1305123 44.54
Total 334709 100.00 2930497 100.00
Source: ENEMDU 2015. Self elaborated.
Conclusions
The main conclusion that emerged from this study, regarding the use and application of ICTs by Ecuadorian indigenous students is that in the basic training stage there is a verification of a double digital divide. This divide is with respect to the low percentages of use and employment of new communication technologies in relation to developed countries and the internal gap between indigenous and non-indigenous youth. Although the status of the other minority ethnic groups is very likely to be in a similar situation, given that the socio-economic constraint is the primary limiting factor for access to and use of new technologies. This is despite all of the great changes, transformations and improvements in living conditions in Ecuador in recent years.
A second key aspect, as a consequence of what was mentioned in the previous paragraph, is the persistence of a double contrast of behaviors in the use of ICTs. One of territorial characteristics is between center, periphery and rural-urban. Another one is of a hierarchical character (dominant culture vs. dominated culture), which, together with marked socioeconomic differences, become conditioning factors for the use and application of new technologies as reflected in the data obtained. Thus, for example, two indigenous students out of every ten students in basic education have cellular telephones and half an indigenous students, for every one hundred students, has a Smartphone. While indigenous computer users reached 47.71% in 2015, which was eleven points less than non-indigenous groups.
A third feature is that indigenous students prefer to connect to the Internet in hotspots (18%) and in educational institutions (15%), whereas the connection from the family home is very low (5, 72%), which is almost twenty points less than non-indigenous groups.
A fourth characteristic highlights a similar behavior in the use of the Internet between the indigenous and non-indigenous groups, which focuses specifically on the process of education and learning (25.29%), in obtaining information (7.72%) and in the search for communication in general (6.27%), although with much lower levels of participation from indigenous students.
A fifth aspect refers to the progressive incorporation of the indigenous sectors in the daily, weekly and yearly frequency of Internet use. However, in 2015 there were still very low percentages, which were represented by 13.93% per day, 24.62% once a week and 0.07% at least once a year.
References
Almeida, K. (2014). Inversión en educación basica y objetivos del milenio. Unpublished BSc dissertation in the Pontifical Catholic University of Ecuador (PUCE). Retrieved from:
http://repositorio.puce.edu.ec/bitstream/handle/22000/6841/7.36.001418.pdf?sequence=4
Athanasiadis, I. (1995). Correspondence Analysis and Hierarchical Classification (pp. 51-56). Athens: New Technologies Editions.
Becerra Cortes, Y. E. (2012). Estudiantes indígenas y los usos y apropiación de las tecnologías de información y comunicación. Paakat. Revista de Tecnología y Sociedad. Año 2. No. 3. septiembre-diciembre. Retrieved from:
http://www.udgvirtual.udg.mx/paakat/index.php/paakat/article/view/180/251
Botello, H. A. (2015). Determinantes del acceso al internet: Evidencia de los hogares del Ecuador. Entramado, 11(2), 12-19. Retrieved from: https://dialnet.unirioja.es/descarga/articulo/5466451.pdf
Castellano, J. M., Stefos, S. & Williams Goodrich, L. G. (2017). The Educational and Social Profile of the Indigenous People of Ecuador: A Multidimensional Analysis. Review of European Studies,9(1), 137-147. doi:10.5539/res.v9n1p137
CEPAL (2013). La integración de las tecnologías digitales en las escuelas de America Latina y el Caribe: una mirada
multidimensional. Retrieved from:
http://repositorio.cepal.org/bitstream/handle/11362/21681/1/S2013023_es.pdf
CEPAL (2014). Los pueblos indígenas en America Latina. Avances en el último decenio y retos pendientes para la garantía de sus derechos. Santiago de Chile. Retrieved from:
http://repositorio.cepal.org/bitstream/handle/11362/37050/4/S1420783_es.pdf
CEPAL (2016). Estado de la banda ancha en America Latina y el Caribe 2016. Retrieved from: http://repositorio.cepal.org/bitstream/handle/11362/40528/6/S1601049_es.pdf
Chancay Medranda, F. (2009). Resultados de la aplicación de políticas para promover el acceso y el uso de las tecnologías
de la información y comunicación en la educación basica en el Ecuador 2000-2009 (Master's thesis, Universidad
Andina Simón Bolívar, Sede Ecuador; Universidad Externado de Colombia; Asociación de Empresas de Telecomunicaciones del Area Andina). Retrieved from:
http://repositorio.uasb.edu.ec/bitstream/10644/752/1/T798-MDGT-Chancay-Resultados%20de%20la%20aplicaci%C3%B3n%20de%20pol%C3%ADticas.pdf
Chisaguano, S. (2006). La población indígena de Ecuador. INEC. Quito. pag. 27. Retrieved from:
http://www.ecuadorencifras.gob.ec/documentos/web-inec/Bibliotecas/Estudios/Estudios_Socio-demograficos/Poblacion_Indigena_del_Ecuador.pdf
Hernandez, I. & Calcagno, S. (2003). Los pueblos indígenas y la Sociedad de la información en America Latina y el Caribe: un marco para la acción. Revista argentina de sociología, (1), 110-143. Retrieved from: http://www.tandfonline.com/doi/abs/10.1080/13260219.2002.10431783
Instituto Nacional de Estadística y Censos - INEC (2017). Conociendo las cifras. Boletín febrero.
Instituto Nacional de Estadística y Censos - INEC (2015). Encuesta Nacional de Empleo, Desempleo y Subempleo -
ENEMDU, 2015. Quito, Ecuador.
Instituto Nacional de Estadística y Censos - INEC (2011). Encuesta Nacional de Empleo, Desempleo y Subempleo -
ENEMDU, 2011. Quito, Ecuador.
Instituto Nacional de Estadística y Censos - INEC (2006). Encuesta Nacional de Empleo, Desempleo y Subempleo -
ENEMDU, 2006. Quito, Ecuador.
Instituto Nacional de Estadística y Censos - INEC (2001). Censo 2001. Quito, Ecuador.
Lieberman, A. (2003). A tomar posesión: el fortalecimiento de las culturas e idiomas indígenas mediante el uso de
tecnologías de la información y la comunicación. Washington: LearnLink.
Restrepo, R. y Stefos, E. (2017). Atlas del derecho a la educación en los años de la revolución ciudadana: una
aproximación a las transformaciones. UNAE, Azogues. Retrieved from:
http://media.wix.com/ugd/5049d3_f397f64fea434971b655bc2910b33909.pdf
Rivers, B. (2010). Truancy: Causes, Effects, and Solutions. In Education Masters. Paper 107. St. John Fisher College, Fisher Digital Publications. Retrieved from: http://fisherpub.sjfc.edu/education_ETD_masters/107
Roca, J. R. V. (2016). Incidencia del Uso de las Tecnologías de Información y Comunicación (TIC) en los Habitos y Costumbres de Jóvenes de Cultura Kichwa en Ecuador. Asian Journal of Latin American Studies, 29(1), 109-131. Retrieved from: http://www.ajlas.org/v2006/paper/2016vol29no105.pdf
Romero, J. L. R. (2006). Las tecnologías de la información y de la comunicación en la educación en cuatro países latinoamericanos. Revista Mexicana de investigación educativa, 11(28), 61-90
Salazar, J. F. (2002). Activismo indígena en America Latina: estrategias para una construcción cultural de las tecnologías. Retrieved from: https://dialnet.unirioja.es/servlet/articulo?codigo=2341265
Sandoval-Forero, E. A. (2013). Los indígenas en el ciberespacio. Agricultura, sociedad y desarrollo. Vol.10 no.2 Texcoco abr./jun. 2013. Retrieved from: http://www.scielo.org.mx/scielo.php?script=sci_arttext&pid=S1870-54722013000200006
Santander, G. (2012). Uso de las TIC en los jóvenes ecuatorianos. Revista e- Analisis. Instituto Nacional de Estadística de Ecuador.
Bonilla, M. A., Delgado, R., & Stefos, E. (2017). The Social Characteristics of Postgraduate Students in Ecuador: A Multidimensional Statistical Analysis. Review of European Studies, 9(2), 35-44. doi:10.5539/res.v9n2p35
Bonilla, M. A., Delgado, R., & Stefos, E. (2017). Statistical Analysis of Artisans and Unskilled Workers of Ecuador: A Multidimensional Statistical Analysis. Review of European Studies, 9(2), 35-44. doi:10.5539/res.v9n2p237
Sepúlveda Sanchez, D. y Leguina Ruzzi, A. (s/f). Pueblos indígenas y acceso a las tecnologías, una mirada desde los estudios de la desigualdad social. Retrieved from:
http://www.academia.edu/1022788/Pueblos_ind%C3%ADgenas_y_acceso_a_las_tecnolog%C3%ADas_una_mirad a_desde_los_estudios_de_la_desigualdad_social
Stefos, E. (2015). Causes of Death of Indigenous Ecuadorians. International Journal of Clinical Medicine Research. Vol. 2, No. 6, 2015, pp.65-70. Retrieved from: http://www.aascit.org/journal/archive2?journalId=906&paperId=3420
Sunkel, G. (2006). Las tecnologías de la información y la comunicación (TIC) en la educación en America Latina. Una exploración de indicadores. En CEPAL, 2006. Retrieved from:
http://repositorio.cepal.org/bitstream/handle/11362/6133/S0600907.pdf?sequence=1
UNICEF (2011). Acerca de la obligatoriedad en la escuela secundaria argentina. Analisis de la política naciona. Retrieved from: https://www.unicef.org/argentina/spanish/doc_final_30_08.pdf
VV. AA. (s/f). Mapa de pobreza y desigualdad por consumo. Ecuador 2014. INEC y Banco Mundial. Quito. Retrieved from: http://www.ecuadorencifras.gob.ec/documentos/web-inec/Bibliotecas/Libros/mapaLibro.pdf