Volume 5, Issue 1, 165 - 176.
ISSN: 2469-9632 http://www.ijem.com/Investigating the Visual Mathematics Literacy Self-Efficacy (VMLSE)
Perceptions of Eighth Grade Students and Their Views on This Issue
Halil Coskun Celik *
Siirt University, TURKEY
Received: November 26, 2018 ▪ Revised: December 23, 2018 ▪ Accepted: February 15, 2019
Abstract: The aim of this study was to investigate the VMLSE perception levels of eighth grade students and differentiations based on variables of gender, state of success, final grade and ability to relate mathematical concepts to daily life and examine their views on this issue. The exploratory design of mixed method, which includes both quantitative and qualitative methods, was used in the study. The survey method was used in the quantitative dimension of the study. In qualitative dimension, phenomenological design which is one of the qualitative research designs is used. The data obtained from the quantitative dimension by VMLSE perception scale were analyzed by t-test and one-way analysis of variance. The data obtained from the semi-structured interview form were analyzed by using the content analysis method for the qualitative dimension of the research. As a consequently, there was a significant difference in VMLSE perceptions based on the variables of final grade, finding one’s self successful in the field of mathematics and ability to relate mathematical concepts; however, there was no significant difference based on gender. Additionally, it was found, the students had the idea that having VMLSE perception would affect mathematics success positively.
Keywords: Mathematics education, mixed methods, visual mathematics literacy.
To cite this article: Celik, H. C. (2019). Investigating the visual mathematics literacy self-efficacy (VMLSE) perceptions of eighth grade students and their views on this issue. International Journal of Educational Methodology, 5(1), 165-176. https://doi.org/10.12973/ijem.5.1.177
Introduction
Literacy is the ability to use communicational symbols that the general public makes sense of effectively (Kress, 2003). As it expresses that students create solutions to mathematical problems and interpret these, it also expresses their skills of analyzing ideas and establishing communication (U.S. Department of Education, 2014). Literacy plays a significant role in learning mathematics for students to be able to read, view, analyze and interpret mathematics, which is represented by texts, figures, symbols, tables, charts and technological indicators (Quinnell, 2014). In recent years, debates are focused on several different types of literacy which may change in different fields based on the tool to be used and the goal to be reached (Altun, 2003) such as digital literacy, information literacy, computer literacy, media literacy, finance literacy, visual literacy and mathematics literacy (Askar, 2015).
Mathematics literacy is closely related to the concept of literacy. While literacy sets the basis for all learnings, mathematics literacy is also needed in addition to this in order to completely understand the knowledge surrounding us in the modern society (Ontario Ministry of Education [OME], 2014). Mathematics literacy is the capacity of the individual, who thinks, creates and is a critical being, to understand and recognize the role mathematics plays in the world around by using mathematical thinking and decision-making processes in solution of potential problems of today and the future (The Organization for Economic Co-operation and Development [OECD], 2003). In order to achieve mathematical literacy, the individual should not only use the fluency of mathematics to express ideas that are clear and convincing, but they should also improve it to present their own thoughts and logic (National Council of Teachers of Mathematics [NCTM], 2009). An individual who is mathematically-literate can make predictions, analyze data, solve daily life problems, think about numerical, graphical and geometric situations, understand mathematics and communicates using mathematics (OME, 2014).
Visual literacy is basically an act of making sense of and interpreting that involves reading and forming visuals (Gocer & Tabak, 2013). A person with a visual literacy ability can make sense of visible objects as a part of visual thought,
*Correspondence:
Halil Coskun Celik, Siirt University, Faculty of Education, Department of Mathematics and Science Education, 56000, Siirt, Turkey.
effectively create static and dynamic objects in a confined space, perceive and evaluate the visual expression of others (Cimen & Ayguner, 2018). Mathematical visualization is, to be precise, the skills of students to use schemas and draw them by pen and paper or a computer in some cases as supportive elements to problem solving in order to achieve presentation and comprehension of a concept of problem. Because the relationship between visuals and mathematics concepts make mathematics which is an abstract subject tangible and noticeable (Ipek, 2003), it is also closely related to mathematics literacy. There is a strong relationship between visual literacy and mathematics literacy (Feinstein & Hagerty, 1994). This relationship was first introduced by Debes (1968) and the concept of visual mathematics literacy emerged. Such literacy can be thought of as a combination of visual literacy and mathematics literacy (Cimen & Ayguner, 2018).
Visual mathematics literacy may be defined as the capacity to perceive, express, interpret, analyze and use problems encountered in daily life in a visual or spatial sense, and vice versa, visual and spatial information in a mathematical sense (Bekdemir & Duran, 2012). Establishment of the Visual Mathematics Institute in the state of California in the U.S.A. in 1975 is a significant step in the historical development of visual mathematics literacy. This institute assumed the targeted goal of improving university mathematics teaching programs such as analysis, linear algebra and differential equations using computer-graphics-assisted materials as a visual mathematics project (Ilhan, Celik & Pocan, 2016). This institute, which is still present at the University of California, took on duties such as refurbishing degree programs in the education system and showing the beauty of mathematics to individuals in the society (Duran, 2013). Individuals with visual mathematics carry the qualities to recognize and analyze experiences related to shapes, spaces, time and motion and representations of these concepts by using all their senses (Tekin & Tekin, 2004). Having visual mathematics literacy may be necessary to be successful in mathematics, but it is not sufficient. In order to become successful in mathematics, the individual should also have psychologically high levels of belief in their potential success. One of the significant affective factors that influence a person’s performance in any subject is their perception of self-efficacy.
Self-efficacy perception, defined in various ways in the literature, is also the basic building block of Social Learning Theory. According to the founder of the theory Bandura (1997), self-efficacy perception is the thought of an individual on their achievement of development of their behaviors, making necessary organizations for completing a task and completing the task successfully. In other words, self-efficacy perception was defined as the perception of the individual on their skill and capacity to cope with certain situation and complete a behavior (Senemoglu, 2009). High self-efficacy perceptions motivate the person to inquire and learn and help them spent more effort to achieve something and not give up against difficulties. Additionally, self-efficacy perception is determinant on selection of activities by the individual, their patience against difficulties, level of their efforts and their performance (Askar & Umay, 2001). Level of self-efficacy is a significant factor that determines how people behave in situations, events and difficult processes (Yaman, Cansungu & Altuncekic, 2004). The higher the belief of self-efficacy in an individual is, the more persistence, effort and resistance are noticeable. Individuals with low beliefs of self-efficacy have the idea that events are more difficult than they seem and they usually cannot end their problems or work with success as they have a narrower point of view (Kaptan & Korkmaz, 2002).
Considering the concept of self-efficacy in terms of visual mathematics literacy, it is the confidence of students in themselves regarding their capacity to complete mathematical activities successfully by reading and interpreting visual elements and organize the activities. Mathematics literacy perception in general is the belief of the individual in their own skills in the processes, talents and situation they encounter in their school and daily life (Ozgen & Bindak, 2011). Visual Mathematics Literacy Self-Efficacy (VMLSE) perception has an important place in mathematics education, because students with high VMLSE perceptions spend more effort and time to understand mathematical subjects, make their goals higher, work in an organized and planned way, spend effort to cope with difficulties they encounter, and are patient in their work.
In studies on this subject, it is seen that the VMLSE perception levels of secondary school students are determined, and this perception is examined in terms of variables such as gender and academic achievement, and there are studies based on correlations. This studies examined the students' VMLSE self-efficacy perception levels from in terms of gender and mathematics achievement levels (Ayguner, 2016; Celik, Bindak & Ozdemir, 2018; Deveci & Karademir, 2018; Tutkun, Erdogan & Ozturk, 2014; Schulz, 2005). In other studies, the researchers evaluated the relationship between VMLSE, visual mathematics achievement (Duran & Bekdemir, 2013; Duran, 2011) and the actual performance (Cimen & Ayguner, 2018). However, it did not find a mixed-design study that determined VMLSE perceptions of 8th-grade middle school students and obtained their views on the issue. Some studies determined VMLSE perception levels of middle school students on different education levels and investigated whether these levels differed significantly based on gender, perceived mathematical success level, class level, perceived income level and educational levels of parents or not.
added to textbooks used in school by MEB via activities, and thus, the importance of visuals in the education environment was increased (Ilhan et al., 2016). Students should have VMLSE perceptions to read and interpret visuals in mathematics correctly. As increasing VMLSE perception will affect student success in the process of education positively, it is important to know what the variables affecting this perception in students are and what may be done about these variables.
The general objective of this study is to determine the VMLSE perception levels of eighth-grade students, find how these levels differ based on some variables such as gender, state of success, final grade and ability to relate mathematical concepts to daily life, and obtain detailed views from student on this issue. Answers to the following sub-problems were sought in the scope of the general objectives of the study:
1. Is there a significant difference in eighth-grade students’ visual math literacy self-efficacy perceptions according to gender and final grade?
2. Is there a significant difference in eighth-grade students’ visual math literacy self-efficacy perceptions according to state of finding oneself successful finding in mathematics?
3. Is there a significant difference in eighth-grade students’ visual math literacy self-efficacy perceptions according to the ability to relate mathematical concepts to daily life?
4. What are the participants’ views on the concept of VMLSE perception? 5. What are their views on VMLSE perception?
Methodology Research Model
This research was designed in descriptive mixed design. Firstly, quantitative data are collected and analyzed in the descriptive mixed design, then the qualitative data are collected and analyzed to support these quantitative data (Creswell, 2007). This research was carried out in two interactive stages. After the quantitative data were collected and analyzed in the first stage, qualitative data were collected and analyzed to support the data obtained during the quantitative research process. In the quantitative dimension of the study, survey method was used. This method is to examine the whole universe or a group, sample or sample taken from it in order to make a general judgment about the universe (Kose, 2014). The aim of this study is to examine the perception of VMLSE perception levels and the sub-dimensions of the students in terms of gender, final grade, successful finding in mathematics, and relating mathematical concepts to daily life. In the qualitative dimension of the study, the phenomenological study design was used because the students focused on revealing and interpreting their perceptions about the concept of visual mathematics literacy. The phenomenology design focuses on the facts that we are aware of but do not have a deep and detailed understanding (Yildirim & Simsek, 2013). The main purpose of the phenomenology studies is to draw personal experiences related to a phenomenon to a more general level (Creswell, 2007). In this dimension, the views of the students on VMLSE perception were examined in a detailed way by using a semi-structured interview form.
Population and Sample
The population of the study consisted of 112 students on the level of eighth grade at a middle school in Siirt, Turkey in the academic year of 2016-2017. After having meetings with the school administration and teachers and receiving the required permissions, a total of 74 students including 39 male students and 35 female students, in three different classrooms (8A, 8B and 8C) were included in the sample, and their ages differed in the range of 14-16. The same sampling method was used in the quantitative and qualitative dimension of the study. The sample in the study was selected by convenience sampling method including sample selection from easily accessible and treatable units due to time, money or labor constraints (Buyukozturk, Kilic-Cakmak, Akgun, Karadeniz & Demirel, 2016). Since convenience sampling method was used, results are not generalized beyond the sample. However, in the sample of the qualitative data of the study, 58 students took part in the semi-structured interview form which was applied to the students because 16 of them are incomplete and inaccurate. The reason for choosing 8th-graders in this study was that the second researcher carried out mathematics courses on this level and students on this level have seen all subjects of the learning area of mathematics in the middle school curriculum. Additionally, it was also effective in choosing this level that these students started to transition from the step of tangible thinking into their period of abstract thinking (Chaput, 2001).
Data Collection Tools
At the stage of data collection; the quantitative data were collected using a personal information form and a VMLSE perception scale, and the qualitative data were collected using a semi-structured interview form. These are described below.
grade in this system. The researcher reviewed the literature and examined similar forms to create these questions. The questions here were used to reach the independent variables with the aim of determining which factors made a difference on VMLSE perceptions.
VMLSE perception scale: It was developed by Bekdemir and Duran (2012) to determine VMLSE perceptions of middle school students. In the scale which consists of a total of 38 items including 2 negative and 36 positive items of a 5-point Likert-type, the minimum possible score is 38 and the maximum possible score is 190. The positive items were scored as 1 “absolutely disagree”, 2 “disagree”, 3 “undecided”, 4 “agree”, 5 “absolutely agree”, while the negative items were scored in reverse. The items of the scale were gathered under three factors as “field content”, “process” and “cases of usage” while these factors explained 40.82% of the total variance. The three factors reflect the students 'perceptions of visual mathematics literacy self-efficacy, and these factors explain about 40.82% of the total variance of students' thoughts about the nature of mathematics that cannot be directly observed. Some items in the “field content” factor of the scale: I can obtain new geometrical shapes by dividing a geometrical shape – I can have difficulty to understand rotation of objects – I can draw the three-dimensional shape of objects on paper. Some items in the “process” factor of the scale: I can write down a modelled decimal number - I can draw the shape of a problem related to sets right away - I can easily name the geometric object given the basic properties. Some items in the “cases of usage” factor of the scale: I can show the position of a point on a line chart – I can form a column chart based on the hair colors of the students at our school - I can interpret a chart in the newspaper. The reliability coefficient of the scale used in this study was found as .92. As this value was higher than .80 (Kayis, 2005), the scale may be considered to have high reliability. On the other hand, the Cronbach’s alpha reliability coefficients of the sub-factors "field content", "process" and "cases of usage" respectively are .65, .92 and .83.
Semi-structured interview form: This was developed by the researcher to examine in detail the views and thoughts of the students regarding VMLSE perception. A five-item draft form was created as a result of a comprehensive literature review process. While preparing the questions, attention was paid to not include short-answer yes-no questions or those that include expressions or concepts that may lead to misunderstanding. Semi-structured interview is a structured interview, combined with open-ended questions (Fraenkel, Wallen & Hyun, 2011). For the validity of the form, three academicians who are experts in the field of "measurement and evaluation" and “mathematics education” were consulted. The experts were asked to provide opinions regarding the suitability of the questions for the objective of the study and their comprehensibility based on a grading of “necessary”, “useful but insufficient” and “unnecessary. As a result of the feedback received from the experts, it was decided to remove two questions that were found unsuitable from the form. The resulting form which consisted of three questions were applied on sixteen students as a pilot study, and the points that were not suitable in terms of grammar and clarity were fixed. As a result of the work carried out, the final interview form with three open-ended questions was formed. The questions in the final form are as follows; i) What do you think about the concept of VMLSE? How would you describe it? ii) What are the characteristics of individuals with a positive VMLSE perception? What are your opinions about these features? iii) What do you think about the effect of VMLSE perception on mathematics achievement? Please give your opinion on this. Analyzing of Data
reviewed the VMLSE Perception Scale. As a result of the feedback, the codes were organized to be suitable for the determined criteria, and it was decided to include them this way. Additionally, the agreement percentage formula developed by Miles and Huberman (1994) was used to measure the reliability of the qualitative data in the study. Agreement percentage is calculated by the formula (P)=agreement(Na)/[agreement (Na)+disagreement (Nd)]x100. It is possible to say that cases with coding reliability of 90% or higher are reliable (Saban, 2008). Accordingly, the experts who were consulted placed only four statements into a different category in comparison to the researcher. Therefore, the agreement percentage of the semi-structured interview form was calculated as (P)=14/[14+1]x100=93%, and the internal reliability of the qualitative data was established.
Findings
Quantitative Findings Regarding the Analysis of the VMLSE Perceptions of the Students Based on Some Variables
The study investigated the distribution of the students’ perception levels on total VMLSE and sub-factors of “field content”, “process” and “cases of usage”. Additionally, quantitative findings were included to show whether there were significant differences in the VMLSE perceptions of the students and sub-factors based on variables of gender, finding one’s self successful in mathematics, final grade and ability to relate mathematical concepts to daily life.
Table 1. VMLSE perception levels and descriptive statistics of the students
Factors N Min Max Skewness Kurtosis ̅
Field content 74 1.57 4.86 .47 .41 3.39 .64
Process 74 2.05 4.67 .14 .79 3.41 .64
Cases of usage 74 1.90 4.90 .28 .89 3.62 .80
Total VMLSE Perception 74 2.11 4.50 .11 .95 3.46 .62
Table 1 shows the descriptive statistics of the VMLSE and sub-factor perceptions of the students and their general levels of perception. Accordingly, the mean general VMLSE perception score of the students was 3.46 with a standard deviation of .62. On the other hand, the mean scores of the perception sub-factors may be listed from the highest to the lowest as cases of usage (3.62), process (3.41) and field content (3.39). In that case, the general VMLSE perception scores of the students was higher than sub-factors of the "process" and "field content" perceptions of the scale, but it was lower than the sub-factors of the "cases of usage". The reasons for this may include that these students had seen all subjects in the mathematics curriculum and the period of transition to abstract thinking started in these students.
Table 2. The t-test results of the VMLSE perceptions of the students based on gender
Factors Gender N ̅ SD df t p
Field content Female Male 35 39 3.40 3.38 .66 .63 72 .13 .89
Process Female Male 35 39 3.51 3.32 .62 .66 72 1.25 .21
Cases of usage Female Male 35 39 3.67 3.57 .77 .83 72 .51 .60
Total VMLSE Perception Female Male 35 39 3.53 3.40 .62 .62 72 .91 .36
The study used independent-samples t-test to evaluate whether the VMLSE perceptions of the students and sub-factors showed a significant difference based on gender or not. Table 2 shows the obtained findings. Accordingly, the mean score of the female students (3.53) higher than the mean score of the male students (3.40). However, this difference was not statistically significant (t(72)=.91; p>.05). Moreover, the mean perception scores of the female students in all sub-factors were, again, higher than those of the male students, but the differences were not significant.
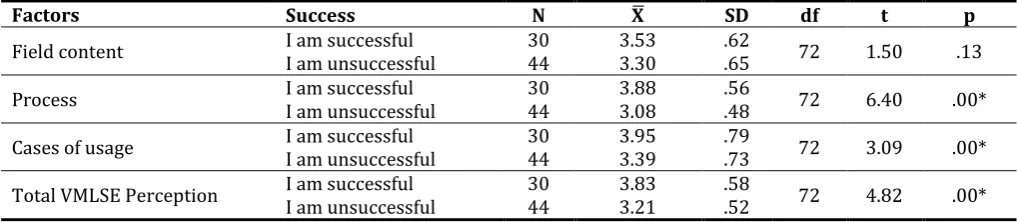
Table 3. The t-test results of the VMLSE perceptions of the students based on finding themselves successful in mathematics
Factors Success N ̅ SD df t p
Field content I am successful I am unsuccessful 30 44 3.53 3.30 .62 .65 72 1.50 .13
Process I am successful I am unsuccessful 30 44 3.88 3.08 .56 .48 72 6.40 .00*
Cases of usage I am successful I am unsuccessful 30 44 3.95 3.39 .79 .73 72 3.09 .00*
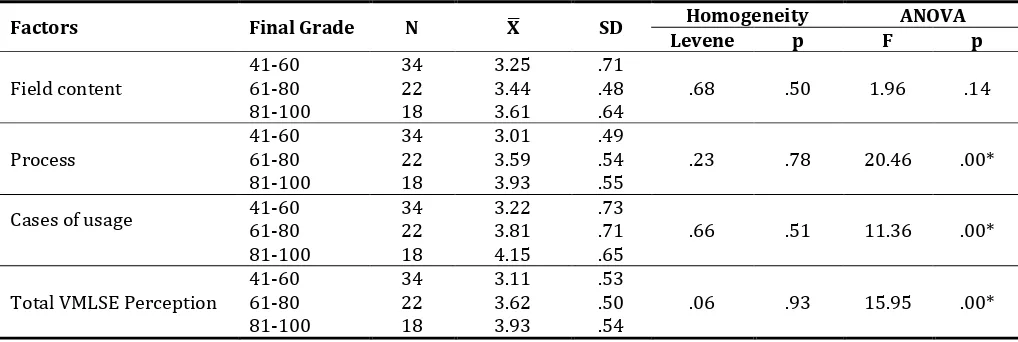
Table 3 shows the results of the independent-samples t-test based on the VMLSE perceptions of the students and sub-factors and the state of finding themselves successful in the field of mathematics. According to this, the mean VMLSE perception score of those who found themselves successful (3.83) was higher than that of those who found themselves unsuccessful (3.21). The statistical analysis showed that this difference was significant in favor of those who found themselves successful (t(72)=4.82; p<.05). Moreover, the mean sub-factor scores of those who found themselves successful were higher than the mean scores of those who found themselves unsuccessful. The difference was not found to be significant for the sub-factor “field content” (t(72)=1.50; p>.05). On the other hand, the “process” (t(72)=6.40; p<.05) and “cases of usage” (t(72)=3.09; p<.05) sub-factors showed statistically significant differences. ANOVA was used to examine whether the VMLSE perceptions of the students and sub-factor scores showed significant differences based on final grades. Table 4 shows the findings. Accordingly, for the students who had final grades in the range of 81-100 points, the mean general VMLSE perception (3.93), and the mean “field content” (3.61)”, “process” (3.93)” and “cases of usage” (4.15) sub-factor scores were higher than those with final grades in the range of 21-80. Additionally, significant differences were found between the scores of the students for the sub-factors “process” (F=20.46; p<.05), “cases of usage” (F=11.36; p<.05) and total VMLSE perception (F=15.95; p<.05) based on final grades, where there was no significant difference in the sub-factor “field content” (F=1.96; p>.05).
Table 4. ANOVA results of the VMLSE perceptions of the students based on final grades
Factors Final Grade N ̅ SD Homogeneity ANOVA
Levene p F p
Field content 41-60 61-80 34 22 3.25 3.44 .71 .48 .68 .50 1.96 .14
81-100 18 3.61 .64
Process 41-60 61-80 34 22 3.01 3.59 .49 .54 .23 .78 20.46 .00*
81-100 18 3.93 .55
Cases of usage 41-60 61-80 34 22 3.22 3.81 .73 .71 .66 .51 11.36 .00*
81-100 18 4.15 .65
Total VMLSE Perception 41-60 61-80 34 22 3.11 3.62 .53 .50 .06 .93 15.95 .00*
81-100 18 3.93 .54
Table 5 provides the ANOVA results based on the cases of relating mathematical concepts to daily life in terms of the VMLSE perceptions of the students and sub-factors. Accordingly, the mean scores of the students who marked “always” on the scale in the general total VMLSE perceptions and all sub-factors were higher than those who marked the other choices (never, sometimes). This difference was found to be significant for the sub-factors of process and the general total VMLSE perceptions, but insignificant for and the sub-factor of field content and cases of usage.
Table 5. ANOVA results of the VMLSE perceptions of the students based on ability to relate mathematical concepts to daily life
Factors Choices N ̅ SD Homogeneity ANOVA
Levene p F p
Field content Never Sometimes 21 39 3.28 3.38 .53 .72 .33 .71 1.02 .36
Always 14 3.60 .56
Process Never Sometimes 21 39 3.19 3.39 .58 .61 .81 .44 3.59 .03*
Always 14 3.77 .72
Cases of usage Never Sometimes 21 39 3.49 3.53 .73 .83 1.36 .26 2.66 .07
Always 14 4.05 .67
Total VMLSE Perception Never Sometimes 21 39 3.28 3.43 .56 .62 .51 .60 3.28 .04*
Always 14 3.81 .61
Qualitative Findings on the VMLSE Perceptions of the Students
perceptions as “the definition of the concept of VMLSE perception”, “characteristics of those with VMLSE perception” and “the effect of VMLSE perception on mathematics success”. The findings are provided below.
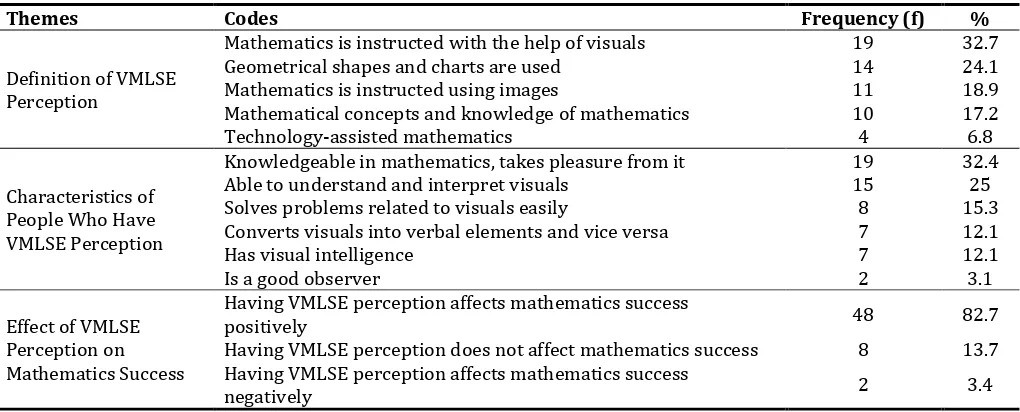
Table 6. Themes, codes and frequency distributions related to the VMLSE perceptions of the students
Themes Codes Frequency (f) %
Definition of VMLSE Perception
Mathematics is instructed with the help of visuals 19 32.7
Geometrical shapes and charts are used 14 24.1
Mathematics is instructed using images 11 18.9
Mathematical concepts and knowledge of mathematics 10 17.2
Technology-assisted mathematics 4 6.8
Characteristics of People Who Have VMLSE Perception
Knowledgeable in mathematics, takes pleasure from it 19 32.4
Able to understand and interpret visuals 15 25
Solves problems related to visuals easily 8 15.3
Converts visuals into verbal elements and vice versa 7 12.1
Has visual intelligence 7 12.1
Is a good observer 2 3.1
Effect of VMLSE Perception on Mathematics Success
Having VMLSE perception affects mathematics success
positively 48 82.7
Having VMLSE perception does not affect mathematics success 8 13.7 Having VMLSE perception affects mathematics success
negatively 2 3.4
There were five different codes based on the theme of “the definition of the concept of VMLSE perception”. The most frequently preferred codes may be ordered in frequency as; teaching mathematics with the help of visuals (f=19), usage of geometrical shapes and charts (f=14) and teaching mathematics with images (f=11). Some of the views stated by the students regarding this theme were as the following;
“It is interpretation of a problem or question given with images in a mathematics class. Or, it is drawing a given problem or question using visuals.” (G19)
“It is usage of geometry in our lives or mathematics. It is difficult to understand problems that are solved constantly by formulae. This is why it is the instruction of the course in a virtual environment or with visual materials and getting the attention of the student.” (G28)
“It is the presentation of a mathematics term by teachers visually with a chart or diagram. While teaching the course, when we do not understand a question, teachers occasionally use tables, they sometimes draw different images and sometimes open videos related to the question on smart boards. So, we see the question.” (G6)
“I think VMLSE perception is shaping a mathematical operation or a mathematics question as a column, line or pie chart. It is making mathematics problems visibly seen and easier to solve.” (G7)
“I think VMLSE perception is expression of mathematical operations or statements using shapes, charts and similar cases used in daily life. It is when a student sees a slide, video or set of images related to mathematics, they know what these mean.” (G2)
Based on the views provided above, the students preferred concepts like “visual”, “shape”, “symbol”, “chart”, “diagram” while defining VMLSE perception. Considering that these concepts are among the visual elements of mathematics, it may be stated that the concept of VMLSE perception was meaningful for the students, and while not in a conscious way, it had correspondence in the students.
There were 6 codes for the theme of “the characteristics of those with VMLSE perception”. The most frequently preferred codes may be listed in order of frequency as; they are knowledgeable in the field of mathematics and they take pleasure from mathematics (f=17), they can understand and interpret visuals (f=14) and they easily solve problems related to visuals (f=8). Some views provided by the students on this theme were as the following;
“I think they are people with strong visual memory who can operate with symbols, solve mathematics by practical means, like dealing with mathematics and draw qualified geometrical shapes.” (G12)
“I think they like mathematics and are persistent in solving problems. They fight to solve a problem even if it lasts two hours. They can show verbal statements with shapes. They draw very beautiful mathematics tables and charts. They solve mathematics day and night without getting bored and they are very intelligent.” (G53)
“Knows mathematics well. Solves mathematics and geometry problems easily. They may be successful in the painting class. They have developed skills of drawing. They interpret and can verbally express column charts. They know the meaning of mathematical symbols. For example, when they see the symbol “>”, they say “greater than” and when they see the symbol “ ”, they say “square root”.” (G41)
“I think they are social people. They are people who understand object very quickly and comprehend what they read. They understand visuals easily. They draw chards very well. They connect the shapes around them to mathematics.” (G18) According to the examples provided above, the students saw people with VMLSE perception as those who are able to perceive visuals, take pleasure from mathematics, understand visuals, interpret them and solve problems related to visuals.
There were 3 codes in the theme “the effect of VMLSE perception on mathematics success”. The most frequently preferred codes may be listed in order of frequency as; having VMLSE perception affects mathematics success positively (f=48), having VMLSE perception does not affect mathematics success (f=8), having VMLSE perception affects mathematics success negatively (f=2). Some of the views provided by the students on this issue were as the following; “I think it has positive contribution. Because visualized state of mathematics stays in our brain longer. Therefore, it leads us to become successful. We also become successful in geometry, because it has many connections to mathematics.” (G16) “I think it affects positively, because we can solve problems or questions using those shapes. Instead of envisioning it in our head, we work directly on the question, which is better. We respond faster in mathematics.” (G47)
“I think it does not have an effect. I person who understands mathematics understands it in any form. We become successful more in Science and Turkish courses, because they are understood better with images and we can understand fast.” (G18)
“I do not think it would have an effect, because the student needs to touch those visualized objects. That would be how it would stay in mind permanently. Because the student needs to grab the visualized materials and look at them. That would be permanent. Students may get confused because they will see several objects in time. This may even affect success negatively.” (G19)
“I think it would have a negative effect, because we might not think of how to solve operations when we see the images. The process may become more complicated. We might have difficulty in understanding problems and operations.” (G26) It was seen based on the examples of views and frequencies given above that the vast majority of the students though having VMLSE perception would affect success positively. In general, the students used statements as visualization increases permanence in the mind, provides benefits on time consumption and provides the student with practicality and drawing skills as reasons.
Discussion and Conclusion
especially in the learning field of geometry, because the subjects of this learning field are image-based, sight-oriented and they require interpretation and reasoning along with making additional drawings on the shapes in hand.
Another result of the study was that the VMLSE perception levels of the female students were higher than those of the male students, while this difference was not statistically significant. There are studies in the literature which reached similar results. The studies in question determined that the VMLSE perception levels of middle school students showed statistically significant differences in favor of female students (Celik et al., 2018; Ozdemir et al., 2016; Tanoglu et al., 2017). On the other hand, some studies reported the opposite case, in favor of male student (Ozgen & Bindak, 2011). Additionally, in the PISA 2015 application, it was found that the mathematics literacy levels of male students in the age group 15 were higher than those of female students, while the difference was not statistically significant (MEB, 2015). The explanation for the result may be that various factors such as the condition that there is family and environmental pressure on girls due to the socio-cultural structure of Turkish society, girls are more eager to make use of limited opportunities, different experiences of socialization for different genders increased the importance paid by the female students on mathematics and in connection to this, their VMLSE perception levels increased. As seen here, findings of studies which investigate VMLSE perceptions of students based on gender vary. The reasons for these differences may be investigated. Social, cultural and cognitive activities may be organized based on results.
The VMLSE perceptions of the students with final grades in the range of 81-100 were found to be higher than those below this range. Therefore, it may be stated that there was a positive relationship between the success levels of the students and their VMLSE perceptions. In other words, it may be expected that students with high mathematics success levels would also have high VMLSE perceptions. High VMLSE levels of students may have led them to become successful in mathematics as there is a close relationship between self-efficacy perceptions and success in any field (Senemoglu, 2009). In addition to this, this success may be explained by students’ easy comprehension of verbal statement in a problem via visualization, their materialization of abstract information and formation of a mentally suitable schema. There are studies in the literature which agree with this finding. These studies found that mathematics success increased in parallel in students whose VMLSE perceptions were improved (Sengul et al., 2012), as perceived mathematics success score increased, VMLSE perception level decreased (Tutkun et al., 2014), VMLSE perception was a significant predictor of mathematics success (Bekdemir & Duran, 2012; Duran, 2011). Moreover, Ozgen and Bindak (2011) found that mathematics grades were a significant predictor of mathematics literacy self-efficacy beliefs. In another study, it was observed that teaching carried out with the realistic mathematics education approach increased mathematics success and improved VMLSE perceptions in a positive direction (Cilingir & Artut, 2016). It may be expected that students with higher VMLSE perceptions may have increased success in national (MEB and OSYM examinations) and (PISA, TIMMS) platforms.
The VMLSE perceptions of the students who found themselves successful in mathematics were higher than those who found themselves unsuccessful in the study. This finding was in parallel with those of similar studies in the literature. Ozturk and Sahin (2015) reported that the mathematics self-efficacy levels of students with higher average mathematics grades were higher than those with lower grades, and mathematics-related self-efficacy perception was a significant predictor of academic success. Similarly, Ozgen and Bindak (2011) stated that mathematics literacy self-efficacy beliefs of high school students differed significantly based on their mathematics success, and mathematics grades were a significant predictor of mathematics literacy self-efficacy beliefs. From here, it may be stated that, in our study, mathematics course success was a significant predictor (descriptor) of VMLSE perception. That is, perceived high mathematics success may lead to improvement of VMLSE perception. New studies may be conducted on this issue to investigate whether there are other variables that predict VMLSE success. Additionally, it is believed that students will find themselves successful in classroom environments where they are the subjects of their own learning processes, active, inquisitive and questioning, think creatively and critically, feel free and are able to produce ideas.
Another result obtained from the study was that the VMLSE perceptions of the students who stated that they could “always” associate mathematical concepts with daily life were significantly higher than those who stated otherwise. The literature review revealed studies which reported that visuals are important in establishing relations to daily life and individuals who have better perceptions on this issue are more successful in relating mathematics to daily life. Duran (2013) reported that qualities of being able to understand visuals, have visual intelligence, converts visuals to verbal elements and vice versa and utilize visuals in daily life are the fundamental characteristics of individuals who have visual mathematics literacy. Likewise, Baki (1996) stated that close association of activities in the mathematics curriculum and daily life will help students develop positive attitudes towards mathematics. It was stated in the middle school mathematics 5th-8th grades curriculum (MEB, 2013) that learning mathematics is an important tool in daily life. Students encounter various mathematics problems in daily life on different levels of difficulty. Activities to be organized for them to overcome these problems will clearly demonstrate the usage of mathematics in daily life, provide basic concepts and skills and help improve their mathematical thinking and problem-solving skills.
al., 2016). As a result of qualitative findings obtained in this context, the student views were analyzed, firstly the codes for the data were created, and three different themes were determined, where these codes were gathered under a common framework.
The first theme was “the definition of the concept of VMLSE perception”. There were 5 codes for this theme. The most frequently preferred codes in order of frequency were; instruction of mathematics with the help of visuals, usage of geometrical shapes and charts, and instruction of mathematics using images. The reason for this may be that the students though mathematics should be instructed with the help of visuals, geometrical shapes, charts and images should be integrated in the education process. The MEB (2013) curriculum also indicated that usage of visuals in the process of mathematics education may result in transferring abstract information in a tangible way.
The second theme was “the characteristics of those with VMLSE perception”. There were 6 codes for this theme. The most frequently preferred codes in order of frequency were; they are knowledgeable in the field of mathematics and take pleasure from mathematics, they are able to understand and interpret visuals, and they are able to easily solve problems related to visuals. The reason for this may be the students thought that inclusion of visually-oriented activities in mathematics classes may make their learning processes more effective, permanent and fun. Nevertheless, the reasons for student to not like mathematics, not understand it easily and find it boring and complicated include that is it not a tangible, material, but abstract subject (Kog & Baser, 2011). Thus, it may be stated that being able to understand the visuals used in mathematics and use and interpret them in the process of teaching mathematics will save of from being boring and make it more fun (Tekin & Tekin, 2004).
The third and last theme was “the effect of VMLSE perception on mathematics success”. There were 3 codes for this theme. These were preferred in order of frequency as; having VMLSE perception affects mathematics success positively, it does not affect it, and it affects it negatively. That is, the vast majority of the students thought that VMLSE perception affects mathematics success positively. It is possible to find studies that agreed with this finding in the literature (Pajares & Miller 1994; Sengul et al., 2012; Tutkun et al., 2014).
Limitations
Most studies on VMLSE perception focused on middle school students as their target audience and used the scale developed by Bekdemir and Duran (2012). The VMLSE perception scale is a self-report questionnaire, and it has only been used in the Turkish context, but this instrument has not been used in an international context so far. Other limitations of this study include selection of the sample from among eighth-grade middle school students, usage of the same scale as other studies and selection of independent variables of gender, success, final grade, ability to relate mathematical concepts to daily life.
It may be stated as a result of the quantitative findings of the study that the VMLSE perceptions of the participant students were high and their views on these perceptions were significant. Additionally, there were significant differences in the VMLSE perceptions of the students in terms of their final grades, finding themselves successful in the field of mathematics and their ability of relating mathematical concepts to daily life, while the difference in terms of gender was not significant. As a result of the analysis on the qualitative data in the study, the students found the opportunity to think about the concept of VMLSE perception in more detail while establishing definitions on this concepts and characteristics of people who have VMLSE perception. Likewise, the students thought that having VMLSE perception would affect mathematics success positively. As a result of the findings of this study, the following recommendations may be provided for future research: 1)Researchers who will study VMLSE perception may be recommended to conduct their studies in different locations, with different samples (such as highly talented students) chosen with different sampling methods, with a new measurement tool that they would develop themselves, and even different independent variables, 2)VMLSE perception may be studies with experimental studies where teaching processes are carried out, 3)VMLSE perception may be studies with studies including more than one levels of education.
References
Altun, A. (2003). E-literacy. National Education Journal, 158. Retrieved from
http://dhgm.meb.gov.tr/yayimlar/dergiler/Milli_Egitim_Dergisi/158/altun.htm
Askar, P., & Umay, A. (2001). Perceived computer self-efficacy of the students in the elementary mathematics teaching programme. Hacettepe University Journal of Education, 21, 1-8.
Askar, P. (2015, May). Literacy as complex and dynamic concept.Paper presented at the Turkish Computer and Math Teaching 2 Symposium, Adiyaman University, Adiyaman, Turkey.
Ayguner, E. (2016). A comparison of eight grade students’ self-efficacy perception of visual Mathematics (Unpublished master’s thesis). Osmangazi University, Eskisehir, Turkey.
Bekdemir, M., & Duran, M. (2012). Development of a visual math literacy self-efficacy perception scale (VMLSEPS) for elementary students. Ondokuz Mayis University Journal of Faculty of Education, 31(1), 89-115.
Birgin, O., & Gulbez, B. (2014). Investigation of 6th-8th grade middle school students' visual mathematics literacy self-efficacy perception. Paper presented at the 11th National Congress, Cukurova University, Adana, Turkey.
Buyukozturk, S., Kilic-Cakmak, E., Akgun, O. E., Karadeniz, S., & Demirel, F. (2016). Scientific research methods. Ankara: Pegem Akademi.
Chaput, H. H. (2001). Post-piagetian constructivism for grounded knowledge acquisition. Proceedings of the AAAI Spring Symposium on Grounded Knowledge. California, CA: Palo Alto.
Creswell, J. W. (2007). Research design: Qualitative, quantitative, and mixed methods approaches. London: Sage.
Celik, H. C., Bindak, R., & Ozdemir, F. (2018). Development of a visual mathematics literacy scale and investigation of visual mathematics literacy perception according to various variables. In Y.K. Yeke, T. Yazıcı & O. Hayırlı (Eds.), Innovative Approaches in Educational Sciences (pp.63-76). Ankara: Gece Academy.
Cilingir, E. (2015). The effect of the realistic mathematic education (RME) approach on visual math literacy self-efficacy perceptions and problem-solving achievement of 4th grade students (Unpublished master’s thesis). Cukurova University, Adana, Turkey.
Cilingir, E., & Artut, P. D. (2016). The effects of realistic mathematics education based instruction in the elementary mathematics curriculum on the mathematics achievement, Visual Mathematics Literacy Self Efficiency Perceptions and Mathematics Problem Solving Attitude. Turkish Journal of Computer and Mathematics Education, 7(3), 578-600 Cimen, E.E., & Ayguner, E. (2018). An analysis of eight grade students’ self-efficacy perception of visual mathematics
literacy and their actual performance. Elementary Education Online, 17(2), 675-696. Debes, J. L. (1968). Some foundations for visual literacy. Audiovisual Instruction, 13 (9), 961-964.
Deveci, O., & Karademir, C. A. (2018). Middle school students’ math report level and visual math literacy self-efficacy perceptions. Journal of Education, Theory and Practical Research, 4(3), 33-49.
Duran, M. (2011). Relationship between visual math literacy self-efficacy perceptions with visual mathematics achievements of elementary 7th grade students (Unpublished master’s thesis). Erzincan University, Erzincan, Turkey.
Duran, M. (2013). Opinions of 7th grade primary school students about visual mathematical literacy. Mehmet Akif Ersoy University Journal of Education, 2(2), 38-51.
Duran, M., & Bekdemir, M. (2013). Evaluation of visual math literacy self-efficacy perception with visual mathematics accomplishment. Pegem Journal of Education & Instruction, 3(3), 27-40
Feinstein, H., & Hagerty, R. (1994). In visual literacy in the digital age. Paper presented at the 25th annual conference of the International Visual Literacy Association, New York, USA.
Fraenkel, J. R., Wallen, N. E., & Hyun, H. H. (2011). How to design and evaluate research in education. New York, NY: McGraw-Hill.
Gocer, A., & Tabak, G. (2013). Perceptions of teacher candidates about the concept of visual literacy. Adiyaman University Journal of Social Sciences, 6(11), 517-541
Ilhan, A., Celik, H. C., & Pocan, S. (2016). Math and visual mathematical literacy a compilation study. Proceedings of International Engineering, Science and Education Conference (pp. 20-34). Diyarbakir: INESEC.
Ipek, I. (2003). Computers, visual design and visual learning strategies. The Turkish Online Journal of Educational Technology, 2(3), 68-76.
Kaptan, F., & Korkmaz, H. (2002, September). The effect of problem based learning approach on problem solving skills and self-efficacy beliefs of pre-service science teachers. Paper presented at the 5th National Science and Mathematics Education Congress, Ankara, Turkey.
Kayis, A. (2005). Reliability analysis. In S. Kalayci (Ed.), Multivariate statistical techniques with SPSS applied (pp. 404-409). Ankara: Asil Yayin Dagitim.
Kog, O.U., & Baser, N. (2011). The effect of visualization approach on learned helplessness and abstract thinking in Mathematics. Western Anatolian Journal of Educational Sciences (BAED), 1(3), 89-108.
Kose, E. (2014). Scientific research models. In R. Kincal (Ed.), Scientific research methods (pp. 110-123). Ankara: Nobel Press.
MEB. (2013). Middle school mathematics course curriculum. Retrieved from http://ttkb.meb.gov.tr/program2.aspx/program2.aspx?islem=1vekno=215
Miles, M. B., & Huberman, A. M. (1994). Qualitative data analysis. California: Sage Publications. NCTM. (2009). Mission, vision and priorities. Retrieved from http://www.nctm.org
OECD. (2003). The PISA 2003 assessment framework – mathematics, reading, science and problem-solving knowledge and skills. Paris: OECD. Retrieved from http://www.oecd.org/
OME. (2014). Leading math success: Mathematical literacy grades 7–12. The report of the expert panel on student success in Ontario. Retrieved from http://www.edu.gov.on.ca/eng/document/reports/numeracy/numeracyreport.pdf Ozdemir, F., Duran, M., & Kaplan, A. (2016). Investigation of middle school students’ self-efficacy perceptions of visual
mathematics literacy and perceptions of problem-solving skill. Journal of Theoretical Educational Science, 9(4), 532-554. doi: http://dx.doi.org/10.5578/keg.27822
Ozgen, K., & Bindak, R. (2008). The development of self-efficacy scale for mathematics literacy. Kastamonu Education Journal,16(2), 517-528.
Ozgen, K., & Bindak, R. (2011). Determination of self-efficacy beliefs of high school students towards math literacy. Educational Sciences: Theory and Practice, 11(2), 1073-1089.
Ozturk, Y. A., & Sahin, C. (2015). Determining the relationships between academic achievement, self-efficacy and attitudes towards maths. International Journal of Social Science, 31, 343-366. doi:10.9761/JASSS2621.
Quinnell, L. (2014). Enhancing the teaching and learning of mathematical visual images. Australian Mathematics Teacher, 70(1), 18-25
Pajares, F. M., & Miller, D. (1994). Role of self-efficacy and self-concept beliefs in mathematical problem solving: A path analysis. Journal of Educational Psychology,86(2), 193-203
Saban, A. (2008). Metaphors about school. Educational Administration: Theory and Practice,14(3), 459-496
Schulz, W. (2005). Mathematics self-efficacy and student expectations: Results from PISA 2003. Paper presented at the annual meetings of the American Educational Research Association, Montreal.
Senemoglu, N. (2009). Development, learning and teaching: From theory to practice. Ankara: Gazi Bookstore.
Sengul, S., Katranci, Y., & Gulbagci, H. (2012, September).Examination of visual mathematics literacy self-efficacy perceptions of 5-6-7-8th grades primary school students. Paper presented at the 21st National Congress of Educational Sciences. Marmara University, Istanbul, Turkey.
Sengul, S., Kaba, Y. & Ozdisci, S. (2017). Investigation of middle school students’ visual math literacy self-efficacy perceptions. New Trends and Issues Proceedings on Humanities and Social Sciences, 4(1), 454- 461.
Tanoglu, S., Taskesen, O., Bakirhan, A., & Taskesen, P. (2017). Investigating the relationship between three dimensional objects drawing achievement and visual mathematical literacy self-efficacy perceptions of 5th, 6th and 7th graders. Journal of Strategic Research in Social Science, 3(2), 29-40
Tekin, B., & Tekin, P. (2004). A research on the mathematical literacy levels of mathematics teacher candidates. Retrieved from www.matder.org.tr.
Tekin, H. (2009). Measurement and evaluation in education. Ankara: Yargi Publications.
Tutkun, O. F., Edogan, D. G, & Ozturk, B. (2014). Levels of visual mathematics literacy self-efficacy perception of the secondary school students. Middle Eastern and African Journal of Educational Research, 8, 19-27.
U.S. Department of Education (2014). STEM literacy. Retrieved from https://www.y4y.ed.gov/learn/stem/introduction/stem-literacy
Yaman, P., Cansungu, O., & Altuncekic, A. (2004). A research on the investigation of the self-sufficiency belief levels of the science education teacher candidates. The Journal of Turkish Educational Sciences, 2(3), 355-364.