This work is licensed under a Creative Commons Attribution 4.0 International License.
Original article
Scand J Work Environ Health Online-first -article
doi:10.5271/sjweh.3781
Exposure to loud noise and risk of vestibular schwannoma: results from the INTERPHONE international case‒control study by Deltour I, Schlehofer B, Massardier-Pilonchéry A, Schlaefer K,
Armstrong B, Giles GG, Siemiatycki J, Parent M-E, Krewski D, McBride M, Johansen, Auvinen A, Salminen T, Hours M, Montestrucq L, Blettner M, Berg-Beckhoff G, Sadetzki S, Chetrit A, Lagorio S, Iavarone I,
Yamaguchi N, Takebayashi T, Woodward A, Cook A, Tynes T, Klaeboe L, Feychting M, Lönn S, Fleming S, Swerdlow AJ, Schoemaker MJ,
Moissonnier M, Kesminiene A, Cardis E, Schüz J; INTERPHONE Study Group
Conflicting results have been obtained about the association between exposure to occupational loud noise and risk of vestibular schwannomas (acoustic neuromas). In the largest case-control study conducted to date on this tumor, consistent associations have been observed with self-reported loud noise exposure.
Affiliation: International Agency for Research on Cancer (IARC), Lyon, France. DeltourI@iarc.fr
Key terms: acoustic neuroma; case‒control study; epidemiology;
exposure; international; INTERPHONE; loud noise; noise; noise exposure; vestibular schwannoma
This article in PubMed: www.ncbi.nlm.nih.gov/pubmed/30614502
Additional material
Please note that there is additional material available belonging to this article on the Scandinavian Journal of Work, Environment & Health
O
riginal article
Scand J Work Environ Health – online first. doi:10.5271/sjweh.3781
Exposure to loud noise and risk of vestibular schwannoma: results from the
INTERPHONE international case‒control study
by Isabelle Deltour, PhD,1 Brigitte Schlehofer, MD,2 Amélie Massardier-Pilonchéry, MD,3 Klaus Schlaefer, MSc,2 Bruce Arm-strong, PhD,4 Graham G Giles, PhD,5 Jack Siemiatycki, PhD,6 Marie-Elise Parent, PhD,7 Daniel Krewski, PhD,8 Mary McBride, MD,9 Christoffer Johansen, MD,10, 11 Anssi Auvinen, MD,12 Tiina Salminen, PhD,12 Martine Hours, MD,3 Lucile Montestrucq,3 Maria Blettner, PhD,13 Gabriele Berg-Beckhoff, PhD,14 Siegal Sadetzki, MD,15 Angela Chetrit, MSc,15 Susanna Lagorio, MD,16 Ivano Iavarone, MD,17 Naohito Yamaguchi, MD,18 Toru Takebayashi, MD,19 Alistair Woodward, PhD,20 Angus Cook, MBChB,20 Tore Tynes, PhD,21 Lars Klaeboe, PhD,22 Maria Feychting, PhD,23 Stefan Lönn, PhD,24 Sarah Fleming, PhD,24 Anthony J Swerdlow, DSc,25 Minouk J Schoemaker, PhD,25 Monika Moissonnier, MSc,1 Ausrele Kesminiene, MD,1 Elisabeth Cardis, PhD,26 Joachim Schüz, PhD,1 for the INTERPHONE Study Group.
Deltour I, Schlehofer B, Massardier-Pilonchéry A, Schlaefer K, Armstrong B, Giles GG, Siemiatycki J, Parent, M-E, Krewski D,
McBride M, Johansen C, Auvinen A, Salminen T, Hours M, Montestrucq L, Blettner M, Berg-Beckhoff G, Sadetzki S, Chetrit A,
Lagorio S, Iavarone I, Yamaguchi N, Takebayashi T, Woodward A, Cook A, Tynes T, Klaeboe L, Feychting M, Lönn S, Fleming S,
Swedlow AJ, Schoemaker MJ, Moissonnier M, Kesminiene A, Cardis E, Schüz, J, for the INTERPHONE Study Group. Scand J Work Environ Health – online first.
Objective Studies of loud noise exposure and vestibular schwannomas (VS) have shown conflicting results. The population-based INTERPHONE case‒control study was conducted in 13 countries during 2000–2004. In this paper, we report the results of analyses on the association between VS and self-reported loud noise exposure.
Methods Self-reported noise exposure was analyzed in 1024 VS cases and 1984 matched controls. Life-long noise exposure was estimated through detailed questions. Odds ratios (OR) and 95% confidence intervals (CI) were estimated using adjusted conditional logistic regression for matched sets.
Results The OR for total work and leisure noise exposure was 1.6 (95% CI 1.4–1.9). OR were 1.5 (95% CI 1.3–1.9) for only occupational noise, 1.9 (95% CI 1.4–2.6) for only leisure noise and 1.7 (95% CI 1.2–2.2) for exposure in both contexts. OR increased slightly with increasing lag-time. For occupational exposures, duration, time since exposure start and a metric combining lifetime duration and weekly exposure showed significant trends of increasing risk with increasing exposure. OR did not differ markedly by source or other characteristics of noise.
Conclusion The consistent associations seen are likely to reflect either recall bias or a causal association, or potentially indicate a mixture of both.
Key terms acoustic neuroma; epidemiology; noise exposure.
1 International Agency for Research on Cancer (IARC), Lyon, France.
2 Unit of Environmental Epidemiology, German Cancer Research Center, Heidelberg, Germany.
3 Université de Lyon, Institut Francais des Sciences et Technologies des Transports de l’Aménagement et des Réseaux, Unité Mixte de Recherche Epidémiologique et de Surveillance Transports Travail Environnement T9405, Lyon, France.
4 School of Public Health, The University of Sydney, Sydney, Australia. 5 Cancer Epidemiology Centre, Cancer Council Victoria, Melbourne, Australia. 6 University of Montreal School of Public Health, Montreal, Canada. 7 INRS-Institut Armand-Frappier, University of Quebec, Canada.
8 McLaughlin Centre for Population Health Risk Assessment, University of Ottawa, Ottawa, Canada. 9 British Columbia Cancer Research Centre, British Columbia Cancer Agency, Vancouver, Canada. 10 Survivorship Research Unit, The Danish Cancer Society Research Centre, Copenhagen, Denmark. 11 Late Effect Research Unit CASTLE, Finsen Center, Copenhagen, Denmark.
12 STUK - Radiation and Nuclear Safety Authority, Helsinki, Finland.
18 Department of Public Health, Tokyo Women’s Medical University School of Medicine, Tokyo, Japan. 19 Department of Preventive Medicine and Public Health, Keio University School of Medicine, Tokyo, Japan. 20 Department of Public Health, University of Otago Wellington, New Zealand.
21 Norwegian Radiation Protection Authority, Østerås, Norway. 22 The Cancer Registry of Norway, Oslo, Norway.
23 Institute of Environmental Medicine, Karolinska Institutet, Stockholm, Sweden. 24 School of Medicine, University of Leeds, Leeds, UK.
25 The Institute of Cancer Research, London, UK.
26 ISGlobal, Barcelona Institute for Global Health, Barcelona, Spain.
The INTERPHONE Study Group includes in addition: IARC: MVrijheid (now at: Centre for Research in Environmental Epidemiology,
Barcelona, Spain; Universitat Pompeu Fabra, Barcelona ; CIBER Epidemiologia y SaludPública, Madrid, Spain), A-S.Evrard (now at:
UMRESTTE (Unité Mixtede Recherche Epidémiologique et de Surveillance Transport, IFSTTAR, Bron, France), MSanchez (now at:
Centre de Recherche en Epidémiologie des Populations, Villejuif, France) ; Sydney Cancer Centre and School of Public Health, The Uni
-versity of Sydney, Sydney, Australia (J Brown); INRS-Institut Armand-Frappier, University of Quebec, Laval, Canada (L Nadon); Institute
of Cancer Epidemiology, Danish Cancer Society, Copenhagen, Denmark (HC Christensen now at: Department of Audiology, University Hospital of Copenhagen, Denmark); STUK - Radiation and Nuclear Safety Authority, Helsinki (PKurttio, A Lahkola); Université de Lyon,
Institut National de Recherche sur les Transports et leur Sécurité, Institut de Veille Sanitaire, Unité Mixte de Recherche épidémiologique et de Surveillance Transports Travail Environnement T9405, Lyon, France (M Bernard now at: Observatoire Régional de la Santé
Rhone-Alpes, Lyon, France); Cancer & Radiation Epidemiology Unit, Gertner Institute, Chaim Sheba Medical Center, Tel-Hashomer, Israel (A
Jarus-Hakak); Department of Public Health, University of Otago Wellington, New Zealand (N Pearce now at London School of Hygiene
and TropicalMedicine, London, UK); Norwegian Armed Forces Medical Services, Sessvollmoen, Norway (K Blaasaas now at: Finance Norway, Oslo, Norway); Institute of Environmental Medicine, Karolinska Institutet, Stockholm Sweden (A Ahlbom); School of Medicine,
University of Leeds, Leeds, UK (Patricia AMcKinney, now: retired); The Health Sciences Research Institute, University of Warwick,
Coventry, UK (KRMuir)
Correspondence to: Isabelle Deltour, International Agency for Research on Cancer (IARC), Lyon, France. [E-mail: DeltourI@iarc.fr]
Vestibular schwannoma (VS) or acoustic neuroma is
a very rare, mostly benign tumor developing from the Schwann cells of the sheath of the eighth cranial nerve. It constitutes about 5–6% of all intra-cranial tumors and about 80% of cerebello-pontine angle tumors (1, 2). Incidence rates vary by country, ranging between 0.6‒1.1 per 100 000 person-years, with similar rates in
men and women (3, 4).
Most VS are non-familial and unilateral (5). Neu
-rofibromatosis type 2, an autosomal dominant disease related to mutations in the NF2 gene, is associated with
a small proportion of VS often with bilateral presenta-tion (1). Other than elevated risks from exposure to high levels of ionizing radiation (6, 7), little is known about other exogenous risk factors that may be involved in the etiology of VS. Epidemiological investigations of smok
-ing habits, occupations and occupational exposures, sociodemographic factors, cellular phone use, hormones, and allergic diseases have so far not established addi
-tional determinants of VS risk (8–19).
A possible association between loud noise
expo-sure and VS has been investigated by several studies, with inconsistent findings (20–30). Of these, analyses
based on self-reported exposures to noise have shown
an increased odds ratio (OR) (24, 25, 27). Results for analyses combining self-reported occupational calendars with exposure levels from job-exposure matrices (JEM) have been inconsistent (22, 28). No association was seen
in a large Swedish record linkage-based case–control
study applying a noise-measurement based JEM (26).
The INTERPHONE study is an international
multi-center case–control study involving 13 countries, coor
-dinated by the International Agency for Research on Cancer (IARC), Lyon (29). The main goal of INTER
-PHONE was to explore cellular telephone use as a possi
-ble risk factor for central nervous system tumors includ
-ing VS (13, 29); additionally, participants were asked about other exposures and life events, such as ionizing radiation, occupational and medical history, and, for VS, exposure to loud noise. Country-specific analyses of loud noise and VS risk have already been published for three INTERPHONE countries: Sweden, Germany and France (24, 25, 27). Some previous INTERPHONE
publications used the term acoustic neuroma to refer to
the same tumor here referred to as VS.
This report presents the results of the analyses of the
association between vestibular schwannoma and
self-reported loud noise exposure using the pooled multi-center INTERPHONE study, totaling 1024 VS cases and their 1984 matched controls.
Methods
Study design
Sweden, and the UK) using a common core study protocol. Fieldwork was conducted between 1999 and 2005. Detailed descriptions of study methods have been
reported elsewhere (14, 29, 30).
Participants
For the present analysis, we focussed on patients diag
-nosed with a schwannoma of the acoustic nerve (ICD-9 code 225.1, ICD-10 code D33.3, or ICD-O topography code C72.4 and morphology code 9560/0). Eligible cases were aged 30–59 years at diagnosis of VS and resident in the study regions during the study period of 2‒4 years, depending on the center. Cases were ascertained mainly from neurological and neurosurgical facilities, from otorhino-laryngological units and local cancer registries. All diagnoses were either histologically confirmed or based on unequivocal diagnostic imaging. Ascertain
-ment was done actively within treat-ment facilities. Completeness of ascertainment was checked through secondary sources, such as population- or hospital-based cancer registries, medical archives, pathological depart
-ment files and hospital discharge or billing files. Two controls were randomly selected for each case from the locally most appropriate population-based sam
-pling frame, mainly population resident registries. Con
-trols were either individually matched on age and sex, and, in Israel, on ethnic origin, or frequency matched during sampling with post hoc individual matching after ascertainment. In this report, we used the same sets of matched triplets as in the previously published analyses on VS and cellular telephone use (14), and the same reference dates, which, for cases, were the dates
of diagnosis, and, for controls, the dates of diagnosis of their matched case.
Data collection
Participants were mainly interviewed in person (>99% cases, >99% controls) and face-to-face (95% cases, 94% controls). Computer-assisted personal interviews were conducted in all centers except Finland. Cases were interviewed on average 9.8 months after diagnosis, and controls were interviewed 3.4 months later than cases, on average.
Participants were asked a sequence of screening, and, if applicable, detailed questions about their lifetime exposure to loud noise at work, in leisure and from the environment (see supplementary material, www.sjweh.
fi/show_abstract.php?abstract_id=3781). In Canada,
France and Sweden, participants were shown a diagram of sound levels to assist them in answering the ques
-tions. In Japan, participants were not systematically asked all questions concerning loud noise at work; there
-fore, the 82 cases and 137 controls from this country
were excluded from this report.
In addition, the questionnaire included sections on sociodemographic factors (marital status, educational level), smoking habits, and presence of medical condi
-tions including hearing loss, tinnitus (defined as serious buzzing or ringing in the ears), diagnosed neurofibroma
-tosis and tuberous sclerosis.
Statistical methods
Conditional logistic regression for matched sets (two controls per case) was used to estimate OR and their 95% confidence intervals (CI). Analyses were conducted with and without adjustment for the following potential confounders: educational level, marital status and smok
-ing patterns (never, past, current smoker). The results of the adjusted analyses were reported throughout; the differences between adjusted and unadjusted estimates were ≤0.1, except for center-specific results and results stratified by hearing symptoms. When numbers permit
-ted, OR were calculated for men and women separately. Analyses were performed separately for exposure at work and during leisure time, as well as for total exposure with exposure lagged by periods of 1, 5 and 10 years prior to the reference date. These lag periods (ie, latency period between exposure and disease) have been previously used in analyses of VS risk in the INTERPHONE study. The reference group consisted of participants who did not report that they had been exposed to loud noise up to 1 year before their reference date, at work, during leisure time, or both as appropriate. Living for >10 years in a noisy environment was also investigated in relation to VS risk.
Continuous variables, derived from the subject responses, were categorized into tertiles, and rounded as follows: time since first exposure (<20, 20–29, ≥30 years), duration of exposure (0–5, 6–19, ≥20 years) and age at first exposure (≤18, 19–24, ≥25 years old). When
linear trend tests on ordered variables were performed,
the non-exposed subgroup was the reference (coded 0) and the exposed categories were coded 1, 2, or 3. Amount of exposure was evaluated by combining the frequency (hours per week) and duration (years) of exposure.
Following Edwards and colleagues (23), sources of
noise were categorized by an occupational physician from UMRESTTE, Lyon, France, expert in noise assess
-ment, as follows: construction work, machines, power tools; motors (airplanes, car racing); music (including employment in music industry); high-volume noise from humans (such as shouting or yelling at sports events, or day care centers) or animals (such as cattle); shooting or
explosions; mixed sources, (ie, noise exposure histories with more than one of the previous sources); and other
-tion). The last category included sources that could not be classified due to imprecision or that were evaluated as leading to exposures <80 acoustic decibels but had been reported by the interviewee as loud noise.
Participants with missing values for the exposure variables were excluded from analyses, which could lead to exclusion of their matched controls or case. Missing values for adjustment variables constituted a separate category.
Sensitivity analyses were carried out: (i) with the reference category including only participants explicitly stating that they had never been exposed to loud noise and no lag period (ii) with a lag period of 5 years; (iii) excluding telephone and proxy interviews; (iv) exclud
-ing persons with co-morbidity of neurofibromatosis or tuberous sclerosis, or bilateral tumors, given that their exposure disease association might differ from that of the rest of the population; (v) stratified according to the case’s type of auditory symptoms (no symptom, hear
-ing loss only, or tinnitus with or without hear-ing loss), as these may impact participants’ noise perception and recall; and (vi) treating periods of exposure during which protective equipment was used most of the time as unexposed time.
The ethics committees of all involved centers and of the IARC approved this study. Informed consent was obtained from all study participants. The authors fol
-lowed the Declaration of Helsinki’s principles.
Results
Altogether 1279 VS cases were eligible for this study, of whom 146 declined to participate in the interview, 5 had died or were too ill to undertake an interview and no proxy could be found, 12 were not approached as requested by their treating physician, and 12 did not speak the respective center-specific interview languages. In addition, research teams could not trace 46 cases and 6 were not interviewed for other reasons, leaving 1052 cases completing the interview (82% participation). Among eligible controls, 53% participated, 30% refused and 17% did not participate for other reasons. In addition, 16 cases for whom no matching control was found, 9 who were not asked the loud noise questions, 3 who did not know if they had ever been exposed to loud noise, and their 20 matched controls could not be included, leav
-ing 1024 VS cases and 1984 controls for analyses of the associations between VS and noise exposure.
Most VS were histologically verified (76% of the interviewed cases), with 17% diagnosed by imaging only (computed tomography or magnetic resonance imaging scans). All but three tumors were unilateral. The
occurrence of VS was comparable on both sides of the
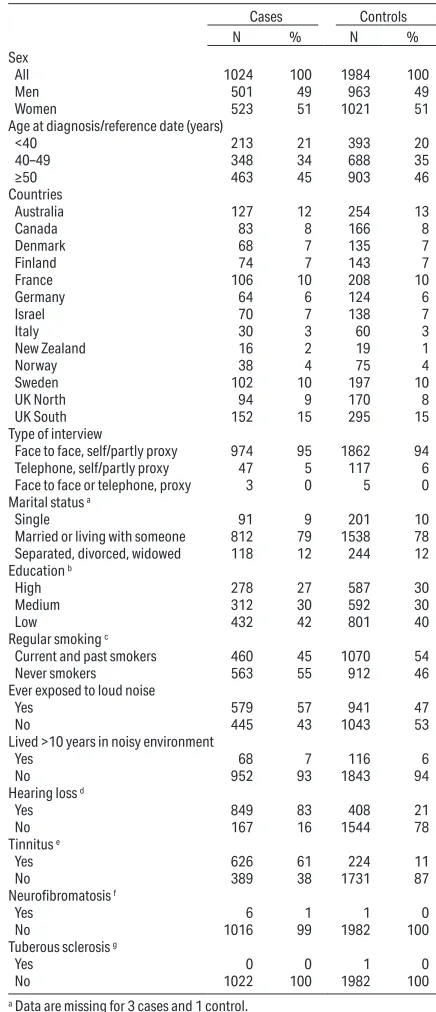
Table 1. Distributions of selected characteristics of vestibular schwan-noma cases and controls in the risk analyses of loud noise exposure: International Interphone Study, 2000–2004.
Cases Controls
N % N %
Sex
All 1024 100 1984 100
Men 501 49 963 49
Women 523 51 1021 51
Age at diagnosis/reference date (years)
<40 213 21 393 20
40–49 348 34 688 35
≥50 463 45 903 46
Countries
Australia 127 12 254 13
Canada 83 8 166 8
Denmark 68 7 135 7
Finland 74 7 143 7
France 106 10 208 10
Germany 64 6 124 6
Israel 70 7 138 7
Italy 30 3 60 3
New Zealand 16 2 19 1
Norway 38 4 75 4
Sweden 102 10 197 10
UK North 94 9 170 8
UK South 152 15 295 15
Type of interview
Face to face, self/partly proxy 974 95 1862 94 Telephone, self/partly proxy 47 5 117 6
Face to face or telephone, proxy 3 0 5 0
Marital status a
Single 91 9 201 10
Married or living with someone 812 79 1538 78 Separated, divorced, widowed 118 12 244 12
Education b
High 278 27 587 30
Medium 312 30 592 30
Low 432 42 801 40
Regular smoking c
Current and past smokers 460 45 1070 54
Never smokers 563 55 912 46
Ever exposed to loud noise
Yes 579 57 941 47
No 445 43 1043 53
Lived >10 years in noisy environment
Yes 68 7 116 6
No 952 93 1843 94
Hearing loss d
Yes 849 83 408 21
No 167 16 1544 78
Tinnitus e
Yes 626 61 224 11
No 389 38 1731 87
Neurofibromatosis f
Yes 6 1 1 0
No 1016 99 1982 100
Tuberous sclerosis g
Yes 0 0 1 0
No 1022 100 1982 100
a Data are missing for 3 cases and 1 control.
b High=university or postgrad. Univers.; medium= secondary/professional/
high level techn. school; low= 3yr techn. training or secondary school; (cat
-egories are country-specific, presented in details elsewhere(29)); data are missing for 2 cases and 4 controls.
head (50% on the left versus 47% on the right); laterality information was missing for 3% of eligible cases.
Selected characteristics of cases and controls are presented in table 1; 49% of the cases were men, 51% were women, and approximately equal numbers < and >50 years old. The percentage of subjects contributed by different centers varied from 2% in New Zealand to 15% in Southern UK. There were more smokers among con
-trols (54%) than cases (45%). The proportion of con-trols having the highest educational level was hardly higher than for cases (30% among controls, 27% among cases).
Auditory symptoms were common amongst cases with 83% of cases reporting hearing loss and 61% tin
-nitus. Symptoms were markedly less common among controls, with 21% reporting hearing loss and 11% tinnitus. Six cases and one control reported having neurofibromatosis, and one control reported having tuberous sclerosis. In reponse to the question "have you ever been exposed to loud noise?" 579 cases (56.5%) and 941 controls (47.4%) responded in the affirmative, giving an OR of 1.5 (95% CI 1.3–1.8). Living for >10 years in a noisy environment showed an adjusted OR of 1.2 (95% CI 0.9–1.7).
Table 2 presents the sex-specific results for reported occupational and leisure noise exposure, separately and combined, for different lag periods. The OR for total exposure was 1.6 (95% CI 1.4–1.9) using a 1-year lag; for 5- and 10-years lag periods, OR of 1.6 (95%CI 1.4–1.9) and 1.7 (95%CI 1.4–2.1) were observed. Using a 1-year lag, the OR associated with only occupational noise was 1.5 (95% CI 1.3–1.9), with only leisure noise
1.9 (95% CI 1.4–2.6), and with both, 1.7 (95% CI 1.2– 2.2). The OR were slightly higher for longer lags among women or when disregarding exposure during periods of use of protective equipment (not shown), though the respective confidence intervals overlapped substantially. Associations were similar amongst men and women.
Analyses of the associations between VS and occu -pational noise are presented in tables 3 and 4, and in
supplemental figure 1 (www.sjweh.fi/show_abstract.
php?abstract_id=3781). Compared to participants hav
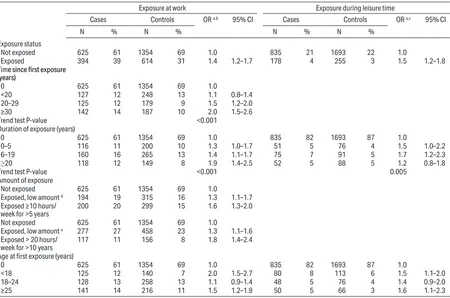
-ing no occupational noise exposure, OR increased slightly with increasing lag time, with an OR of 1.6 (95% CI 1.3–1.9) for 10-years lag time (data not shown). They also increased with increasing time since first exposure (P<0.001), duration of exposure (P<0.001) giving, for ≥20 years of exposure, an OR of 1.9 (95% CI 1.4–2.5), and with amount of exposure. In nearly all center-specific analyses, OR increased with increasing time since first exposure (supplemental figure 1A, www.sjweh.fi/show_ abstract.php?abstract_id=3781) but not with duration
(supplemental figure 1B, www.sjweh.fi/show_abstract.
php?abstract_id=3781). All sources of occupational
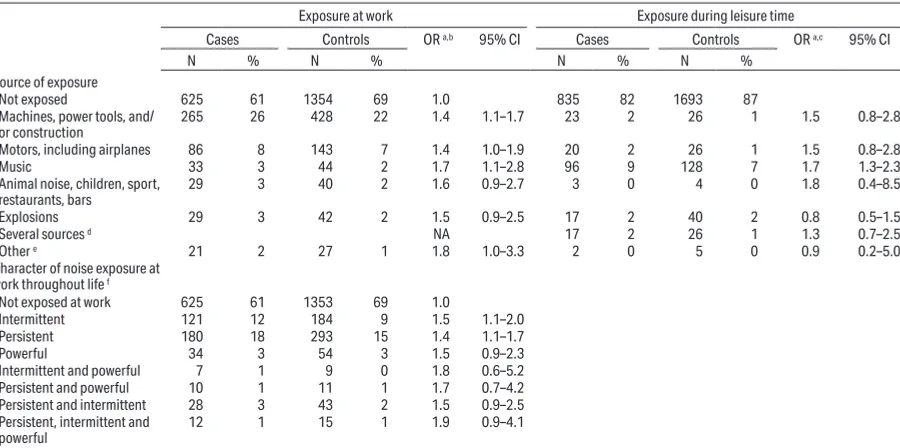
noise were associated with OR of similar magnitude, between 1.4‒1.8 (table 4). Likewise, self-reported expo -sure to “other” sources, which included sources that
experts did not rate as resulting in high noise exposure also produced elevated OR.
Similarly, noise exposure during leisure time activi
-ties showed elevated OR (tables 3 and 4). Compared
with participants who did not mention leisure noise
exposure, OR remained the same with increasing lag
Table 2. Odds ratios (OR) for vestibular schwannoma according to self-reported loud noise exposure at work or during leisure-time activities by gender and lag period: International Interphone Study, 2000–2004. [CI=confidence interval.]
All participants Men Women
Cases
(N=1024) (N=1984)Controls OR
a 95% CI Cases
(N=501) Controls (N=963) OR
a 95% CI Cases
(N=523) (N=1021)Controls OR
a 95% CI
N % N % N % N % N % N %
Work and/or leisure exposure b, c
Not exposed 546 53 1247 63 1.0 192 38 472 49 1.0 354 68 775 76 1.0
Exposed during leisure only 82 8 113 6 1.9 1.4–2.6 44 9 58 6 2.0 1.3–3.2 38 7 55 5 1.6 1.0–2.6 Exposed at work only 296 29 476 24 1.5 1.3–1.9 185 37 324 34 1.5 1.2–2.0 111 21 152 15 1.6 1.2–2.2
Exposed at work and in leisure 98 10 143 7 1.7 1.2–2.2 79 16 106 11 1.9 1.3–2.7 19 4 37 4 1.2 0.7–2.2
Total occupational and leisure
noise by duration of lag period b
Not exposed before 1-year
lag period 546 53 1247 63 1.0 192 38 472 49 1.0 354 68 775 76 1.0 Exposed before 1-year lag
period 476 47 732 37 1.6 1.4–1.9 308 62 488 51 1.7 1.3–2.1 168 32 244 24 1.6 1.2–2.0
Not exposed before 5-year
lag period 563 55 1281 65 1.0 201 40 482 50 1.0 362 69 799 78 1.0 Exposed before 5-year lag
period 459 45 698 35 1.6 1.4–1.9 299 60 478 50 1.6 1.3–2.0 160 31 220 22 1.7 1.3–2.1
Not exposed before 10-year
lag period 586 57 1344 68 1.0 212 42 509 53 1.0 374 72 835 82 1.0 Exposed before 10-year lag
period 436 43 635 32 1.7 1.4–2.1 288 58 451 47 1.6 1.3–2.1 148 28 184 18 1.9 1.4–2.5
a Conditional logistic regression matched by center, age, sex, and adjusted for education, smoking and marital status.
time with an OR of 1.5 for a 10-year lag (data not shown). Although the OR for ≥20 years of leisure noise exposure was 1.2 (95% CI 0.8–1.8), a significant increasing trend (P=0.005) was observed with increasing duration; a similar pattern was seen with time since first exposure. There was little variation in OR according to age at first exposure to leisure noise. Exposure to music was the most commonly reported source of exposure during leisure. It resulted in an OR of 1.7 (95% CI 1.3–2.3). Exposure to noise from motors and tools also resulted in elevated OR. Leisure exposure to explosive noise such as shooting did not show any elevation in the OR (OR 0.8, 95% CI 0.5–1.5). Numbers in all these categories were small, however.
In sensitivity analyses, results did not substantially change when limited to subjects who stated they had
never been exposed to loud noise as the reference
cat-egory, ie, also not exposed during the 1-year lag time, when a 5-year lag was considered, when excluding proxy and telephone interviews, or when excluding
Table 3. Odds ratios (OR) for vestibular schwannoma according to loud noise exposure by exposure status, time since first exposure, duration, amount of exposure and age at first exposure: International Interphone Study, 2000–2004. [CI=confidence interval.]
Exposure at work Exposure during leisure time
Cases Controls OR a,b 95% CI Cases Controls OR a,c 95% CI
N % N % N % N %
Exposure status
Not exposed 625 61 1354 69 1.0 835 21 1693 22 1.0
Exposed 394 39 614 31 1.4 1.2–1.7 178 4 255 3 1.5 1.2–1.8
Time since first exposure (years)
0 625 61 1354 69 1.0
<20 127 12 248 13 1.1 0.8–1.4 20–29 125 12 179 9 1.5 1.2–2.0 ≥30 142 14 187 10 2.0 1.5–2.6
Trend test P-value <0.001
Duration of exposure (years)
0 625 61 1354 69 1.0 835 82 1693 87 1.0
0–5 116 11 200 10 1.3 1.0–1.7 51 5 76 4 1.5 1.0–2.2 6–19 160 16 265 13 1.4 1.1–1.7 75 7 91 5 1.7 1.2–2.3
≥20 118 12 149 8 1.9 1.4–2.5 52 5 88 5 1.2 0.8–1.8
Trend test P-value <0.001 0.005
Amount of exposure
Not exposed 625 61 1354 69 1.0
Exposed, low amount d 194 19 315 16 1.3 1.1–1.7
Exposed ≥10 hours/
week for >5 years 200 20 299 15 1.6 1.3–2.0
Not exposed 625 61 1354 69 1.0
Exposed, low amount e 277 27 458 23 1.3 1.1–1.6
Exposed > 20 hours/
week for >10 years 117 11 156 8 1.8 1.4–2.4 Age at first exposure (years)
0 625 61 1354 69 1.0 835 82 1693 87 1.0
<18 125 12 140 7 2.0 1.5–2.7 80 8 113 6 1.5 1.1–2.0
18–24 128 13 258 13 1.1 0.9–1.4 48 5 76 4 1.4 0.9–2.0 ≥25 141 14 216 11 1.5 1.2–1.9 50 5 66 3 1.6 1.1–2.3
a The reference category consists of subjects who were not exposed 1 year before the reference date. OR from conditional logistic regressions with subjects matched
by center, age and sex, and adjusted for education, smoking, and marital status.
b 5 cases with missing data and their 10 matched controls, and 6 additional controls with missing data were excluded from these analyses.
c 7 cases with missing data including 3 with dates missing, and 4 cases whose matched controls (n=6) had missing data, and 24 controls who did not know (including
4 with dates missing) and 12 controls matched to the cases who did not know were excluded from these analyses.
d The intermediate category consists of subjects who were exposed, but not to ≥10 hours/week for > 5 years. e The intermediate category consists of subjects who were exposed, but not to >20 hours/week for >10 years.
subjects with neurofibromatosis, tuberous sclerosis and bilateral tumors (data not shown).
When compared with their respective controls, the subgroup of cases who reported tinnitus had ele
-vated OR, and strong exposure‒outcome trends (sup
-plementary table S1, www.sjweh.fi/show_abstract.
php?abstract_id=3781). In contrast, equivalent analyses
restricted to cases with hearing loss but no tinnitus and their controls, produced lower OR and inconsistent asso
-ciations; the smaller numbers in the subgroup of cases with normal hearing made these analyses more difficult to interpret. When periods during which the participant reported using hearing protection devices most of the
time were treated as periods of no exposure, similar
In summary, our results are in line with several
publications on self-reported noise exposure and VS in
different study populations (20–22, 28) but were not consistent with studies of occupational noise exposures
assessed by JEM, which did not show such positive
associations (26, 28).
One of the primary strengths of INTERPHONE is its sample size: it is the largest study published to date, in terms of VS case numbers, permitting various strati
-fied analyses to be conducted with reasonable statistical power. All INTERPHONE centers followed a common core study protocol, permitting pooling of the original data. The investigation of heterogeneity across study centers showed a high level of consistency in results. The questionnaire elicited detailed information on loud noise exposure. Another strength of INTERPHONE is its population-based control group, but this approach resulted in lower participation by controls than cases, which is a possible limitation, as it might have intro -duced selection bias (as occurred in relation to previous
results reported for mobile phone use in the same study)
(31). Participation was greater by subjects with a higher
Table 4. Odds ratios (OR) for vestibular schwannoma according to source and characteristics of noise exposure: International Interphone Study, 2000–2004. [CI=confidence interval; NA=not available.]
Exposure at work Exposure during leisure time
Cases Controls OR a,b 95% CI Cases Controls OR a,c 95% CI
N % N % N % N %
Source of exposure
Not exposed 625 61 1354 69 1.0 835 82 1693 87
Machines, power tools, and/
or construction 265 26 428 22 1.4 1.1–1.7 23 2 26 1 1.5 0.8–2.8
Motors, including airplanes 86 8 143 7 1.4 1.0–1.9 20 2 26 1 1.5 0.8–2.8
Music 33 3 44 2 1.7 1.1–2.8 96 9 128 7 1.7 1.3–2.3
Animal noise, children, sport,
restaurants, bars 29 3 40 2 1.6 0.9–2.7 3 0 4 0 1.8 0.4–8.5
Explosions 29 3 42 2 1.5 0.9–2.5 17 2 40 2 0.8 0.5–1.5
Several sources d NA 17 2 26 1 1.3 0.7–2.5
Other e 21 2 27 1 1.8 1.0–3.3 2 0 5 0 0.9 0.2–5.0
Character of noise exposure at
work throughout life f
Not exposed at work 625 61 1353 69 1.0
Intermittent 121 12 184 9 1.5 1.1–2.0
Persistent 180 18 293 15 1.4 1.1–1.7
Powerful 34 3 54 3 1.5 0.9–2.3
Intermittent and powerful 7 1 9 0 1.8 0.6–5.2
Persistent and powerful 10 1 11 1 1.7 0.7–4.2
Persistent and intermittent 28 3 43 2 1.5 0.9–2.5
Persistent, intermittent and
powerful 12 1 15 1 1.9 0.9–4.1
a The reference category consists of subjects who were not exposed 1 year before the reference date. OR from conditional logistic regressions with subjects matched
by center, age and sex, and adjusted for education, marital status and smoking status.
b Multiple assessments are possible. 5 cases with missing data and their 10 matched controls, and 6 additional controls with missing data were excluded. Reference
category: not exposed at work.
c Multiple assessments are not possible. 7 cases with missing data including 3 with dates missing, and 4 cases whose matched controls (n=6) had missing data, and
24 controls who did not know (including 4 with dates missing) and 12 controls matched to the cases who did not know were excluded from this analysis. Reference category: not exposed during leisure time.
d Participants with several exposure sources, except those with one source of exposure and a source classified as “Other”, which were included in the respective
source.
e Left panel: includes occupational exposure reported by subject such as “noise from work”, that could not be categorised more precisely, also includes sources as
-sessed by expert as not leading to occupational loud noise exposure, such as “telephone constantly ringing”. Right panel includes leisure time exposures reported by subject but unclear if exposed, such as “vacuum cleaner”.
f Additional missing data on this variable for 2 cases and 3 controls and 3 matched controls; these subjects were excluded from these analyses.
Discussion
In this study of 30–59-year-old adults, we found consis -tent associations between VS and self-reported exposure to loud noise, with almost all the exposure metrics
considered. For occupational exposures, time since first exposure, duration of exposure, amount of noise exposure, and earlier age at first exposure showed exposure‒response associations; risk estimates did not appear to vary by the source or other characteristics of noise. Similar associations were observed for men and women. The increasing OR by increasing time since first occupational exposure were found in all study centers, although not always at the same magnitude. OR by
duration of exposure were much less consistent across
centers. Associations did not appear to depend much on the choice of lag period (1, 5 or 10 years). Exposure during leisure activities produced similar, but less con -sistent associations than occupational exposures, except
level of education, which may be associated with less occupational noise exposure. Although the analyses were adjusted for education to limit the effect of the potential selection bias on the results, the possibility of a residual spurious increase of the OR remains.
The most likely explanations, however, of the ele
-vated OR in our study is that either they reflect a true
causal relationship between VS and loud noise exposure
or that they are due to recall bias. Although a mix of these explanations is also a possibility, for clarity, we will discuss them separately as competing explanations.
Recall bias is a highly plausible explanation of the elevated OR. In two validation studies conducted within the German and French VS cases and controls of INTERPHONE, self-reported occupational noise exposure was compared to objective noise assessment. The occupational histories combined with JEM- or expert evaluation of noise levels showed satisfactory but not very good agreement with the self-reported occupational noise exposures in the 285 German and 328 French participants (Kappa coefficients of agree
-ment of ≤0.58) (32 and Deltour et al. Validation of
self-reported occupational noise exposure in participants
of a French case‒control study on acoustic neuroma. Submitted to Int Arch Occup Environ Health), also leaving the question open of what would be the real gold standard given that noise may vary considerably within the same profession. While the error related to JEM may more likely dilute an association, if it exists, the self-reported data may inflate weak associations or create spurious associations if differential between cases and controls. The validation studies show no substantial differential error, but this would not rule out weak spurious associations. Cases were more likely to report their noise exposure like the JEM or the expert evaluation than controls. Underreporting of exposed job episodes by controls would be expected to inflate OR for all exposure metrics, especially duration and amount of
exposure, as well as sources and characteristics which
were follow-up questions. No validated JEM was avail
-able to apply to our multinational study. The similarity of occupational and leisure noise exposures is intriguing. There is little objective data on leisure noise exposures
(33, 34) and therefore it is difficult to compare levels of occupational to leisure noise exposure. Sources of noise are perhaps not dissimilar; although the levels of noise exposure in leisure activities might be higher, the duration of exposure is anticipated to be generally shorter than for occupational exposures. Moreover the impact of hearing protection devices is difficult to appreciate: while it is mandatory to wear them in certain occupational settings, they are not always fully efficient
(35) and not necessarily always worn by the worker. For cases, recall differences may emerge during the period between first symptoms and final medical diagnosis: the
median diagnostic delay for VS has been evaluated to be 14 months in a small Finnish study (N=59) (36). Interest of a physician in the patient’s life-long loud noise expo
-sures for a person with hearing disorders or diagnostic tests may have contributed to a heightened awareness of noise issues among cases. Associations with loud noise exposure were found primarily for VS patients who also reported tinnitus but not within those with hearing loss only or no auditory symptoms. Since tinnitus appears
associated to noise (37, 38) and could sensitize patients to loud noise exposures, this may influence awareness and reporting of noise exposure. In addition, the conduct of the interview was long, and we cannot rule out that some participants, especially controls, got impatient, which might have led them to shorten the questioning by responding with “no” to some questions, thus contribut
-ing to recall and/or report-ing bias.
Detection bias ‒ whereby people occupationally
exposed to noise are under more intense medical
sur-veillance than the general population ‒ might also induce exposure‒response associations: exposure trig
-gers the incidental diagnosis of VS (39, 40). This bias is expected to produce higher OR for more recent work
periods but this pattern was not evident with respect to
our analyses. We furthermore could not come up with a plausible mechanism for confounding by known causal factors to explain our results.
The associations observed in our study might also reflect a biological mechanism relating to initiation or promotion. Loud noise can damage hearing through acoustic trauma. Whether this could lead to cellular hyperplasia and tumor occurrence is not known, as the biological mechanisms underlying the development
of VS are not well understood at present (41, 42). VS is generally a slow-growing benign tumor, but other growth patterns are also reported (43, 44). It is unlikely that noise induces direct DNA damage, but epigenetic mechanisms could affect promotion or initiation, via free radicals, the potential activation of p53 signaling path
-way, or other mechanisms (45–48). Experimental stud
-ies in rodents, pigs and sheep showed that severe acous -tic trauma (such as impulse noise) caused mechanical
damage to the eighth cranial (vestibulocochlear) nerve and the surrounding tissue (49). Physiological disrup
-tions of neurons along the auditory neuraxis, affecting intracellular signaling pathways and metabolism follow
-ing damage have been reported (50). The relationship, if any, with the nerve sheaths is unclear, and no explana -tion for the loca-tion of most VS on the vestibular por-tion of the nerve is available at present (51).
If this hypothesis was correct, exposure misclas
In conclusion, using INTERPHONE, the largest case‒control study of VS, an association between self-reported loud noise exposure and VS was shown, fairly consistent with the investigated exposures characteristics and sources, and for both sexes. The validation studies conducted in France and Germany within the framework of INTERPHONE permitted some evaluation of the level of recall bias. For this particular question, results suggest an underreporting of exposure among controls, and, consequently, inflation of the association. Further investigation is required on the extent of recall bias and on uncertainties in JEM assessments to determine which epidemiological design and exposure assessment method would be best for future studies, and on the biological mechanisms that might explain this epidemiological association between VS and loud noise exposure.
Funding
This work was supported by funding from the French Agency for Food, Environmental and Occupational Health & Safety (ANSES) "Programme national de recherche Environnement-Santé Travail" (contract EST 11-74). For details on funding support for the INTER -PHONE study and acknowledgements see the appendix (www.sjweh.fi/show_abstract.php?abstract_id=3781).
Conflict of interest
The authors declare no conflicts of interest.
References
1. Louis DN, Perry A, Reifenberger G, von Deimling A,
Figarella-BrangerD, CaveneeWK, et al.The 2016 World Health Organization Classification of Tumors of the Central Nervous System: a summary.Acta Neuropathol. 2016;131(6):803–20. https://doi.org/10.1007/s00401-016-1545-1.
2. CBTRUS Statistical report: Primary brain and central nervous system tumors diagnosed in the United States in 2004-2007. The Central Brain Tumor Registry of the United States.; 2011. 3. Larjavaara S, Feychting M, Sankila R, Johansen C,
Klaeboe L, Schuz J, et al. Incidence trends of vestibular
schwannomas in Denmark, Finland, Norway and Sweden in 1987-2007.Br J Cancer.2011;105(7):1069–75. https://doi. org/10.1038/bjc.2011.344.
4. Gal TJ, Shinn J, Huang B. Current epidemiology and management trends in acoustic neuroma.Otolaryngol Head Neck Surg.2010;142(5):677–81. https://doi.org/10.1016/j. otohns.2010.01.037.
5. Evans DG, Moran A, King A, Saeed S, Gurusinghe
N, Ramsden R. Incidence of vestibular schwannoma
and neurofibromatosis 2 in the North West of England over a 10-year period: higher incidence than previously thought. Otol Neurotol. 2005;26(1):93–7. https://doi. org/10.1097/00129492-200501000-00016.
6. Preston DL, Ron E, Yonehara S, Kobuke T, Fujii H,
KishikawaM, et al. Tumors of the nervous system and pituitary gland associated with atomic bomb radiation exposure.J Natl Cancer Inst.2002;94(20):1555–63. https:// doi.org/10.1093/jnci/94.20.1555.
7. Schneider AB, RonE, LubinJ, Stovall M, Shore-Freedman
E, Tolentino J, et al. Acoustic neuromas following childhood radiation treatment for benign conditions of the head and neck.Neuro Oncol.2008;10(1):73–8. https://doi. org/10.1215/15228517-2007-047.
8. Palmisano S, SchwartzbaumJ, Prochazka M, Pettersson D, BergenheimT, Florentzson R, et al.Role of tobacco use in the etiology of acoustic neuroma.Am J Epidemiol. 2012;175(12):1243–51. https://doi.org/10.1093/aje/kwr465.
9. Prochazka M, Feychting M, Ahlbom A, Edwards CG,
Nise G, Plato N, et al.Occupational exposures and risk of
acoustic neuroma.Occup Environ Med.2010;67(11):766– 71. https://doi.org/10.1136/oem.2009.047886.
10. SchüzJ, Steding-JessenM, Hansen S, StangerupSE, Caye-ThomasenP, JohansenC. Sociodemographic factors and vestibular schwannoma: a Danish nationwide cohort study. Neuro Oncol.2010;12(12):1291–9. https://doi.org/10.1093/ neuonc/noq149
11. InskipPD, TaroneRE, HatchEE, WilcoskyTC, FineHA,
Black PM, et al. Sociodemographic indicators and risk of brain tumours.International Journal of Epidemiology. 2003;32(2):225–33. https://doi.org/10.1093/ije/dyg051. 12. InskipPD, TaroneRE, HatchEE, WilcoskyTC, Shapiro
WR, Selker RG, et al. Cellular-telephone use and brain tumors. N Engl J Med. 2001;344(2):79–86. https://doi. org/10.1056/NEJM200101113440201.
13. Schüz J, Steding-Jessen M, Hansen S, Stangerup SE,
Caye-ThomasenP, Poulsen AH, et al.Long-term mobile phone use and the risk of vestibular schwannoma: a Danish nationwide cohort study.American Journal of Epidemiology. 2011;174(4):416–22. https://doi.org/10.1093/aje/kwr112.
14. Group IS. Acoustic neuroma risk in relation to mobile telephone use: results of the INTERPHONE international case-control study.Cancer Epidemiol.2011;35(5):453–64.
https://doi.org/10.1016/j.canep.2011.05.012.
15. Benson VS, PirieK, SchuzJ, ReevesGK, Beral V, Green
J, et al.Mobile phone use and risk of brain neoplasms and other cancers: prospective study. Int J Epidemiol. 2013;42(3):792–802. https://doi.org/10.1093/ije/dyt072.
16. PetterssonD, MathiesenT, ProchazkaM, BergenheimT,
FlorentzsonR, HarderH, et al.Long-term mobile phone use and acoustic neuroma risk.Epidemiology.2014;25(2):233– 41. https://doi.org/10.1097/EDE.0000000000000058.
17. Benson VS, PirieK, GreenJ, Bull D, CasabonneD, Reeves
org/10.1002/ijc.25184.
18. Schlehofer B, Siegmund B, LinseisenJ, SchuzJ, Rohrmann
S, Becker S, et al. Primary brain tumours and specific serum immunoglobulin E: a case-control study nested in the European Prospective Investigation into Cancer and Nutrition cohort.Allergy.2011;66(11):1434–41. https://doi. org/10.1111/j.1398-9995.2011.02670.x.
19. TurnerMC, KrewskiD, ArmstrongBK, Chetrit A, Giles GG, Hours M, et al. Allergy and brain tumors in the INTERPHONE study: pooled results from Australia, Canada, France, Israel, and New Zealand.Cancer Causes Control. 2013;24(5):949–60. https://doi.org/10.1007/ s10552-013-0171-7.
20. MillerMH, DoyleTJ, Geier SR. Acoustic neurinoma in
a population of noise exposed workers. Laryngoscope. 1981;91(3):363–71. https://doi.org/10.1288/00005537-198103000-00003.
21. Adelman S.Identification of acoustic neuroma in
noise-exposed workers. Scand Audiol. 1983;12(4):247–50.
https://doi.org/10.3109/01050398309044427.
22. Preston-Martin S, Thomas DC, Wright WE, Henderson BE. Noise trauma in the aetiology of acoustic neuromas in men in Los Angeles County, 1978-1985.Br J Cancer. 1989;59(5):783–6. https://doi.org/10.1038/bjc.1989.163.
23. BakerR, Stevens-King A, Bhat N, LeongP. Should patients
with asymmetrical noise-induced hearing loss be screened for vestibular schwannomas? Clin Otolaryngol Allied Sci. 2003;28(4):346–51. https://doi.org/10.1046/j.1365-2273.2003.00721.x.
24. Edwards CG, Schwartzbaum JA, Lonn S, Ahlbom A,
FeychtingM. Exposure to loud noise and risk of acoustic neuroma.Am J Epidemiol.2006;163(4):327–33. https://doi. org/10.1093/aje/kwj044.
25. Schlehofer B, Schlaefer K, Blettner M, BergG, Bohler E,
Hettinger I, et al.Environmental risk factors for sporadic acoustic neuroma (Interphone Study Group, Germany).Eur J Cancer. 2007;43(11):1741–7. https://doi.org/10.1016/j. ejca.2007.05.008.
26. Edwards CG, Schwartzbaum JA, Nise G, Forssen
UM, Ahlbom A, Lonn S, et al. Occupational noise
exposure and risk of acoustic neuroma.Am J Epidemiol. 2007;166(11):1252–8. https://doi.org/10.1093/aje/kwm217.
27. HoursM, Bernard M, Arslan M, MontestrucqL, Richardson L, Deltour I, et al.Can loud noise cause acoustic neuroma? Analysis of the INTERPHONE study in France.Occup Environ Med. 2009;66(7):480–6. https://doi.org/10.1136/ oem.2008.042101.
28. FisherJL, PetterssonD, Palmisano S, SchwartzbaumJA,
EdwardsCG, MathiesenT, et al.Loud noise exposure and acoustic neuroma. Am J Epidemiol. 2014;180(1):58–67.
https://doi.org/10.1093/aje/kwu081.
29. CardisE, RichardsonL, Deltour I, Armstrong B, Feychting M, JohansenC, et al.The INTERPHONE study: Design, epidemiological methods, and description of the study population.Eur J Epidemiol.2007;22(9):647–64. https://doi.
30. Interphone Study G. Brain tumour risk in relation to mobile telephone use: results of the INTERPHONE international case-control study.International Journal of Epidemiology. 2010;39(3):675–94. https://doi.org/10.1093/ije/dyq079.
31. VrijheidM, RichardsonL, ArmstrongBK, Auvinen A, Berg G, CarrollM, et al.Quantifying the impact of selection bias caused by nonparticipation in a case-control study of mobile phone use.Ann Epidemiol.2009;19(1):33–41. https://doi. org/10.1016/j.annepidem.2008.10.006.
32. Schlaefer K, Schlehofer B, Schuz J. Validity of
self-reported occupational noise exposure. Eur J Epidemiol. 2009;24(8):469–75. https://doi.org/10.1007/s10654-009-9357-4.
33. JiangW, ZhaoF, Guderley N, Manchaiah V. Daily music exposure dose and hearing problems using personal listening devices in adolescents and young adults: A systematic review.Int J Audiol.2016;55(4):197–205. https:// doi.org/10.3109/14992027.2015.1122237.
34. Sliwinska-Kowalska M, Zaborowski K. WHO Environmental Noise Guidelines for the European Region: A Systematic Review on Environmental Noise and Permanent Hearing Loss and Tinnitus.Int J Environ Res Public Health. 2017;14(10). https://doi.org/10.3390/ijerph14101139.
35. Reddy RK, Welch D, ThorneP, Ameratunga S. Hearing protection use in manufacturing workers: a qualitative study. Noise Health. 2012;14(59):202–9. https://doi. org/10.4103/1463-1741.99896.
36. TeppoH, HeikkinenJ, LaitakariK, Alho OP. Diagnostic delays in vestibular schwannoma. J Laryngol Otol. 2009;123(3):289–93. https://doi.org/10.1017/ S0022215108003113.
37. Williams W, CarterL. Tinnitus and leisure noise. Int J Audiol.2017;56(4):219–25. https://doi.org/10.1080/14992 027.2016.1250961.
38. Bhatt IS. Prevalence of and Risk Factors for Tinnitus and
Tinnitus-Related Handicap in a College-Aged Population. Ear Hear. 2018;39(3):517–26. https://doi.org/10.1097/ AUD.0000000000000503.
39. MorrisZ, WhiteleyWN, LongstrethWT, Jr., WeberF, Lee YC, Tsushima Y, et al.Incidental findings on brain magnetic resonance imaging: systematic review and meta-analysis. BMJ. 2009;339:b3016. https://doi.org/10.1136/bmj.b3016.
40. Anderson TD, Loevner LA, Bigelow DC, Mirza N.
Prevalence of unsuspected acoustic neuroma found by magnetic resonance imaging. Otolaryngol Head Neck Surg. 2000;122(5):643–6. https://doi.org/10.1016/S0194-5998(00)70189-6.
41. Celis-AguilarE, LassalettaL, Torres-MartinM, Rodrigues
FY, Nistal M, CastresanaJS, et al.The molecular biology
of vestibular schwannomas and its association with hearing loss: a review.Genet Res Int.2012;2012:856157. https://doi. org/10.1155/2012/856157.
43. Caye-ThomasenP, Baandrup L, Jacobsen GK, Thomsen J, Stangerup SE. Immunohistochemical demonstration
of vascular endothelial growth factor in vestibular schwannomas correlates to tumor growth rate.Laryngoscope. 2003;113(12):2129–34. https://doi.org/10.1097/00005537-200312000-00014.
44. Charabi S, Tos M, Thomsen J, Charabi B, Mantoni M. Vestibular schwannoma growth--long-term results. Acta Otolaryngol Suppl. 2000;543:7–10. https://doi. org/10.1080/000164800453801.
45. FloydRA. Serendipitous findings while researching oxygen free radicals.Free Radic Biol Med.2009;46(8):1004–13.
https://doi.org/10.1016/j.freeradbiomed.2009.02.003.
46. FetoniAR, Bielefeld EC, PaludettiG, Nicotera T, Henderson D. A putative role of p53 pathway against impulse noise induced damage as demonstrated by protection with pifithrin-alpha and a Src inhibitor.Neurosci Res.2014; 81-82:30–7. https://doi.org/10.1016/j.neures.2014.01.006.
47. Sughrue ME, Yeung AH, Rutkowski MJ, Cheung SW, Parsa AT. Molecular biology of familial and
sporadic vestibular schwannomas: implications for novel
therapeutics.J Neurosurg.2011;114(2):359–66. https://doi. org/10.3171/2009.10.JNS091135.
48. Fong B, BarkhoudarianG, PezeshkianP, ParsaAT, Gopen Q, Yang I. The molecular biology and novel treatments of vestibular schwannomas.J Neurosurg.2011;115(5):906–14.
https://doi.org/10.3171/2011.6.JNS11131.
49. RobertoM, HamernikRP, TurrentineGA. Damage of the auditory system associated with acute blast trauma. Ann
Otol Rhinol Laryngol Suppl.1989;140:23–34. https://doi. org/10.1177/00034894890980S506.
50. GoldJR, BajoVM. Insult-induced adaptive plasticity of the auditory system. Front Neurosci.2014;8:110. https://doi. org/10.3389/fnins.2014.00110.
51. Komatsuzaki A, Tsunoda A. Nerve origin of the acoustic neuroma.J Laryngol Otol.2001;115(5):376–9. https://doi. org/10.1258/0022215011907910.