A Novel statistical parametric analysis of
brain tumor images using contourlet transform
and Fuzzy C-means clustering algorithm
Kimmi Verma#1, Rituvijay*2, Shabana Urooj*3
#
Associate Prof., Department of Electronics & Communication Engineering, Faculty of Engineering-KCCITM, UP Technical University, Greater Noida, India
Abstract —Brain tumor detection is one of the most critical tasks in the field of medical image processing. Various studies reveal that the existing methods have not considered the images of poor quality like images with high noise and low brightness due to significant image processing difficulty, which can leads to error in assessment. In an image, noise may creep in at various stages such as at the time of image acquisition, during transferring the image or storing the image as data etc. As denoising filter, adaptive fuzzy filter is selected. This filter will perform in frequency domain in contourlet transform. The image is then segmented using fuzzy C means clustering technique, watershed segmentation and level set segmentation to get the best results in a noised image. These techniques are accurate and faster as they require less computational time as compared to other techniques.
Keywords —Adaptive filter, Denoising, Contourlet transform, Clustering techniques, Watershed segmentation.
I. INTRODUCTION
The method, in which images are collected and labelled as input, is called Image segmentation. After image processing, various attributes extracted from these images. Segmentation is defined as segregating an image into its constituent regions. Any region of an image can be characterised based on intensity and can be identified as similarity or discontinuity. In any discontinuity, partitioning of an image is done on the basis of abrupt changes in intensity, such as edges of an image; whereas, in similarity, partitioning is done based onpredefined similar attributes. There are various techniques
forsegmentation such as region growing,
thresholding, region splitting and merging.
Features like distinct lines, isolated point and discrete edges can be identified based on discontinuity. An edge or line is a set of connected pixels where the intensity of pixel changes abruptly. Points, line and edges are all high frequency components.
In region based segmentation technique,
segmentation is performed based on similarities. In
this segmentationmethod, regions can be
segregated by region growing, region splitting, and region merging and split and merge method. Based on thresholding method, local, global or optimum thresholding can be done. When one threshold value is selected for the whole image it is known as global thresholding and when the image is partitioned into sub regions and the different threshold value is selected for these sub regions, it is known as local thresholding.
Clustering techniques are also alternative method of segmentation which may reduce noise in the image. This method uses clustering image data into natural groups and assigning a set of attributes to these groups to form a cluster. This grouping can be performed by many different algorithms. A cluster is formed by grouping images & pixels of some property into one cluster such that the lower inter cluster similarities and upper intra cluster similarities are matched.
Various steps are involved in featured
representation of clustering process and points are measured and grouped together into clusters based on similar features. Clustering Algorithms can be classified as Partitioned clustering and Hierarchical clustering.
Fuzzy C means algorithm and K means algorithm are very similar. Random coefficients are assigned to each point of the selected clusters.For denoising of an image with poor contrast quality, adaptive filters can be used after analysing the
frequency components through contourlet
transforms.
Derived through laplacian pyramid and
directional filter, contourlet transforms are multi-scale and multi-dimensional methods of image representation.
To obtain the contour coefficient, the frequency components in the input image obtain low pass frequency components and bandpass frequency components as output which is passed through adaptive filter bank.
II. RELATED WORK
Image denoising and segmentation of an image are the two most challenging tasks in the field of medical imaging. It is very difficult to obtain accurate data from segmentation of a noisy image and it may lead to incorrect assessment during medical diagnosis. Faisal and Sharmin [1] proposed partial differential equation of fourth order for noise removal in MRI images and automatically seeded region segmentation technique is applied for detecting brain tumor. They preserved the anatomically significant information at the edges and for skull removal from the brain MRI images; an efficient morphological technique is applied.
Jose Silvestre Silva, Augusto Silva [2] limits the pixel resolution by reconstructing noise. In video processing, this method cannot be applied as quantities are in densitometry. In this work, study of various denoising methods: geometric mean filter, Wiener filtering, and wavelet denoising is considered. Visual inspection, profile region intensity analysis and global figures of merit are the means through which performance is measured.
Victor S Frost, K. S Shanmugan [3] stated that to enhance non-coherent optically produced images, various image processing techniques are not suitable for radar images. Multiplicative noise is added to the Radar images. For smoothing radar images, functional form of optimum filter is modelled. To preserve the edge structure, adaptive filter is constructed to produce MSE. The adaptive filter computes efficiently and implemented in spatial domain. Comparison of the adaptive filter is made (qualitatively and quantitatively) with standard filters of real and simulated radar images.
M.N.Do, M.Vetterli [4] in his paper state that to capture the intrinsic geometrical structure two dimensional transform is analyzed in video data. Exploring geometry in the images of discrete nature is the main challenging task. For methods, like curvelets continuous domain, a transform is developed first and for sample data, it is discretized. In this paper, the algorithm starts with a discrete domain construction and then its convergence is studied for expansion in the continuous domain. They constructed a discrete
domain multiresolution and multi-direction
expansion with inseparable filter groups. This paper discussed a multiresolution, local and directional image expansion with the help of contour segments and termed it as a contourlet transform. For N Pixel images, operations require bank algorithm for discrete contourlet transform.
With directional multiresolution analysis
framework, a precise link between the developed filter bank and continuous domain contourlet expansion is formed. This paper depicts that contourlets achieve the optimal approximation rate for piecewise smooth functions with discontinuities along continuously differentiable curves.
Chun Man Yan, Bao long Guo [5] discussed that in the field of image processing, MGA (multiscale geometric analysis) is considered as efficient method. In denoising an image, one of discrete tools of MGA, such as nonsubsampled contourlet transform is used. Such methods can be used for
image fusion, image enhancement, feature
extraction etc. Its performance is considered low because of the reason of its high redundancy which leads to intensive computations. This paper adopted optimized directional filter bank to the NSCT to remarkably increase the computational speed. Their experimental results also showed that reconstructed image quality is in accordance with the human visual system.
R. Siva Kumar, G. Balaji, R.S.J. Ravikiran [6] mentioned that in various fields like remote sensing and biomedical applications multiplicative noise dominates and this affects the important features, parameters and attributes of an image. Various transforms are used to denoise the image. But these methods do not preserve the edges, whereas edges are very important factor in image processing for
image denoising. Contourlet transform is
introduced in this paper and considered as more efficient than the wavelet transform in the field of image denoising especially for speckle noise. On the basis of signal to noise ratio and IEF, wavelet transform and contourlet transform are compared.
BendaleDhanashriDilip, Dinesh Kumar Sahu[7] described about region based segmentation and thresholding based segmentation. Authors further,
differentiated between Global and Local
thresholding, whereGlobal thresholding can be single level or multilevel, on the other hand local thresholding is necessarily multilevel thresholding. Authors analyzed various features of global thresholding and local thresholding methods.
K.Bhargavi, Dr. T. Sreenivasulu Reddy [8] investigated and found that Adaptive Histogram Equalization(AHE) enhances the imageshaving the tendency of over-amplifying the noise. By using a variant of AHE named Contrast Limited Adaptive
Histogram Equalization (CLAHE), this
amplification can be prevented. Further authors informed that clustering method using fuzzy C-means (FCM) is superior as compared to other
techniques. However, it lacks behind in
computational time.
III. THE PROPOSED IMAGE SEGMENTATION
METHOD
To detect brain tumor, different medical image
segmentation techniques such as threshold
insufficient information. The method proposed here is efficient and fast to run on large database.
The proposed method works efficiently for the images of malignant brain tumor and provides maximum information of the input image to be processed.
This image segmentation method is divided into various stages. First is the collection of data. Original images of tumor patients are taken and
collected as database. This comes under
preprocessing stage. In this stage, through adaptive filter, denoising of original image is done and brain surface is also extracted. Contourlet transforms are also used along with denoising. In second stage, clustering of image is done using Fuzzy C Means Clustering technique, for segmentation the tumor. In the third stage, tumor is extracted using level set segmentation and watershed segmentation. As contoured area of a tumor is calculated in denoised image by using contourlet transforms, this method performs the image processingin a faster and more efficient way.
A.Pre-processing stage
This stage is implemented by going through various steps of image operations to get better and fine results. Various morphological operators for image sharpening, image enhancement, edge detection are applied on the original image for finer results. Further, noise removal techniques are applied on the original image to improve the image quality. This process consists of two steps.
1) Denoising - Noise present in MRI Images is caused due to radio frequency pulses, radio frequency coil, voxel volume, and field strength or receiver bandwidth. Noise present in the images is in the form of Gaussian noise, salt and pepper noise, speckle noise, impulse noise etc. The methods employed for eliminating Gaussian noise are edge preserving bilateral filter, total variation and non-local means. In this process adaptive filters are used in place of median filters. Though Median filter was also considered as an effective method for nonlinear filtering for removing noise while preserving edges, useful for removing signal independent statistical outliers by processing the edges of the image and also used to improve and enhance image which was destroyed by shot noise. However, in removing impulse noise low pass filters and median filters do not perform well. On the other side, adaptive filters by modifying slightly the filtering method in Kernel sides of the image components are able to adjust themselves to local attributes and structures of the image. So they are termed as self-adjusted digital filters. In fact, adaptive filters adopted here will perform better than median filters by removing impulse noise. Adaptive filters used in pre-processing state are able to denoise non stationary image.
Adaptive filters with contourlet transform used here are able to reduce the adverse effects of speckle noise as they adjust according to signal content of the image.
2) Extraction of brain surface - As observed, a radiologist finds the information given in T1 weighted MRI images about image background as useless. In fact, it increases the processing time. Removing image background, skull, surface of the brain and eyes of the patient from the image decreases the memory used for storing this information which is not of much relevance in processing the brain image. An algorithm that clips areas outside the brain from a T1-weighted magnetic resonance image (MRI) used in this paper is based on the Brain Surface Extraction (BSE) algorithms which isolate the brain from the rest of a T1-weighted MRI using a series of image manipulations. There are essentially four steps to the BSE algorithm:
Step 1, Filtration of the original image to remove irregularities and discontinuities.
Step 2, Detection of fine and sharp edges in the image.
Step 3, Performing morphological
erosions using various operators and brain isolation.
Step 4, Performing brain surface cleanup
and image masking.
The image obtained after these two
preprocessing steps is the noise free MR image with no brain surface. Now, the image is prepared for further processing to get better results.
3) Smoothing the image - After Filtering, contourlet transforms are used with double filter bank structure to obtain smooth contours of an image. In double filter bank, to capture the point discontinuities first, laplacian pyramids are used and then unidirectional filter bank is used to create those point discontinuities into linear structure.
In threshold segmentation, classification of each pixel depends on its information such as intensity and color. To separate histograms of objects and background, thresholding methods give better results. On the other hand, clustering methods are utilized for complex pathology. Clustering method is used for grouping data with same characteristics into larger units of analysis.
Fuzzy C means algorithms are best explained by rewriting criteria as in matrix forms. Let X is a real valued c X N matrix. Here, X is represented in
matrix as [xik]. X is the matrix representation of the
partition {Yk}.
Each matrix representation can be further written in its partitions as
Xi (yk) = xik = {1 foryk € Y; 0 for otherwise.
∑ xik = 1,only for k.
Here, xi is the characteristic function of Yi.
The method associated with least squared errors Jm(X, t) = ∑ ∑ (xik)m║yk– ti║2A and Y = { y1, y2,
y3, ...,yn} С Rn = the data used here is referred as
c = number of clusters in Y. m = exponent of weight.
X= fuzzy C partition of Y. Here, X ϵ Mk.
B.Extraction and contouring stage
In this stage, we have used two segmentation methods: watershed segmentation and contourlet level set methods.
1) Watershed segmentation -It is one of the oldest and the most powerful segmentation techniques. Watershed segmentation is used here to avoid an over segmentation. Tropical gradient approach is combined with watershed segmentation to give best and accurate results.
Topological gradient method is chosen to find the optimal decomposition of an input image domain which is divided in two parts: the optimal design and complement of it.
An attribute of grey scale image falling on topographic level flows towards the nearest minimum. The minimum which lies at the end of path of steepest descent is termed as the nearest minimum. It occurs if in the catchment basin of that minimum point lies.
2) Active Contourlet level transforms- The basic purpose of using active contourlet transforms is to combine the advantages of both edge and region approaches. A curve well described in an image that can modify its coordinates and locations and its shape to satisfy the pre-specified conditions which makes segmentation easier of region of interest. The benefit of using active contour model is that it is immune to noise, boundaries and gaps present in the image.
In the region of interest to be segmented, a contour is placed like a seed pixel. There are small curves inside the contour which have properties of elasticity that can be grown or shrinks to get accommodated in the region of interest. By specifying all the points in region of interest, the algorithm becomes computationally intense. The use of level set transforms added more flexibility and also strength the implementation of active contours. An Active contour can be used for other segmentation methods in edge detection, statistical approach of data and texture demarcation. An adaptive fuzzy filter is further used for the removal of noise in an image.Flowchart for Fuzzy C-means clustering technique is shown in Figure-1.
Figure 1 - Fuzzy C-Means clustering technique
C. Validation stage
In validation stage, MRI images of a set of subjects, which were diagnosed positive for the tumor, are selected with probabilistic tissue segmentation. Due to their initial confirmed tumor positive background, the results of processed images were compared and results were converted to pathological ground truth.
Further, tumor sizes are studied through analysis of its shape, irregularity and through the process of infiltration.
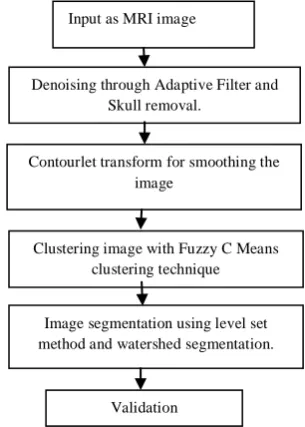
Flowchart for the proposed segmentation from pre-processing stage to validation stage is shown in Figure-2.
Figure 2 - Flowchart for the segmentation techniques proposed
IV. EXPERIMENTAL RESULTS
A. Data organization
In order to check the sustainability and performance of the defined algorithm, we have used four different benchmark databases. First databaseof images is taken from the Digital
Imaging and Communications in Medicine
(DICOM) data set. Different images are studied and observed and images that consists benign or
Input as MRI image
Denoising through Adaptive Filter and Skull removal.
Contourlet transform for smoothing the image
Clustering image with Fuzzy C Means clustering technique
Image segmentation using level set method and watershed segmentation.
Validation Laplacian
pyramid
Unidirectional filter
malignant tumor are taken for testing of the defined algorithm. Second database are taken from Brain web data set. The data available here is based on two models, normal and multiple sclerosis. Three dimensional data available here is simulated using T1, T2 and PD sequences. Last two databases are from laboratory that consists of Multi contrast MRI scans along with expert radiologists comments about active tumor.These six sets contain more than 200 images. All these images were converted to ―.jpg‖ extension.
B. Results and Discussions
In this section, we presented the results of our proposed image segmentation that are obtained after superimposing various image processing techniques. The complete work is processed and implemented using MATLAB 7.12.0.This work was done on Intel (R) core(TM) 2 duo CPU /2.5 GHZ computer with 3GB RAM and NVEDIA VGA CARD.
Table-1 indicates the resultant images after applying filtering, clustering and segmentation techniques and tumor images were very clearly identifiable through visual inspection.
The comparison was done between the four tested techniques according to the following performance measures. These are Test Efficiency, Sensitivity or true positive rate, precision or positive predicted value and F1 score.
Data base
Origin al MR
Adapt-ive filter
Fuzzy C Means cluster-ingAlg ori-thm
Conto-urlet transfo rms
Level set
transf-orms
Waters hed segme-ntation
Data base 1 Data base 2 Data base 3 Data base 4
Table 1 – Important stages of work carried out on four databases
The given tested techniques are explained in terms of different ratio outcomes.
a) Test Efficiency (TE) = Correct Interpretation of Images (Positive Results & Negative Results) / Total number of image analyzed.
b) Sensitivity or True Positive Rate (S) = Correct Interpretation of Images for Positive Results / Total number of actual positive results.
c) Precision or Positive Predictive Value (P) = Correct Interpretation of Images for Positive Results / Total number of positive results ascertained by the test
d) F1 Score (Harmonic Mean of Sensitivity and Precision) = 2 / (1/S + 1/P) = 2SP/(S+P)
Test Efficiency provides quantitative
performance of various measuring techniques whereas F1 score qualitative performance of these techniques.
Results of K-Mean (KM) clustering technique are presented in Table-2. It can be seen that test efficiency and sensitivity is higher than 80% for all database and F1 score is higher than 90%.
Data
base TP TN FP FN Test Efficie
ncy
Sensit ivity
Preci sion
F1 Scor e DB1 82.8 0 0 17.2 82.8 82.8 100 90.6 DB2 86.4 0 0 13.6 85.7 85.7 100 92.3
DB3 90.6 0 0 9.4 90.3 90.3 100 94.9 DB4 91.5 0 0 8.5 91.3 91.3 100 95.5
Table 2 - Error metrics of K-Means
Results of Expectation-Maximization (EM) clustering technique are presented in Table-3. It is observed that test efficiency and sensitivity for the given database varies from 76% to 91% and F1 score varies from 86% to 95%. It indicates that EM clustering technique is relatively less consistent as compared to other techniques.
Data
base TP TN FP FN Test Efficie
ncy
Sensit ivity
Preci sion
F1 Scor e DB1 78.1 0 0 21.9 76.6 76.6 100 86.7
DB2 90.8 0 0 9.2 90.1 90.1 100 94.8 DB3 91 0 0 9 90.7 90.7 100 95.1
DB4 88.9 0 0 11.1 87.9 87.9 100 93.6
Table 3 - Error metrics of Expectation Maximization
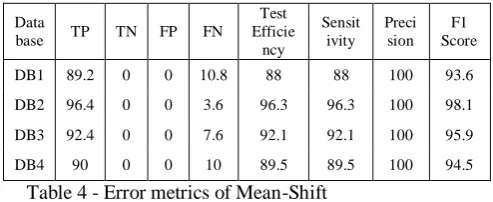
Results of Mean-Shift (MS) clustering technique are presented in Table-4. Test efficiency and sensitivity for MS are higher than 88% for all database and F1 score is higher than 93%, which indicates that this technique is significant reliable and accurate.
Data
base TP TN FP FN Test Efficie
ncy
Sensit ivity
Preci sion
F1 Score
DB1 89.2 0 0 10.8 88 88 100 93.6
DB2 96.4 0 0 3.6 96.3 96.3 100 98.1 DB3 92.4 0 0 7.6 92.1 92.1 100 95.9
DB4 90 0 0 10 89.5 89.5 100 94.5
Table 4 - Error metrics of Mean-Shift
clustering technique is the highest among all the techniques considered in the proposed work. Test efficiency and sensitivity for FCM varies from 90% to 100% for all database and F1 score is higher than 95% indicating that it is one of the most suitable clustering techniques available as on today.
Data
base TP TN FP FN Test
Efficie-ncy
Sensit ivity
Preci sion
F1 Scor e DB1 90.9 0 0 9.1 90.7 90.7 100 95.1 DB2 90.6 0 0 9.4 90.5 90.5 100 95.0
DB3 100 0 0 0 100 100 100 100. 0 DB4 96.7 0 0 3.3 96.6 96.6 100 98.3
Table 5 - Error metrics of Fuzzy C Mean
V. CONCLUSION
There are wide applications of diversified imaging techniques in medical diagnosis such as CT scans image and MRI image. MRI is considered as the efficient and accurate imaging technique in brain tumor imaging and image segmentation plays a vital role in medical imaging. However, the technique developed containing Fuzzy C Means clustering algorithm detects tumor cells more accurately than any other technique. To segment an image distorted with noise, adaptive filters and other artefacts are used that results in fine imaging. We developed a novel model that integrates the Fuzzy C Means clustering technique and contourlet transform along with level set segmentation to give more accurate results. Our system consists of five stages: preprocessing stage where noise and brain surfaces are removed, clustering technique applied with contouring and segmentation in which watershed and level set is used as hybrid segmentation technique to give best results. From the experimental results, we have concluded that the effectiveness of our system in brain tumor segmentation is better as compared to K Means, Expectation Maximization and Mean Shift clustering technique. For future work, it is proposed that separation of tumor can be done
using three dimensional slicer for
volumetriccalculations and analysis.
REFERENCES
[1] Faisal Ahmed, Parveen Sharmin, BadshaShahriar, Sarwar Hasan, An improved image denoising and segmentation approach for detecting tumor from 2-D MRI brain images, International Conference on Advanced Computer Science Applications and TechnologiesKuala Lumpur, Malaysia, IEEE, pp.452- 457, Nov 2012.
[2] Silva José Silvestre, Silva Augusto, Santos Beatriz Sousa, Lung segmentation methods in X-ray CT Images, SIARP2000, 5th Iberoamerican symposium on pattern recognition, Lisbon, Portugal, CIARP. pp 583-598, Sep 2000.
[3] Frost Victor S, Shanmugan KS, A Model for Radar Images and Its Application to Adaptive Digital Filtering of Multiplicative Noise, IEEE T Pattern Anal, pp. 157-166, 1982.
[4] Do MN, Vetterli M. The contourlet transform: An efficient directional multiresolution image representation, IEEE T Image Process, pp. 2091-2106, 2005.
[5] Chun-Man YAN, Bao-Long GUO, MengYI, Fast Algorithm forNon sub-sampled Contourlet Transform, Acta Acust;40, pp. 757-762, 2014
[6] Siva Kumar R, Balaji G., Ravikiran RSJ, Image Denoising using Contourlet Transform, Second International Conference on Computer and Electrical Engineering, Dubai, UAE, IEEE. pp 22-25.Dec 2009.
[7]BendaleDhanashriDilip, SahuDinesh Kumar, Enhanced the Image Segmentation Process Based on Local and Global Thresholding. IJETT, Vol. 45(1), pp. 22-26, Mar 2017.