Milgram’s Experiment: Obedience or Emotional Adaptation on Empathy Emotional Scale?
Full text
Figure


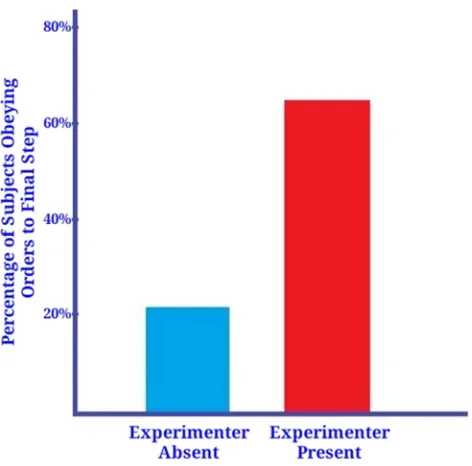
![Figure 7. Obedience influenced by the strength of the empathetic stimulus. [χ2 (3, N = 160) = 14.077, p = 0.0028]](https://thumb-us.123doks.com/thumbv2/123dok_us/8573932.1717321/10.595.47.286.73.250/figure-obedience-influenced-strength-empathetic-stimulus-x-n.webp)

Related documents
A professional development initiative at an urban, research university between a university faculty developer, an engin- eering faculty member, and a science education faculty
Provisions are made in the auxiliary and radwaste buildings to use mobile radwaste processing systems for processing and packaging each waste stream including concentration and
or ontological issues. One of the regions, that with stress-energy, has non-trivial Ricci curvature; the other does not, though it may have non-trivial Weyl curvature. That
Despite the predicted optimum independent variables for PER pointed a long extrac- tion time, 150 min, at a high temperature (61.1 ◦ C), its graphical representation ( Fig. 3 ) shows
Support for interfaces with current commercial products (eg ERWin) Metamodelling capability and ideally an extensible metametamodel Support for development of adapters
This article describes the construction of a prototype using the Arduino platform, in conjunction with Fault Identifier Equipment (FI), in order to facilitate the
In July 2019, the Department of Finance published the final version of the proposed regulatory amendments to the Proceeds of Crime (Money Laundering) and Terrorist
