R E S E A R C H
Open Access
Temperature-dependent bursting pattern analysis
by modified Plant model
Nam Gyu Hyun
1, Kwang-Ho Hyun
2, Kwang-Beom Hyun
3and Kyungmin Lee
4*Abstract
Many electrophysiological properties of neuron including firing rates and rhythmical oscillation change in response to a temperature variation, but the mechanism underlying these correlations remains unverified. In this study, we analyzed various action potential (AP) parameters of bursting pacemaker neurons in the abdominal ganglion of Aplysia julianato examine whether or not bursting patterns are altered in response to temperature change. Here we found that the inter-burst interval, burst duration, and number of spike during burst decreased as temperature increased. On the other hand, the numbers of bursts per minute and numbers of spikes per minute increased and then decreased, but interspike interval during burst firstly decreased and then increased. We also tested the reproducibility of temperature-dependent changes in bursting patterns and AP parameters. Finally we performed computational simulations of these phenomena by using a modified Plant model composed of equations with temperature-dependent scaling factors to mathematically clarify the temperature-dependent changes of bursting patterns in burst-firing neurons. Taken together, we found that the modified Plant model could trace the ionic mechanism underlying the temperature-dependent change in bursting pattern from experiments with bursting pacemaker neurons in the abdominal ganglia ofAplysia juliana.
Keywords:Temperature dependence, Bursting patterns, Modified Plant model, R15 pacemaker neuron, Aplysia juliana
Introduction
To date, researchers have investigated the effect of temperature on the electrical activity and firing patterns in neurons from many animals, including Aplysia juliana, crabs, crayfish, frogs, lobsters, locusts, snails, and squids [1-9]. Especially the functions and properties of bursting pacemaker neuron R15 in the abdominal ganglion of Aplysiahave been extensively studied [10-12] and math-ematical simulation of bursting activity has been success-fully performed [13-19]. However, few studies on the temperature dependence of action potential (AP) parame-ters in the R15 bursting pacemaker neuron have been re-ported [20,21]. They analyzed typical changes of AP parameters in burst-firing neurons by investigating the ef-fect of heat on R15 bursting pacemaker neuron activity as the temperature increased and reported temperature-dependent changes in inter-burst interval, burst duration,
number of spike per burst, intra-burst spike broadening and spike height [21]. However, the reproducible proper-ties and mechanism of temperature-dependent changes of AP parameters remain unknown yet.
Changes in temperature can produce numerous effects on the neural tissue of most organisms. Indeed it has been reported that hyperthermic temperature may in-duce depolarization and spontaneous firing of pyramidal neurons leading to enhanced excitability of hippocampus [22,23]. On the other hand, a body of evidence indicat-ing a therapeutic effect of hypothermia has accumulated in several conditions. Orlowski and colleagues published that in refractory status epilepticus unresponsive to con-ventional treatment, systemic hypothermia (30-31°C) was an effective therapeutic method leading to burst suppression on electroencephalography (EEG) [24]. Des-pite a lot of works aiming at demonstrating the neural effect of temperature, the mechanism of temperature-dependent electrophysiological change containing alter-ation of bursting and firing pattern in neuron remains unclear. Here, we examined the effects of temperature * Correspondence:[email protected]
4Department of Anatomy, Brain Science & Engineering Institute, Kyungpook
National University Graduate School of Medicine, 2-101, Dongin-dong, Jung-gu, Daegu 700-842, South Korea
Full list of author information is available at the end of the article
© 2014 Hyun et al.; licensee BioMed Central Ltd. This is an Open Access article distributed under the terms of the Creative Commons Attribution License (http://creativecommons.org/licenses/by/4.0), which permits unrestricted use, distribution, and reproduction in any medium, provided the original work is properly cited. The Creative Commons Public Domain Dedication waiver http://creativecommons.org/publicdomain/zero/1.0/ applies to the data made available in this article,
changes on the neuronal activity and bursting patterns during several consecutive heating−cooling cycles by using bursting pacemaker neurons which are a proper specimen with capability of long-lasting recording for mathematical modeling. Next, we sought to identify the mechanism underlying temperature-dependent bursting patterns of these neurons by analyzing and comparing the experimental data to computational simulation data calculated by modified Plant equations with temperature-dependent scaling factors,ρ(T) andϕ(T).
Materials and methods
Animals and dissection
Animals (A. juliana) were collected locally in Seogwipo, South Korea and all experimental procedures were ap-proved by the Jeju National University Animal Care and Use Committee. These animals were dissected to ob-serve the temperature-dependency of bursting patterns generated by pacemaker neurons R15 in the abdominal ganglia ofA. julianaas described in previously published paper [1]. Briefly, the animals were anesthetized with an
injection of 0.38 M MgCl2 amounting to half of each
specimen’s weight before the abdominal ganglia were re-moved. Each abdominal ganglion was incubated at 34°C for 40 minute in a solution containing equal volumes of artificial sea water (ASW; in mM: 460 NaCl, 10 KCl, 11 CaCl2, 55 MgCl2, and 10 HEPES; pH 7.6) and isotonic Leibovitz’s L-15 media (Cat. No. L-4386; Sigma) contain-ing 1% protease (type IX; Sigma) (hereafter, ASW:L-15 (1:1)). They were then washed several times with ASW and were placed in a low-temperature incubator (VS-1203PIN; Hanback Co., Daejeon, Korea) at 18°C. At last they were removed onto Petri dishes (50x9 mm), pinned down on Sylgard plates (Dow Corning, USA) filled with ASW:L-15(1:1), and desheathed.
Data acquisition and analysis
A PT100 platinum resistance temperature sensor con-nected to a digital thermometer (TRM-006, Toho, Japan) was placed near the abdominal ganglia ofAplysiasoaked in ASW:L-15 (1:1, v/v) to measure the medium temperature, which could be increased or decreased by activating the temperature controller system (HMN 3940, Acetec Co., Korea). We used a low flow rate peristaltic pump (BJ100-2 J; Baoding Longer Precision Pump Co., China) to maintain a viable solution with ASW:L-15 (1:1) media. The flow rate and the speed were 0.14 mL/min and 1.0 rpm, respectively. Intracellular recordings of burst-ing pacemaker neurons were performed to measure the membrane potential. The glass intracellular electrodes were filled with 3 M KCl and the membrane potentials recorded were simultaneously saved using a DAQ card (NI PCI-6221, National Instruments) and the Labview program (National Instruments). The electrical signals of the APs were identified using a digital oscilloscope (54622A; Agilent, Colorado Springs, Colo., USA). These data were recorded at a rate of 3 kHz to reproduce the APs on the computer because the bursting cells gener-ated APs at a rate of 0–4 Hz; each component of this data is composed of 180,000 pairs of temperature and membrane potential values with unique file names, and the dataset was composed of 1,713 files as shown in Table 1. With this selected dataset, the average values of each of the AP parameters of the burst-firing neuron could be calculated using Origin 6.0 (Microcal Software, Inc.) and a computer program we designed. For each experiment, the bursting neuron was held at room temperature for one hour as shown in Table 2 and then changed with continuous ramp from about 16°C to 30°C. Then, the data recorded by increments (or decrements) of 2°C from about 16°C to 30°C
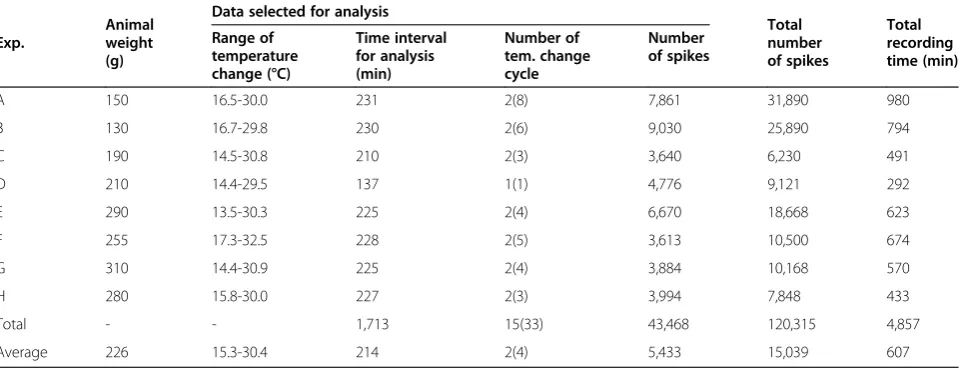
(16-18-20-22-24-26-Table 1 Animal weights and electrophysiological properties of signals generated by eight R15 bursting pacemaker neurons inA. julianaspecimens
Exp.
Animal weight (g)
Data selected for analysis
Total number of spikes
Total recording time (min) Range of
temperature change (°C)
Time interval for analysis (min)
Number of tem. change cycle
Number of spikes
A 150 16.5-30.0 231 2(8) 7,861 31,890 980
B 130 16.7-29.8 230 2(6) 9,030 25,890 794
C 190 14.5-30.8 210 2(3) 3,640 6,230 491
D 210 14.4-29.5 137 1(1) 4,776 9,121 292
E 290 13.5-30.3 225 2(4) 6,670 18,668 623
F 255 17.3-32.5 228 2(5) 3,613 10,500 674
G 310 14.4-30.9 225 2(4) 3,884 10,168 570
H 280 15.8-30.0 227 2(3) 3,994 7,848 433
Total - - 1,713 15(33) 43,468 120,315 4,857
Average 226 15.3-30.4 214 2(4) 5,433 15,039 607
28-30°C) were averaged over. To reduce experimental variability, in each experiment the bursting neuron was incubated at least 5 min to adapt to a new steady-state temperature before recording rhythmic change.
Results
Definition of AP parameters in burst-firing neuron
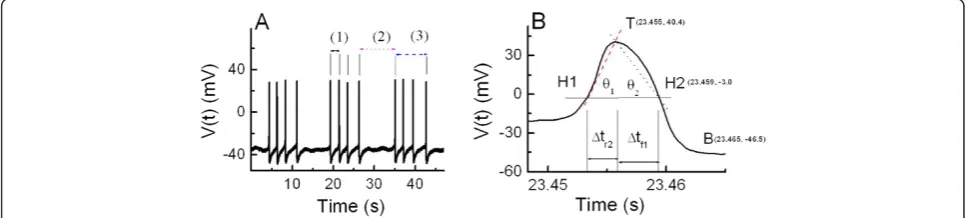
The graph in Figure 1A represents the typical bursting patterns of electrical signals shown in Aplysia bursting pacemaker neuron. The intraburst interspike interval, interburst interval, and burst duration are represented by symbols (1), (2), and (3), respectively. The membrane potentials at the positive peak, Vpp (mV), and negative peak, Vnp (mV), are defined as the values of membrane potentials at points T and B shown in Figure 1B, respect-ively. The definition of the first half of the rising phase of AP, Δtr1 (ms), and the following AP parameters are very similar to those defined in our previous study [1].
The last half of the rising phase of AP,Δtr2(ms) and the first half of the falling phase of AP,Δtf1(ms) are time in-tervals shown in Figure 1B. The last half of the falling phaseΔtf2(ms) is defined as the values of the time inter-val between two points H2 and B shown in Figure 1B. The AP half-width duration,ΔtAP, 1/2(ms), is defined as
Δtr2+Δtf1 (ms). The interspike interval, ISI (ms), is de-fined as Δtr1+ΔtAP, 1/2+Δtf2. The spontaneous firing frequency, simply referred to as Frequency (s−1), is de-fined as ISI−1 (s−1). For convenience, the average angles
θ1andθ2are defined to compare the slope of the second half of the rising phase of the AP with that of the first half of the falling phase. The angle θ1 is defined as the inverse tangent of the ratio of half AAPto Δtr2, and the angle θ2is also defined as the inverse tangent of the
ra-tio of half AAP to Δtf1: θ1≡Arctan V tð ÞtTT‐‐V ttH1ðH1Þ
h i
and θ2≡
Arctan V tð ÞT‐V tðH2Þ tH2‐tT
h i
. Although angles are usually defined
Table 2 Temperature and selected AP parameters in bursting pacemaker neurons maintained for 30 min
Experiments Temperature Number of
bursts/min
Number of spikes/burst
Interbust interval(s)
Burst duration(s)
A 21.48 ± 0.03 4.86 ± 0.31 9.49 ± 0.80 8.72 ± 0.88 2.77 ± 0.20
B 22.61 ± 0.01 6.33 ± 0.36 8.23 ± 0.53 5.96 ± 0.66 3.10 ± 0.16
C 19.45 ± 0.00 2.33 ± 0.08 9.10 ± 0.17 19.46 ± 0.47 2.01 ± 0.03
D 16.34 ± 0.03 4.63 ± 0.19 7.71 ± 0.31 9.07 ± 0.33 2.95 ± 0.08
E 19.11 ± 0.02 4.16 ± 0.17 20.82 ± 0.71 8.68 ± 0.65 5.01 ± 0.10
F 22.20 ± 0.04 3.13 ± 0.22 6.02 ± 0.38 14.47 ± 0.96 3.56 ± 0.16
G 18.22 ± 0.03 2.43 ± 0.13 8.64 ± 0.19 18.79 ± 0.63 2.37 ± 0.05
H 18.86 ± 0.02 5.90 ± 0.38 5.28 ± 0.22 8.54 ± 0.73 1.73 ± 0.07
Average 19.78 ± 0.76 4.22 ± 0.53 9.41 ± 1.70 11.71 ± 1.82 2.93 ± 0.36
Figure 1Typical bursting patterns and AP parameters of bursting pacemaker neuron. (A)Bursting patterns of bursting pacemaker neuron; membrane potential vs. time. The electrophysiological parameters related to burst firing contain the intraburst interspike interval, the duration between the two points of sequential Vppwithin one burst firing event [A(1)]; interburst interval, the duration between the two points of the last
Vppof one burst firing event and the first Vppof next burst firing event [A(2)]; and burst duration, the duration between the two points of the
first Vppand the last Vppwithin one burst firing event [A(3)].(B)Definition of AP parameters. The maximum point T on the upper part of AP
means a positive peak membrane potential, Vppand the minimum point B on the lower part of AP means a negative peak membrane potential,
Vnp. H1 and H2 means the half point of potential difference during the rising phase and the falling phase of AP, respectively. The last half of the
rising phase,Δtr2designate the time intervals between the two point H1 and T. The first half of the falling phase of AP,Δtf1is defined as the
time interval between point T and point H2. The angleθ1shows the inverse tangent of the ratio of half AAPtoΔtr2and angleθ2 means the
as dimensionless quantities, these angles are defined dif-ferently for convenience. The AP amplitude, AAP (mV), is defined as the absolute value of difference between the two values of membrane potentials at points T and B, respectively. More detailed analytical techniques re-garding the definition and computational analysis of AP parameters and others were described previously [1,25]. Data were processed using the scientific data analysis tools, C++, Origin 6.0, and Mathematica 5.1, and the resulting data were presented as mean ± SE (standard error).
Structure of the selected dataset for AP parameter analysis
Eight experiments (A−H) were conducted usingA. juliana specimens, and Table 1 shows the animal weights, se-lected data for analysis, total number of spike, and total recording time.
Animal weights were between 130 and 310 g, and the average weight was 226 g. The average total number of spike and average total recording time of each experiment were 15,039 spikes and 607 min, respectively. It was ne-cessary to select the middle portion of each recorded data-set for analysis. The average values of time intervals for analysis, numbers of cycles of temperature change, and number of spike selected for analysis of these selected data were 214 min, 2 cycles, and 5,433 spikes, respectively. The dataset gathered for analysis was composed of these se-lected data from each experiment. The total time inter-val for analysis and the total number of spike of this dataset were 1,713 minutes and 43,468 spikes, respect-ively. The numbers written in parentheses in the middle column of Table 1 represent the total number of cycles of temperature change for each experiment.
In each experiment, the temperature was maintained at room temperature for the first one hour. As shown in Table 2, average values of temperature and four AP pa-rameters of burst-firing neurons were calculated using the selected dataset saved by intracellular recordings during maintaining at room temperature for 30 minutes; all data were selected after 5 to 10 minutes from temperature change onset. Because the standard errors of the values of these parameters were low, the bursting patterns of these experiments might be considered as regular while the temperatures were held constant at room temperature.
Temperature dependence of AP parameters in burst-firing neurons
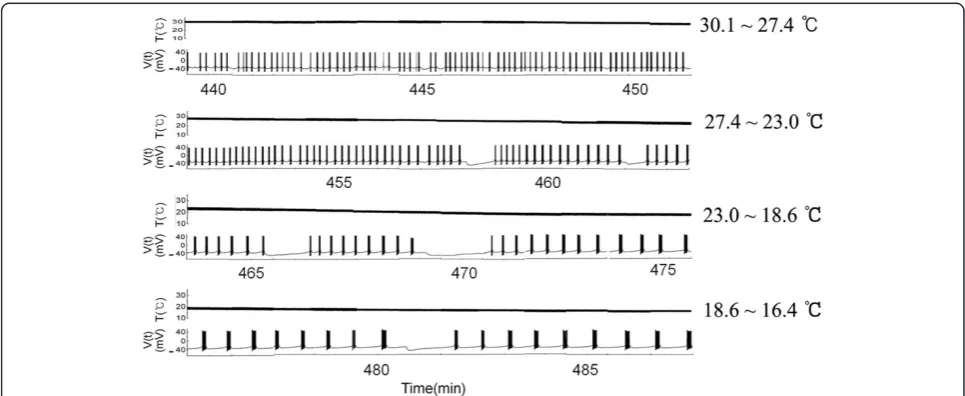
We selected burst trains in a continuous time series from the intracellular recording data of experiment A during the fourth falling phase (from 440 to 487 min) (Figure 2) out of the eight falling phases in temperature recorded during eight consecutive heating−cooling cy-cles: it was composed of 48 panels. Temperature and membrane potentials are represented as the upper and lower traces in Figure 2, respectively. These figures dem-onstrated that interburst interval, burst duration, and number of spike during burst decreased as temperature increased. Next, we extracted six burst signals (6 panels) among many burst signals to examine the temporal change of instantaneous ISI during burst at specific temperature; 30.0°C (at 440 min), 26.9°C (at 454 min), 23°C (at 464 min), 21.3°C (at 468 min), 19.1°C (at 474 min), and 16.4°C (487 min). As shown in Figure 3, ISI during burst versus time displayed parabolic pattern, suggesting that temperature-dependent bursting patterns are parabolic
bursts characterized by lower spike frequency at the be-ginning and end of the burst. The analyzing dataset was composed of 1,713 files corresponding to the sum of each selected time interval for analysis as shown in the 4th column of the Table 1.
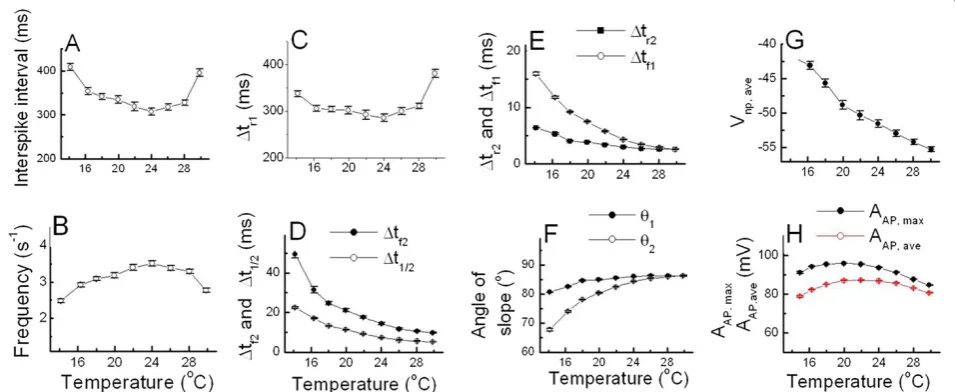
With the selected data shown in Table 1, the temperature-dependent properties of AP parameters were analyzed by using techniques similar to those de-scribed in Hyun et al. [1]. As shown in Figure 4A and C, all values of ISI andΔtr1decreased and then increased as the temperature was raised, but frequency shown in Figure 4B rose and then fell as the temperature in-creased. Figure 4D, E and G show that the parameters
Δtf2, Δt1/2, Δtr2, Δtf1, and Vnp,ave decreased as the temperature was raised with small standard errors for each value. On the other hand, the values of angles
shown in Figure 4F increased as the temperature was raised, and the values of angleθ1were larger than those of θ2. In addition, both AAP, max and AAP, ave shown in Figure 4H increased and then decreased as the temperature was raised. These temperature dependen-cies of AP parameters (except AAP, max, AAP, ave, and an-gles) were similar to the case of those analyzed using a dataset obtained from beating cells: in that case, AAP,ave decreased as the temperature was raised between 16°C and 28°C, but AAP, ave, and angles were not shown [1].
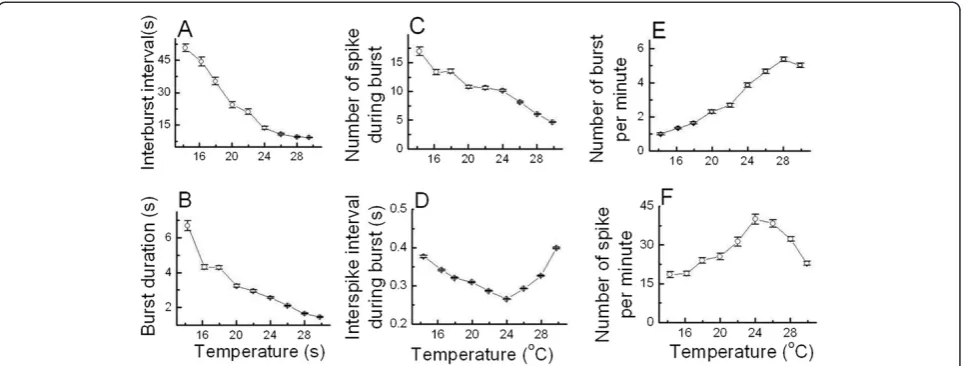
Temperature dependence of bursting patterns in burst-firing neurons
The values of six temperature-dependent burst parame-ters were averaged by using these selected dataset shown in Table 1. As shown in Figure 5A, B, and C respectively, Figure 3Plot of interspike intervals during a burst versus time. (A)Figures drawn by using data calculated from the burst shown on panels in Figure 2: parabolic shape. The values of temperature corresponding to the figures from the left to the right are 30.0°C, 26.9°C, 23.0°C, 21.3°C, 19.1°C, and 16.4°C, sequentially.(B)The values of each figure are the same as those shown in (A): all the figures were shown with the same start time.
Figure 4Temperature-dependent AP parameters of burst-firing neurons.The values of ISI(A)andΔtr1(C)decreased and then increased as
temperature increase, but frequency(B)and the values of AAP, maxand AAP, ave(H)showed the reversed pattern according to the change of
temperature.Δtf2andΔt1/2(D),Δtr2andΔtf1(E), Vnp,ave(G)decreased as temperature increase and the values of angleθ1andθ2(F)showed the
interburst interval, burst duration, and number of spike during burst decreased as temperature increased. ISI during burst shown in Figure 5D firstly decreased and then increased as temperature increased. In contrast, the numbers of burst per minute and of spike per minute shown in Figure 5E and F respectively increased and then decreased as the temperature was raised.
However, since these six burst parameters were not in-dependent parameters, some equations representing an interrelationship between these parameters of burst-firing neurons could be driven; number of spike during burst = (burst duration)/(inter spike interval during burst), number of spike per minute = (number of spike during burst) × (number of burst per minute), and number of burst per minute = 60/(interburst interval + burst duration).
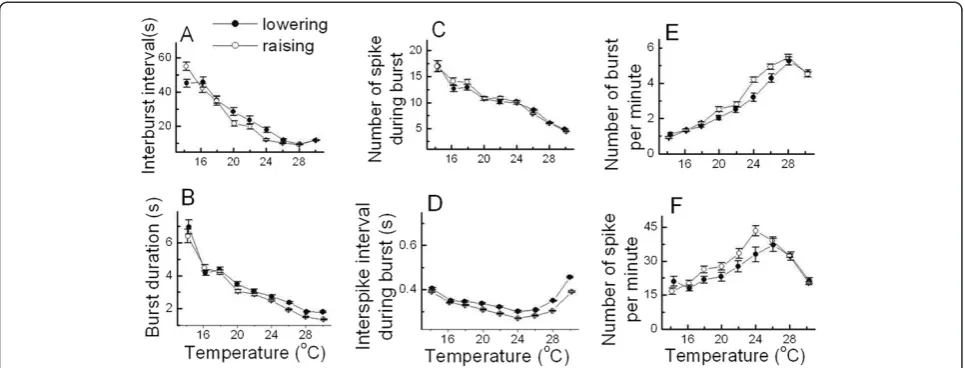
The values of these six temperature-dependent burst pa-rameters during lowering the temperature (●) and raising the temperature (○) are shown in Figure 6. In the cases of interburst interval, burst duration, number of spike during burst, and ISI during burst shown in Figure 6A, B, C, and D respectively, there were no significant differences in these parameter values between the cooling-off and heat periods, which could be considered that there were reproducible properties of temperature dependencies in these burst parameters. Moreover, the number of burst per minute and spike per minute during heating shown in Figure 6E and F were slightly larger than those dur-ing cooldur-ing between 19°C and 25°C. However, it might be thought that the reproducible property of temperature-dependent changes in bursting patterns could not be undermined by these. It is because the values of the experi-mental percentage error of interspike interval during burst were between 0.1% and 14.1%; experimental percentage
error≡100% × | value of bursting parameter during heating (cooling) - average value of bursting parameter |/ average value of bursting parameter.
Thus, each mean value of functional forms of reproducible temperature-dependent bursting parameters in Figures 5 and 6 could be calculated by using these dataset and the computer program we designed. It was shown that these six bursting parameters changed in response to temperature variation, but the mechanism underlying these correlations remains unverified. So, it was suggested that performing computational simulations of these phenomena by using a modified Plant model which were composed of equations with temperature-dependent scaling factors was necessary to mathematically clarify the temperature-dependent changes of bursting patterns in burst-firing neurons.
Simulation of temperature-dependent bursting patterns
In order to simulate various temperature-dependent spik-ing patterns of burstspik-ing pacemaker neuron, we set up nonlinear differential equations by modifying the Plant model [15] with temperature-dependent scaling factors [25-27]. The Plant model studied by Rinzel and Lee was designed to assess parabolic bursters by analyzing the fast and slow processes to show how spike activities were gen-erated by their mutual interaction [16].
and finally brings to an end of bursting activity. This sys-tem also contains a leak current, IL.
−Cm
dV
dt ¼ ρð ÞT INaþICaþIKþIK Cað Þ
þIL
¼ρð ÞT (
gNa⋅m3∞ð ÞV ⋅h⋅ðV‐VNaÞ þgCa⋅χ⋅ðV‐VCaÞ
þ gK⋅n4þgK‐Ca
Ca 0:2þCa
⋅ðV‐VKÞ þgL⋅ðV‐VLÞ;
ð1Þ
dh
dt¼ϕð Þ⋅T λ
h∞ð ÞV ‐h
½
τhð ÞV ;
dχ dt¼ϕð ÞT
χ∞ð Þ−V χ
τχ ;
dn
dt¼ϕð Þ⋅T λ
n∞ð Þ−V n
½
τnð ÞV ;
dCa
dt ¼ρ⋅½Kc⋅χ⋅ðVCa−VÞ−Ca;
ð2Þ
Where
m∞ð Þ ¼V
μm 50−αV−β
e
50−αV−β 10
−1
μm 50−αV−β
e
50−αV−β 10
−1
þ4e
25−αV−β 18
;
h∞ð Þ ¼V μhe
25−αV−β 20
μhe
25−αV−β 20
þ 1
e
55−αV−β 10
;
χ∞ð Þ ¼V
1 1þeγ δð−VÞ;
ð3Þ
and
n∞ð Þ ¼V
μn 55−αV−β
e
55−αV−β 10
μn 55−αV−β
e
55−αV−β 10
−1
þνne
45−αV−β 80
;
τhð Þ ¼V
1
μhe
25−αV−β 20
þ 1
e
55−αV−β 10
þ1
;
and
τnð Þ ¼V τn
μn
55−αV−β
e
55−αV−β
10
ð Þ−1þνne
45−αV−β
80
ð Þ ð4Þ
WheregNa,gCa,gK, andgL are maximal conductances for the Na+, Ca2+, K+, and Cl−currents, respectively, and VNa, VCa, VK, and VL are the reversal potentials for the respective currents: gK Cað Þ is maximal conductance for calcium-activated potassium current. Here, voltage, V in-dicates membrane potential (mV).
The voltage-dependent activation and inactivation var-iables for sodium channels aremand hrespectively, and the activation variable for potassium channels is n. A slowly activating conductance for calcium current is de-noted by χ, and a slow change in intracellular free cal-cium concentration Ca, is treated as parameters. The maximal relaxation time constants of h and n are defined as 1
λ. It is taken that ρ−1is an estimate for the time-constant of the Ca-equation. The temperature-dependent scaling factors, ρ(T) and ϕ(T), are defined as
ρð ÞT ≡1:310T‐T0C and ϕð ÞT≡3 T−T0
10C , respectively [25]. The
steady-state values of activation or inactivation variables m∞, h∞,χ∞, and n∞are functions of voltage. The
relax-ation time constants are represented byτh,τχ, andτn.
Comparison of experimental and simulation results
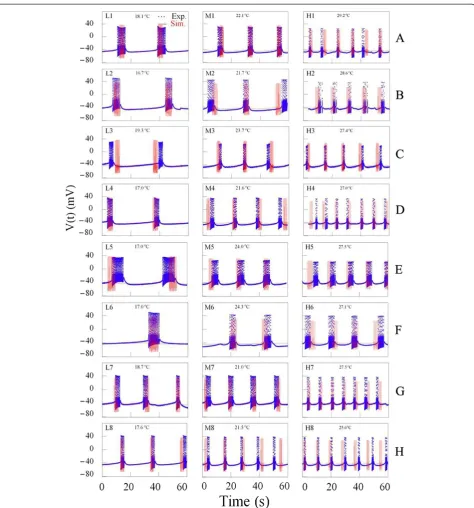
In order to obtain good computer simulation of temperatudependent bursting patterns generated re-spectively by these eight bursting pacemaker neurons, it was necessary to select three good data files of each ex-periment. The figures drawn by using data files selected during the same rising (or falling) phase of temperature change from dataset of experiment A at temperatures below 20°C, between 20°C and 25°C, above 25°C, were expressed by symbols L1, M1, H1, respectively, shown on Figure 7. Similarly, the figures shown by using data files selected from datasets of experiments B–H at the same temperature ranges were symbolized by L2- L8, M2 - M8, and H2 - H8, respectively, shown on Figure 7.
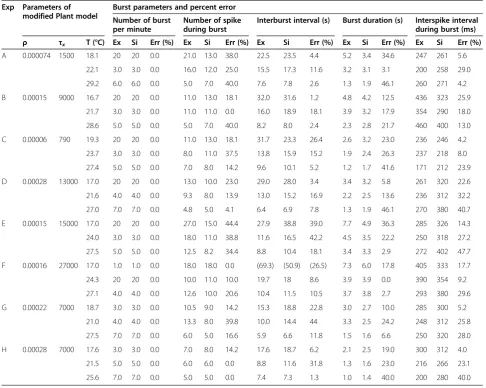
Then, it was necessary to describe how to draw three figures shown on the panels L1, M1, and H1 in Figure 7. Firstly, temperature values shown on these figures should be substituted for T in the temperature-dependent scaling factors,ρ(T) andϕ(T) involved in modified Plant model. Secondly, computer simulation should be carried out until percentage errors of all parameters had to be calculated below 50%: the results of these calculations were shown at first three rows in Table 3. However, percentage error could be defined with the following formula shown below: Finally, numerical values of each of the 24 parameters involved in equations (1) to (4) would be fixed: Cm= 1
gCa¼0:007 mmho=cm2, g
K¼0:60 mmho=cm2, gL¼
0:017 mmho=cm2, V
Na= 40 mV, VCa= 140 mV, VK=−75 mV, VL=−40 mV, λ= 0.18, ρ= 0.000074 ms−1, τχ= 1, 500, Kc= 0.0275 mV−1, α= 127/105, β= 8265/105, γ= 0.3,
δ=−18, μm= 0.1, μh= 0.08, μn= 0.016, νn= 0.1, τn¼1 ,
T0= 23.0°C. Here, we took a value of 23°C as the reference temperature T0because bursts are usually activated from 22°C to 25°C, and this represented the middle value of temperature range of the experiment A; from 16.0°C to 30.0°C.
To simulate the other figures shown in Figure 7, it was necessary to fix the same numerical values of each of the 22 parameters as those used in experiment A, except the
values of ρ and τx. And then, computer simulation
should be carried out by changing parameter values ρ
and τx until percentage errors of all parameters had to be calculated below 50%: interburst interval, burst dur-ation, and number of spike per burst were increased (number of burst per minute decreased) asρ, andτx in-creased. The results of these calculations were shown from 4th row to the last row in Table 3: the values of all calculated percentage errors were between 0 and 47.7%. Here, the results about the number of spike per minute among burst parameters was excluded from Table 3, be-cause all percentage errors in the number of burst per minute were 0.0 and then the values of number of spike during burst would be the same as the values of number of spike per minute.
The results of computer simulation with the values of temperature shown on each panel in Figure 7 are
represented as the time series of bursting activity. Al-though the results of simulation (red solid line) of AP amplitude were not completely optimal, simulation data for number of burst per minute, number of spike during burst, inter-burst interval, burst duration, and interspike interval during burst were well reflected by modified Plant model when these simulation results were com-pared to the experimental results (blue dotted line).
Therefore, analysis and simulation of the experimental data by our equation model might be helpful for under-standing the mechanisms underlying the change of temperature-dependent bursting activity in neurons.
Discussion
In the previous study we analyzed the temperature-dependent change of 14 AP parameters (such as the AP amplitude, membrane potential at the positive peak, ISI, first half and last half of the temperature rising phase, first half and last half of the temperature falling phase, absolute value of the membrane potential at negative peak, abso-lute value of the maximum slope of the AP during the temperature rising and falling phases, and spiking fre-quency) in Aplysia neurons [1]. With these findings, in this study we tried to examine the temperature-dependent change of bursting patterns in pacemaker neuron at
abdominal ganglion of Aplysia juliana. Furthermore,
we attempted to identify the mechanism underlying the temperature dependence of busting by developing an equation model predicting neuronal electrophysio-logical activity with a function of temperature.
Percentage error≡jthe average value of the simulated data‐the average value of the experimental dataj
the average value of the experimental data 100%
Temperature-dependent change of bursting patterns
Firstly we conducted real experiments with bursting pace-maker neurons in order to explore the functional relation between temperature and bursting patterns as well as AP parameters. We examined the temperature-dependent
activity of bursting pacemaker neurons during several
consecutive heating−cooling cycles. We tested the
were analyzed with the selected data shown in Table 1 by using techniques similar to those described in Hyun et al. [1].
The values of inter-burst interval, burst duration, and number of spike during burst decreased as the temperature increased, and it was possible to confirm functional prop-erties of temperature dependencies in six burst parameters. When compared to data reported by other research group, Fletcher and Ram analyzed changes of AP parameters of burst-firing neurons during heating by investigating AplysiaR15 pacemaker neuron activity in the temperature range of 23 – 37°C; they found that interburst interval, burst duration, and number of spike per burst all de-creased within the temperature range of 23 to 32°C [21]. We found that our data are consistent with results re-ported by Fletcher and Ram [21] within the temperature range of 23 to 30°C. Furthermore, the present study
revealed that the values of ISI andΔtr1decreased and then increased, frequency increased and then decreased, and the parametersΔtf2,Δt1/2,Δtr2,Δtf1, and Vnpall decreased as the temperature was raised. These results were similar to those shown in previously published paper [1]. Fletcher and Ram also showed that intra-burst spike broadening and spike height decreased as temperature increased [21]. These results were also in good accordance with our experimental results within the temperature range of 23 to 30°C. Because Δt 1/2 and AAP,ave decreased as temperature increased in the temperature range of 23 to 30°C, as shown in Figure 4D and H: two parameters, spike-broadening and spike height, could be compared with two AP parameters, ΔtAP,1/2 and AAP,ave, respect-ively. Moreover the present study generated quantitative data regarding the temperature-dependent properties of the other three AP parameters of burst-firing neurons
Table 3 Comparison of experimental and simulation results
Exp Parameters of modified Plant model
Burst parameters and percent error
Number of burst per minute
Number of spike during burst
Interburst interval (s) Burst duration (s) Interspike interval during burst (ms) ρ τx T (°C) Ex Si Err (%) Ex Si Err (%) Ex Si Err (%) Ex Si Err (%) Ex Si Err (%)
A 0.000074 1500 18.1 20 20 0.0 21.0 13.0 38.0 22.5 23.5 4.4 5.2 3.4 34.6 247 261 5.6
22.1 3.0 3.0 0.0 16.0 12.0 25.0 15.5 17.3 11.6 3.2 3.1 3.1 200 258 29.0
29.2 6.0 6.0 0.0 5.0 7.0 40.0 7.6 7.8 2.6 1.3 1.9 46.1 260 271 4.2
B 0.00015 9000 16.7 20 20 0.0 11.0 13.0 18.1 32.0 31.6 1.2 4.8 4.2 12.5 436 323 25.9
21.7 3.0 3.0 0.0 11.0 11.0 0.0 16.0 18.9 18.1 3.9 3.2 17.9 354 290 18.0
28.6 5.0 5.0 0.0 5.0 7.0 40.0 8.2 8.0 2.4 2.3 2.8 21.7 460 400 13.0
C 0.00006 790 19.3 20 20 0.0 11.0 13.0 18.1 31.7 23.3 26.4 2.6 3.2 23.0 236 246 4.2
23.7 3.0 3.0 0.0 8.0 11.0 37.5 13.8 15.9 15.2 1.9 2.4 26.3 237 218 8.0
27.4 5.0 5.0 0.0 7.0 8.0 14.2 9.6 10.1 5.2 1.2 1.7 41.6 171 212 23.9
D 0.00028 13000 17.0 20 20 0.0 13.0 10.0 23.0 29.0 28.0 3.4 3.4 3.2 5.8 261 320 22.6
21.6 4.0 4.0 0.0 9.3 8.0 13.9 13.0 15.2 16.9 2.2 2.5 13.6 236 312 32.2
27.0 7.0 7.0 0.0 4.8 5.0 4.1 6.4 6.9 7.8 1.3 1.9 46.1 270 380 40.7
E 0.00015 15000 17.0 20 20 0.0 27.0 15.0 44.4 27.9 38.8 39.0 7.7 4.9 36.3 285 326 14.3
24.0 3.0 3.0 0.0 18.0 11.0 38.8 11.6 16.5 42.2 4.5 3.5 22.2 250 318 27.2
27.5 5.0 5.0 0.0 12.5 8.2 34.4 8.8 10.4 18.1 3.4 3.3 2.9 272 402 47.7
F 0.00016 27000 17.0 1.0 1.0 0.0 18.0 18.0 0.0 (69.3) (50.9) (26.5) 7.3 6.0 17.8 405 333 17.7
24.3 20 20 0.0 10.0 11.0 10.0 19.7 18 8.6 3.9 3.9 0.0 390 354 9.2
27.1 4.0 4.0 0.0 12.6 10.0 20.6 10.4 11.5 10.5 3.7 3.8 2.7 293 380 29.6
G 0.00022 7000 18.7 3.0 3.0 0.0 10.5 9.0 14.2 15.3 18.8 22.8 3.0 2.7 10.0 285 300 5.2
21.0 4.0 4.0 0.0 13.3 8.0 39.8 10.0 14.4 44 3.3 2.5 24.2 248 312 25.8
27.5 7.0 7.0 0.0 6.0 5.0 16.6 5.9 6.6 11.8 1.5 1.6 6.6 250 320 28.0
H 0.00028 7000 17.6 3.0 3.0 0.0 7.0 8.0 14.2 17.6 18.7 6.2 2.1 2.5 19.0 300 312 4.0
21.5 5.0 5.0 0.0 6.0 6.0 0.0 8.8 11.6 31.8 1.3 1.6 23.0 216 266 23.1
25.6 7.0 7.0 0.0 5.0 5.0 0.0 7.4 7.3 1.3 1.0 1.4 40.0 200 280 40.0
(): 2-minute average value, Exp & Ex: experimental value.
Si: simulation parameter value, Err:Percent error ¼ jthe average of the experimental data‐the average of the simulated dataj
the average of the experimental data 100%. Computer simulation should be carried out
(ISI during burst, number of burst per minute, and number of spike per minute) and nine other AP param-eters (ISI,Δtr1,Δtr2,Δtf1,Δtf2,θ1,θ2, Vnp, and AAP, max).
Mechanism underlying the temperature dependence of busting: choice of the model
Numerous revised model of bursting in R15 [17-19,28] have been developed since the mid-1980s. Canavier et al. [17] developed the model of bursting in R15 with 10 currents and 11 static variables; 10 currents (the fast Na+-current INa, the fast Ca2+-current ICa, the delayed rectifier K+-current IK, the slow inward Ca2+-current ISI, the nonspecific cation current INS, the anomalous recti-fier current IR, the leak current IL, K+-current IK, the Na+-Ca2+ exchanger current INaCa, the Na+-K+ pump current INaK, and the Ca2+ pump current ICaP), and 11 static variables (membrane potential V, intracellular concentration of Ca2+ [Ca]i, the occupancy of the intra-cellular Ca2+-buffer Oc, and eight voltage-dependent state-variables (m, h, d, f, n, l, s, b)). The parabolic burst-ing pattern results from two competburst-ing processes, the slow voltage-dependent activation of the slow inward Ca2+-current (ISI), and the still more slower calcium-dependent inactivation of this same current. Butera et al. [19] also developed the models of bursting in R15 with 10 currents and 12 static variables; 10 currents (the fast Na+-current INa, the fast Ca2+-current ICa, the delayed rectifier K+-current IK, the slow inward C2+-current ISI, the nonspecific cation current INS, the anomalous recti-fier current IR, the leak current IL, K+-current IK, the Na+-Ca2+ exchanger current INaCa, the Na+-K+ pump current INaK, and the Ca2+ pump current ICaP), and 12 static variables (membrane potential V, intracellular con-centration of Ca2+ [Ca2+]i, intracellular concentration of cAMP [cAMP], the occupancy of the intracellular Ca2+-buffer Oc, and eight voltage-dependent state-variables (m, h, d, f, n, l, s, b)). The slow inward Ca2+ current (ISI) in this model is the key current responsible for leading to bursting phenomena.
In addition to these models, Bertram [18,29] developed a mathematical model of bursting neuron R15 including 8 currents and 11 static variables; 8 currents (excitatory sodium current INa, excitatory calcium current ICa, in-hibitory potassium current IK1 and IK2 , small leakage current IL, calcium current which initiate the burst INSR, and cation-nonspecific current ID, and a potassium current which is activated only near the potassium equi-librium potential IR') and 11 static variables (membrane potential V, intracellular concentration of Ca2+c, and nine voltage-dependent state-variables (m, h, n, j, q, y,μ, r, x)). Two subthreshold burst currents, the calcium current which initiate the burst INSR and the cation-nonspecific current ID, induce the busting oscillation.
To mathematically clarify the temperature-dependent changes of bursting patterns in burst-firing neurons, it was suggested to perform computational simulations of these phenomena by using a proper model composed of equations with temperature-dependent scaling factors.
We have tried to conduct computational simulations by using modified models: in modifying the models that were developed by Canavier et al. [17] and Butera et al.
[19], the maximal conductances of currents gi were
multiplied by temperature-like scaling factor for currents
ρð ÞðT giρð Þ ¼T gi1:3T10‐T0C , i = Na, Ca, K, SI, NS),
and the relaxation time constant Tj were multiplied
by temperature-like scaling factor for ionic kinetics Tjðð1=TjÞ ϕðTÞ ¼ ð1=τjÞ 3
T‐T0
10C, j = m, h, d, f, n, l, s, b).
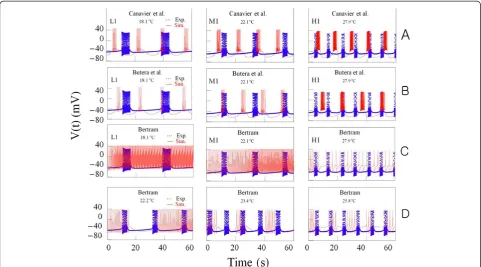
In order to obtain computer simulation of temperature-dependent bursting patterns, it was necessary to select three good data files obtained from experiment A at dif-ferent temperatures; 18.1°C, 22.1°C, and 27.9°C. The fig-ures drawn by using these data files were expressed by symbols L1, M1 and H1, respectively, shown on the panels at Figure 8A and B. After temperature values shown on these panels should be substituted for T in the temperature-dependent scaling factors, ρ(T) and ϕ (T) involved in these modified models (T0= 23°C), we could get these figures drawn in red solid lines and these were shown on these panels. In the results of simula-tions with these modified models, it could be found that burst duration and number of spike during burst in-creased as temperature inin-creased. But these results were not consistent with our experimental results. So, al-though the model presented by Canavier et al. [17] and Butera et al. [19] were based on experimental data to a great extent, it might be thought that these models are not appropriate for investigation about the ionic mech-anism underlying the temperature-dependent change in bursting pattern from experiments with bursting
pace-maker neurons in the abdominal ganglia of Aplysia
juliana.
during burst obtained from simulations were larger than those got from experiments, and these values could not be reduced: the values of the other bursting parameters might be given rise to inconsistencies with our experi-mental results. Thus, it might be thought that this model was not also appropriate for investigation about that.
Any way, it was shown that that IK(Ca)is not involved in burst termination inAplysiabursting neurons Kramer and Zucker [30]. Even though calcium-activated potas-sium channels are located in the soma of R15 neuron, it was not necessarily proved that this channel was import-ant for bursting pattern. Next, we have to discuss on the following question: are there any other experimental evidences suggesting that IK(Ca) is involved in bursting pattern ofAplysianeurons, particularly R15 neuron? Al-though we didn’t yet find any one of research papers that were published after year 1985, it might be neces-sary to discuss whether the figures that we have sug-gested in this paper could be given us any chance to run back over the experimental evidence on it.
Now, it might be necessary to compare the temperature-dependent changes in burst firing patterns of subthresh-old currents (or burst currents) involved in Plant model with those included in the other models. Time series of
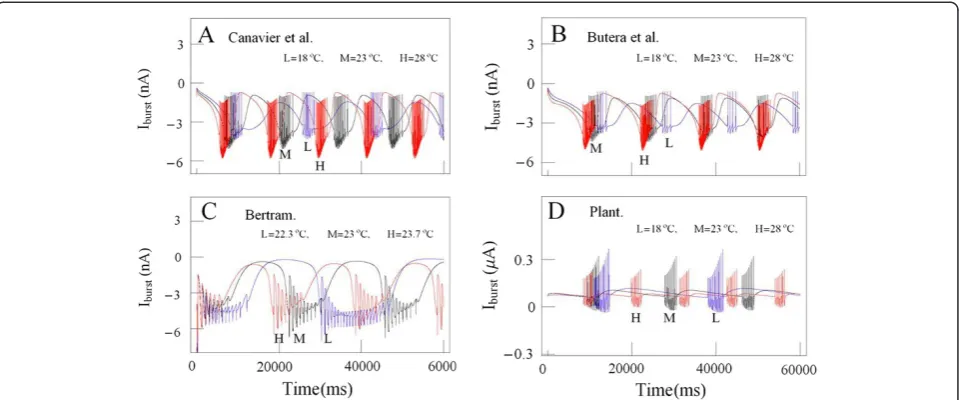
temperature-dependent subthreshold current activities (ρ(T)∙ISI) simulated by using the equation of slow in-ward calcium current based on the model developed by Canavier et al. [17] at temperature values 18°C, 23°C, and 28°C are shown together in blue lines (L), black lines (M), and red lines (H), respectively on panel A in Figure 9. Those (ρ(T)∙ISI) and (ρ(T)∙(ICa+ IK(Ca))) ob-tained from simulation data by using the model made by Butera et al. [19] and Plant [15] at the same temperature values are shown together on panel B and D in Figure 9, respectively. Those (ID+ρ(T)∙INSR) taken from simulation data calculated by using the model made by Bertram [18] at temperature values 22.3°C, 23° C, and 23.7°C are shown together on panel C in Figure 9. Next, it might be wanted to calculate the maximum values of temperature-dependent burst currents under-lying the hyperpolarization of the inter-burst intervals, and then compare the values that were calculated by using Plant developed model with those by using the other models. The maximum values of these calculated by using Plant model at temperature values 18°C, 23°C, and 28°C were 0.28μA, 0.12μA, and 0.081μA, respect-ively. The maximum values calculated by using Canavier et al. (Butera et al.) developed model at the same Figure 8Time series of bursting activity drawn by using the data for the experiments A and computer simulations at different
temperature values were−1.62 nA,−0.9 nA, and−0.75 nA (−1.5 nA,−1.1 nA, and−0.77 nA), respectively. The max-imum values calculated by using the model that Bertram developed at the temperature values 22.3°C, 23°C, and 23.7°C were−0.18 nA, −0.38 nA, and−0.58 nA, respect-ively. These absolute maximum values calculated by using the models that Plant, Canavier, and Butera developed de-creased as temperature inde-creased, but those calculated by Bertram developed model increased as temperature in-creased. But more detailed analysis of these data remained as a challenge for future study.
Anyway, these facts might show that it was hard to clarify mathematically the temperature-dependent changes of bursting patterns at burst-firing neurons of Aplysia juliana with these three models involving many currents and a large number of static variables. So, it was necessary to investigate much simpler model with small number of currents and static variables such as Plant model.
At this stage, it might be useful to remind that temperature-dependent impulse patterns of mammalian cold receptors could be well simulated by using nonlin-ear differential equations involving IK(Ca). Different types of impulse patterns of mammalian cold receptors can be observed as a function of skin temperature: irregular and less frequent burst discharges, regular and frequent bursting patterns, and irregular single spike patterns are observed from low to high temperatures. These patterns could be simulated by Braun et al., and the Huber-Braun cold receptor model has been described in detail with 5 currents and 5 static variables (membrane potential and
four voltage-dependent state-variables) [26,27,31-36]. This model consisted of two minimal sets of ionic con-ductances operating at different voltage levels with dif-ferent delays and the leakage current. The first two voltage-dependent currents that generate the action po-tentials mean depolarizing current INa and repolarizing current IK. The next two voltage-dependent slow cur-rents that generate subthreshold potential oscillations were slow depolarizing noninactivating Na+-current INap and slow repolarizing Ca2+-dependent K+-current IK(Ca) with voltage dependent activation of Ca2+-current. The temperature dependences were given by temperature-like scaling factors for the maximum conductances and the time constants, with reference temperature T0= 25°C. Q10of 3.0 for the activation variable and Q10of 1.3 for temperature dependences of maximum conductances were chosen.
Now, it would be necessary to look into another simple model to investigate the mechanisms of temperature-dependent changes of bursting patterns which share a few similarities with mammalian cold receptors. Plant model consisted of 5 currents and 6 static variables: 5 currents (fast sodium current INa, fast potassium current IK, inward calcium current ICa, calcium-activated potassium current IK(Ca), and leakage current, IL) and 6 static variables (membrane potential, intracellular concentration of Ca2+, and four voltage-dependent state-variables). There are two fast and slow processes in this model. The fast process had three components: the activation and inactivation var-iables for Na+channels“m”and“h”, respectively, and the Figure 9Comparison of temperature-dependent subthreshold current activities. (A)Time series of temperature-dependent subthreshold current activities (ρ(T)∙ISI) simulated by using the results based on the model developed by Canavier et al. [17] at temperature values 18°C (L, blue
lines)), 23°C (M, black lines), and 28°C (H, red lines) are shown together.(B)Those (ρ(T)∙ISI) obtained from simulation data at the same temperature
values using the model made by Butera et al. [19] are shown together.(C)Those (ID+ρ(T)∙INSR) taken from simulation data at temperature values
22.3°C, 23°C, and 23.7°C using the model made by Bertram et al. [18] are shown together.(D)Those (ρ(T)∙(ICa+ IK(Ca))) obtained from simulation
activation of K+ channels n. The slow process had two components: a slow conductance for Ca2+-current “X”, and intracellular free calcium concentration “Ca”. Not only Plant model had a simple structure, but also theor-etical analyses of Plant’s model were performed already [16,37,38].
However, it is not easy to justify the reason of our choice of Plant model, because some papers excluded IK
(Ca)as a key bursting current in R15 and focused on the inward current with slow activating and inactivating components. Plant model was based on the works of
Gorman and Thomas [39], who demonstrated that IK
(Ca)was linearly dependent on increasing concentration of intracellular calcium ions (Ca2+) injected into the cytoplasm and expected to be activated during a burst. Chay [40] constructed mathematical model applicable to theAplysiabursting neurons with involving the prop-erties of Ca2+-activated K+ channel: intracellular Ca2+ concentration increases gradually during activity to levels where it activates the IK(Ca) [10]. Although Kramer and Zucker [30] concluded that IK(Ca)did not play a role in burst termination in bursting neurons ofAplysia, Ad-ams and Levitan [41] did not exclude a role for IK(Ca)in the repolarization of action potential. But they asked the question: why a long-lasting IK(Ca)did not be activated by action potential? The plausible answer was the amount of calcium ions that entered into the cell during the activity of action potential was insufficient to gener-ate it. Even if Canavier et al. [17] developed the model without IK(Ca), it was suggested as a limitations of this model that more experimental data of IK(Ca) were re-quired for further investigation. Bertram [18] revised
the model with IK(Ca) conductance depended only on
the constant calcium concentration of the soma. Besides this, it has been known that the calcium activated potas-sium channels are located in R15 soma [42] and elec-trode was inserted into the soma of the cell in the
abdominal ganglion ofA. julianato measure the
mem-brane potentials in our experiments. Thus, we cannot underestimate the impact of IK(Ca),but we did not here want to claim the quantitative application of Plant model, rather, we used it fr understanding the mechan-ism underlying the temperature dependence of busting patterns by computer simulations: it might be challen-ging to work later with a Rinzel and Lee’s model based on the hypothesis that it is necessary for burst gener-ation to consider an inward current which slowly
inacti-vates as Ca2+ accumulates during the burst to the
exclusion of IK(Ca) [16]. By making a comparison be-tween experimental data and simulation results calcu-lated with modified Plant equations, it was suggested that the mechanism underlying temperature-dependent bursting patterns of bursting pacemaker neurons at
ab-dominal ganglion of Aplysia juliana might be derived
from temperature-like scaling factors ρ(T) and ϕ(T) for the maximum conductances and the time constants, re-spectively; together with reference temperature T0= 23°C, Q10 of 3.0 for the activation variable, and Q10 of 1.3 for temperature dependences of maximum conductances.
Taken together, it was suggested that a modified Plant model could be used to simulate the temperature-dependent bursting activity of bursting pacemaker neu-rons in the abdominal ganglia ofAplysia julianaand to unravel the mechanism of temperature dependence in bursting patterns.
Nomenclature
AAP, action potential amplitude
AAP, ave, averaged action potential amplitude AAP, max, maximum action potential amplitude
Ca, slow change in intracellular free calcium concentration Frequency, spontaneous firing frequency (=1/ISI) ISI, interspike interval (=Δtr1+ΔtAP, 1/2+Δtf2) ICa, slow inward calcium current
IK, fast potassium current
IK(Ca), calcium-activated potassium current IL, leak current
INa, fast sodium current
T0, reference temperature (=23°C) V, membrane potential
VCa, reversal potential for calcium current VK, reversal potential for potassium current VL, reversal potential for leak current VNa, reversal potential for sodium current Vnp, membrane potential at the negative peak Vpp, membrane potential at the positive peak
Δtr1, first half of the rising phase of AP
Δtr2, last half of the rising phase of AP
Δtf1, first half of the falling phase of AP
Δtf2, last half of the falling phase of AP
ΔtAP, 1/2, AP half-width duration (=Δtr2+Δtf1)
θ1,inverse tangent of the ratio of half AAPtoΔtr2
θ2, inverse tangent of the ratio of half AAPtoΔtf1
gCa, maximal conductance for calcium ion current
gK, maximal conductance for potassium ion current
gL, maximal conductance for leak current
gNa, maximal conductance for sodium ion current h, voltage-dependent inactivation variable for sodium channel; h∞= steady state value of inactivation h
m, voltage-dependent activation variable for sodium
channel; m∞= steady state value of activation m
n, activation variable for potassium channel; n∞= steady
state value of activation n
μm, constant value involved in the defining equation for m∞
μh, constant value involved in the defining equation for h∞
α, β, γ,δ, constant values involved in the defining equa-tion for steady state values of activaequa-tion (inactivaequa-tion) variables and relaxation constants
1/λ, maximal relaxation time constant of h and n
τn, maximal relaxation time constant of n τh,relaxation constant of h
τχ,relaxation constant ofχ
τn,relaxation constant of n
χ, slowly activating conductance for calcium current;χ∞=
steady state value of activationχ
ρ−1
, estimation for the time-constant of the Ca-equation
ρ(T), temperature-dependent scaling factor;ρð ÞT≡1:3
T‐T0 10C ϕ(T), temperature-dependent scaling factor;ϕð ÞT ≡3
T‐T0 10C
ISI,slow inward Ca2+-current INS,nonspecific cation current IR,anomalous rectifier current INaCa,Na+-Ca2+exchanger current INaK,Na+-K+pump current ICaP,Ca2+pump current
IK1,inhibitory potassium current
INSR,calcium current which initiate the burst ID,cation-nonspecific current
IR, potassium current which is activated only near the potassium equilibrium potential
INap,slow depolarizing noninactivating Na+-current
Competing interests
The authors declare that they have no competing interests.
Authors’contributions
N.G.H. carried out electrophysiological experiments, performed computer simulation of experimental data, and drafted the manuscript. K.H.H. and K.B. H. participated in computer programming for simulation of experimental data. K.L. drafted and revised the manuscript. All authors read and approved the final manuscript.
Acknowledgements
This work was supported by a research grant from the Sochun Academic Research Fund of Jeju National University in 2012. K.L. was supported by Basic Science Research Program NRF-2013R1A1A3010216 and NRF-2013R1A3A1072702 funded by the Ministry of Education, Science and Technology.
Author details
1
Department of Physics and Research Institute for Basic Sciences, Jeju National University, Jeju 690-756, South Korea.2School of Medicine, The Catholic University of Korea, Seoul 137-701, South Korea.3Department of Biological Sciences, Korea Advanced Institute of Science and Technology, Daejeon 305-701, South Korea.4Department of Anatomy, Brain Science & Engineering Institute, Kyungpook National University Graduate School of Medicine, 2-101, Dongin-dong, Jung-gu, Daegu 700-842, South Korea.
Received: 28 May 2014 Accepted: 28 June 2014 Published: 22 July 2014
References
1. Hyun NG, Hyun KH, Lee K, Kaang BK:Temperature dependence of action potential parameters in Aplysia neurons.Neurosignals2012,20:252–264. 2. Murray RW:The effect of temperature on the membrane properties of
neurons in the visceral ganglion of Aplysia.Comp Biochem Physiol1966, 18:291–303.
3. Stephens PJ, Frascella PA, Mindrebo N:Effects of ethanol and temperature on a crab axon action potentials: a possible mechanism for peripheral spike generation.J Exp Biol1983,103:289–301.
4. Heitler WJ, Edwards DH:Effect of temperature on a voltage-sensitive electrical synapse in crayfish.J Exp Biol1998,201:503–513.
5. Frankenhaeuser B, Moore LE:The effect of temperature on the sodium and potassium permeability changes in myelinated nerve fibres of Xenopus laevis.J Physiol1963,169:431–437.
6. Dalton JC, Hendrix DE:Effects of temperature on membrane potentials of lobster giant axon.Am J Physiol1962,202:491–494.
7. Burrows M:Effects of temperature on a central synapse between identified motor neurons in locust.J Comp Physiol A1989,165:687–695. 8. Kerkut GA, Ridge RM:The effect of temperature changes on the activity of the neurons of the snail Helix aspersa.Comp Biochem Physiol1962, 5:283–295.
9. Hodgkin AL, Katz B:The effect of temperature on the electrical activity of the giant axon of the squid.J Physiol1949,109:240–249.
10. Gorman ALF, Hermann A, Thomas MV:Ionic requirements for membrane oscillations and their dependence on the calcium concentration in a molluscan pace-maker neurone.J Physiol1982,327:185–217. 11. Adams WB:Slow depolarizing and hyperpolarizing currents which
mediate bursting in Aplysia neuron R15.J Physiol1985,360:51–68. 12. Adams WB, Benson JA:The generation and modulation of endogenous
rhythmicity in the Aplysia bursting pacemaker neuron R15.Prog Biophys molec Biol1985,46:1–49.
13. Plant RE, Kim M:On the mechanism underlying bursting in the Aplysia abdominal ganglion R15 cell.Math Biosci1975,26:357–375.
14. Plant RE, Kim M:Mathematical description of a bursting pacemaker neuron by a modification of the Hodgkin-Huxley equations.Biophys J
1976,16:227–224.
15. Plant RE:Bifurcation and resonance in a model for bursting nerve cells. J Math Biology1981,11:15–32.
16. Rinzel J, Lee YS:Dissection of a model for neuronal parabolic bursting. J Math Biol1987,25:653–675.
17. Canavier CC, Clark JW, Byrne JH:Simulation of the bursting activity of Neuron R15 in Aplysia: role of ionic currents, calcium balance, and modulatory transmitters.J Neurophysiol1991,66:2107–2124. 18. Bertram R:A computational study of the effects of serotonin on a
molluscan neuron.Biol Cybern1993,69:257–269.
19. Butera RJ, Clark JW, Canavier CC, Baxter DA, Byrne JH:Analysis of the effects of modulatory agents on a modeled bursting neuron: dynamic interactions between voltage and calcium dependent systems.J Comput Neurosci1995,2:19–44.
20. Carpenter DO:Temperature effects on pacemaker generation, membrane potential, and critical firing threshold in Aplysia neurons.J Gen Physiol
1967,50:1469–1484.
21. Fletcher SD, Ram JL:High temperature induces reversible silence in Aplysia R15 bursting pacemaker neuron.Comp Biochem Physiol A1991,98:399–405. 22. Wu J, Fisher RS:Hyperthermic spreading depressions in the immature rat
hippocampal slice.J Neurophysiol2000,84:1355–1360.
23. Kim JA, Connors BW:High temperatures alter physiological proper-ties of pyramidal cells and inhibitory interneurons in hippocampus.Front Cell Neurosci2012,6:27.
24. Orlowski JP, Erenberg G, Lueders H, Cruse RP:Hypothermia and barbiturate coma for refractory status epilepticus.Crit Care Med1984,12:367–372. 25. Hyun NG, Hyun KH, Hyun KB, Han JH, Lee K, Kaang BK:A computational
model of the temperature-dependent changes in firing patterns in Aplysia neurons.Korean J Physiol Pharmacol2011,15:371–382. 26. Braun HA, Huber MT, Dewald M, Schäfer K, Voigt K:Computer simulation
of neural signal transduction: the role of nonlinear dynamics and noise. Int J Bifur Chaos1998,8:881–889.
27. Finke C, Freund JA, Rosa E, Braun HA, Feudel U:On the role of subthreshold currents in the Huber-Braun cold receptor model.Chaos
2010,20:045107–045107–10.
28. Chay TR, Cook DL:Endogenous bursting patterns in excitable cells.Math Biosci1988,90:139–1530.
29. Bertram R:Reduced-system analysis of the effects of serotonin on a molluscan burster neuron.Biol Cybern1994,70:359–368.
31. Braun W, Eckhardt B, Braun HA, Huber M:Phase-space structure of thermoreceptor.Phys Rev E2000,62:6352–6360.
32. Braun HA, Huber MT, Anthes N, Voigt K, Neiman A, Pei X, Moss F: Interaction between slow and fast conductances in the Huber/Braun model of cold-receptor discharges.Neurocomputing2000,32–33:51–59. 33. Braun HA, Huber MT, Anthes N, Voigt K, Neiman A, Pei X, Moss F:
Noise-induced impulse pattern modifications at different dynamical period-one situations in a computer model of temperature encoding. BioSystems2001,62:99–112.
34. Braun H, Vogit K, Huber M:Oscillations, resonances and noise: basis of flexible neuronal pattern generation.BioSystems2003,71:39–50. 35. Feudel U, Neiman A, Pei X, Wojtenek W, Braun H, Huber M, Moss F:
Homoclinic bifurcation in a Hodgkin-Huxley model of thermally sensitive neurons.Chaos2000,10:231–239.
36. Mosekilde E, Sosnovtseva OV, Postnov D, Braun H, Huber MT: Noise-activated and noise-induced rhythms in neural systems.Nonlin Stud
2004,11:449–467.
37. Honerkamp J, Mutschler G, Seitz R:Coupling of a slow and a fast oscillator can generate bursting.Bull Math Biol1985,47:1–21.
38. Soto-Trevino C, Kopell N, Watson D:Parabolic bursting revisited.J Math Biol1996,35:114–128.
39. Gorman ALF, Thomas MV:Potassium conductance and internal calcium accumulation in a molluscan neuron.J Physiol1980,308:287–313. 40. Chay TR:Electrical bursting and intracellular Ca2+oscillations in excitable
cell models.Biol Cybern1990,63:15–23.
41. Adams WB, Levitan IB:Voltage and ion dependences of the slow currents which mediate bursting in Aplysia neuron R15.J Physiol1985,360:69–93. 42. Lewis DV:Calcium-activated inward spike after-current in bursting
neuron R15 of Aplysia.J Physiol Lond1988,395:285–302.
doi:10.1186/s13041-014-0050-5
Cite this article as:Hyunet al.:Temperature-dependent bursting pattern analysis by modified Plant model.Molecular Brain20147:50.
Submit your next manuscript to BioMed Central and take full advantage of:
• Convenient online submission
• Thorough peer review
• No space constraints or color figure charges
• Immediate publication on acceptance
• Inclusion in PubMed, CAS, Scopus and Google Scholar
• Research which is freely available for redistribution