RESEARCH
The global crime drop and changes
in the distribution of victimisation
Ken Pease
1*and Dainis Ignatans
2Abstract
Over three decades crime counts in England and Wales, as throughout the Western world, have fallen. Less attention has been paid to the distribution of crime across households, though this is crucial in determining optimal distribu-tion of limited policing resources in pursuing the aim of distributive justice. The writers have previously demonstrated that in England and Wales the distribution of crime victimisation has remained pretty much unchanged over the period of the crime drop. The present paper seeks to extend the study of changes in the distribution of victimisa-tion over time using data from 25 countries contributing data to the Internavictimisa-tional Crime Victimisavictimisa-tion Survey (ICVS) sweeps (1989–2000). While fragmentary, the data mirror the trends discerned in England and Wales. The trends are not an artefact of the inclusion of particular countries in particular sweeps. The demographic, economical, geographi-cal and social household characteristics associated with victimisation are consistent across time. The suggested policy implication is the need for greater emphasis on preventing multiple victimisation.
Keywords: Victimisation, Crime drop, Crime concentration, Distributive justice, Quantitative criminology
© 2016 The Author(s). This article is distributed under the terms of the Creative Commons Attribution 4.0 International License (http://creativecommons.org/licenses/by/4.0/), which permits unrestricted use, distribution, and reproduction in any medium, provided you give appropriate credit to the original author(s) and the source, provide a link to the Creative Commons license, and indicate if changes were made.
Background
Distributions are as important as measures of central tendency for applicable research. In the burgeoning liter-ature on the near ubiquitous crime drop of recent years, an emphasis on distributions has arguably been lacking. Yet if (for example) the crime drop has been most marked for those who already suffered relatively little crime (as with regressive taxation) one would be concerned about the disproportionate burden which the most victimised continue to suffer. At the operational policing level, it is crucial to know how the diminished crime burden is dis-tributed, so as to inform resourcing and deployment
deci-sions. A recent paper (Ignatans and Pease 2015a) showed
that the crime drop in England and Wales in recent years was greatest in absolute terms for the most victimised households, but not so great relative to the decline of crime generally as to yield a more even distribution of victimisation. The most victimised came to suffer fewer crimes, but these crimes represented a somewhat higher
proportion of the total burden than before.
Disaggrega-tion by offence type (Ignatans and Pease 2015b) showed
that the trends were for all practical purposes uniform across crime types.
The crime drop is common across nations. Are the distributional trends also similar cross-nationally? Early analyses of the crime drop were flawed in their exclu-sive concentration on trends in the USA. This led to the choice as explanatory variables which were specific to that country, such as prison use, police strength and abortion legislation. These variables trended differently in other countries with similar crime drops (Tonry 2014).
The intention here, insofar as the data permit, is to examine whether the trends identified in England and Wales extend beyond its borders. Is the slight increase in inequality of distribution of crime evident in England and Wales also evident elsewhere? The implications for crime control are substantial and will be touched upon in the “Conclusions”.
Main text
For present purposes, four sweeps of the International Crime Victims Survey (ICVS) with a total representative adult sample of over 100,000 respondents over a decade
Open Access
*Correspondence: [email protected]
1 Jill Dando Institute, University College London, 35 Tavistock Square, London WC1H 9EZ, UK
were utilised. ICVS features victimisation reports over a recall period of 1 year that were gathered from 25 coun-tries contributing data in at least one sweep. Thirteen of these countries featured in at least two sweeps. The data used in the analyses comes from countries that were sur-veyed nationally. Roughly 1000–2000 households were interviewed from each country over the phone (Nether-lands Institute for Scientific Information Services 1999). Self-evidently trends require a minimum of two data points to discern so data from twelve countries had to be discarded. The fragmentary nature of the other data, and the fact that the most recent ICVS sweep was in 2000 when the crime drop had been under way for less than a decade, represented challenges. Given the unique nature of the ICVS data and the importance of the topic in the writers’ view, it was a challenge worth accepting.
By taking into account the four-year time elapsing between sweeps, national data present in two or more datasets was deemed sufficient for substantive compari-sons of trends in victimisation concentration over time. Offences were coded identically in all the sweeps, per-mitting consistent comparison across time. All thirteen countries are used in the global analyses (Figs. 1, 2, 3, 4,
5, 6).
Multiple events against the same victim in ICVS are capped to a maximum of five for each offence type. If, for example, someone reports having been assaulted twenty times, the number of assaults is recorded as five. This convention compromises accuracy. The writers’ analy-ses utilising the Crime survey for England and Wales (CSEW) with unlimited incident reporting show many victimisation repeats above the cut-off point of five. The underrepresentation of chronic victims in crime surveys
is controversial (Farrell and Pease 2007; Lauritsen et al.
2012). The pre-imposed ICVS five-count threshold was
by necessity retained. The reader should be aware that by doing so the extent of chronic victimisation, and hence the inequality of victimisation, is understated.
When considering measurement of victimisation ine-quality, a slightly amended approach from that of Lorenz
(1905) was adopted. Households were ranked by number
of victimisations suffered, the ranked households divided into percentiles, and number of victimisations per per-centile for each year calculated. Each perper-centile’s crime could then be expressed as a proportion of the year’s total 0
1 2 3 4 5 6
Mean
Population Percentiles
1989
1992
1996
2000
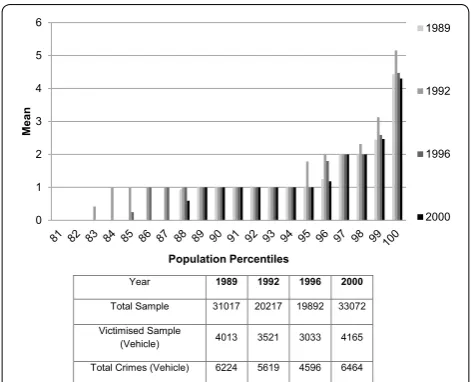
Year 1989 1992 1996 2000
Total Sample 31017 20217 19892 33072
Victimised Sample
(Vehicle) 4013 3521 3033 4165
Total Crimes (Vehicle) 6224 5619 4596 6464
Fig. 1 Mean vehicle victimisations per household by year and per-centile, ICVS Sweeps 1989–2000
0 5 10 15 20 25
81 82 83 84 85 86 87 88 89 90 91 92 93 94 95 96 97 98 99 100
Proportion
Population Percentiles
1989
1992
1996
2000
Year 1989 1992 1996 2000
Total Sample 31017 20217 19892 33072
Victimised Sample
(Vehicle) 4013 3521 3033 4165
Total Crimes (Vehicle) 6224 5619 4596 6464
Fig. 2 Proportion of total vehicle victimisations by year and percen-tile, ICVS Sweeps 1989–2000
0 1 2 3 4 5 6
91 92 93 94 95 96 97 98 99 100
Mean
Population Percentiles
1989
1992
1996
2000
Year 1989 1992 1996 2000
Total Sample 31017 20217 19892 33072
Victimised Sample
(Property) 806 1822 925 1641
Total Crimes (Property) 640 1298 676 1235
victimisations. This permits detailed comparison of ICVS sweeps and countries.
As noted earlier, Ignatans and Pease (2015b) showed
the basic patterns in England and Wales to be similar across crime types. The same approach was applied to ICVS where means and proportions of victimisations by percentile for each crime type.
The figures below thus represent two variables.
• Mean number of victimisations of a particular crime
type suffered by the most victimised percentile, next most victimised, and so on.
• The proportion of all victimisations of that type
suf-fered by the most victimised percentile, next most victimised, and so on.
Results
In all the figures the scales should be noted. They differ, being chosen to provide the clearest representation of the key part of the victimisation distribution. Offences were categorised in the appropriate categories in a fash-ion consistent with previous papers (Ignatans and Pease
2015a, 2015b) attributing all crimes that involve direct contact with the victim to the personal crime category, even where property was taken. Categories were con-structed in the following fashion. Vehicle crimes: car theft, theft from car, damage to vehicle, motor vehicle theft, bicycle theft. Property crimes: burglary, attempted burglary, theft from garage. Personal crimes: robbery, personal theft, sexual offences, assault. Figure 1 depicts mean vehicle crimes by year. 82 % of households suffered no vehicle crime so the abscissa starts at the 81st per-centile, It will be seen that the mean number of vehicle crime victimisations peaks then falls. This pattern is most marked for the most victimised 1 % of households sam-pled where a drop of 16 % is noted between the years of 1992 and 2000.
Figure 2 depicts the proportion of all vehicle crimes
by percentile and ICVS sweep. A greater proportion of vehicle crime is suffered by the most victimised 1–2 % of households in 2000 than had been the case in the two preceding sweeps, and marginally more than in 1989. After an initial decline, the proportion of crimes in the tenth decile and especially top percentiles increased. 0
10 20 30 40 50 60
91 92 93 94 95 96 97 98 99 100
Proportion
Population Percentiles
1989
1992
1996
2000
Year 1989 1992 1996 2000
Total Sample 31017 20217 19892 33072
Victimised Sample
(Property) 806 1822 925 1641
Total Crimes (Property) 640 1298 676 1235
Fig. 4 Proportion of property victimisations by year and percentile, ICVS Sweeps 1989–2000
0 1 2 3 4 5 6
91 92 93 94 95 96 97 98 99 100
Mean
Population Percentiles
1989
1992
1996
2000
Year 1989 1992 1996 2000
Total Sample 31017 20217 19892 33072
Victimised Sample
(Personal) 4249 2983 3132 4917
Total Crimes (Personal) 2364 1768 1850 2944
Fig. 5 Mean personal victimisations per household by year and percentile, ICVS Sweeps 1989–2000
0 5 10 15 20 25 30 35 40
91 92 93 94 95 96 97 98 99 100
Proportion
Population Percentiles
1989
1992
1996
2000
Year 1989 1992 1996 2000
Total Sample 31017 20217 19892 33072
Victimised Sample
(Personal) 4249 2983 3132 4917
Total Crimes (Personal) 2364 1768 1850 2944
An increase of 19 percent is seen in the last percentile between the years 1992 and 2000.
Parallel analyses for property crime are depicted as Figs. 3 and 4 and personal crimes as Figs. 5 and 6.
Property victimisations show the by now familiar decline in crime count and increase in proportion suf-fered by those most victimised. Property crime count fell by 30 % in the last percentile while the proportion of vic-timisations attributed to the same households increased by 43 per cent between the years 1992 and 2000. The 1989 sample backs the trend both here and in the depic-tion of crimes against the person shown in Figs. 5 and 6.
The decline in crime counts and changes in proportion suffered by the most victimised is much less marked for crimes against the person than for other crime types. As
evidenced by previous work (Tseloni et al. 2010, p 383)
the drop in violent crime lagged behind the drop in other crime types and the last ICVS sweep came too early to capture the drop fully. Crime count experienced by the top percentile dropped by 5 per cent between the years 1996 and 2000 while the proportion of victimisations increased by 13 percent in the same time period.
The alert reader will note that the data could be skewed by countries with different characteristics participating in earlier relative to later sweeps. This was checked by looking at pairwise within country comparisons across sweeps. For example, comparing the first and fourth sweeps in respect of vehicle crime, how many countries exhibited a decrease in mean crime for the top percentile, and how many an increase? Likewise, how many coun-tries exhibited an increase in proportion of crime for the top percentile and how many a decrease? Details of these analyses are available from the first author on request. Suffice it here to say that the decreased count slightly increased concentration pattern is common across coun-tries and is not an artefact of which councoun-tries partici-pated in which sweeps.
To recapitulate, the absolute victimisation of the most victimised has decreased internationally, as the propor-tion of victimisapropor-tion suffered by the most victimised 1 % of households has increased. After an initial decline in the early 1990s, the proportion of crimes attributed to the most victimised increased to just below a quarter for vehicle crimes, nearly a half for property crimes and over a third for personal offences.
The next step in the present paper addresses the ques-tion of whether the attributes of the heavily victimised households remain similar across time. There is already a substantial literature on attributes associated with crime
victimisation (Tseloni et al. 2010; Kershaw and Tseloni
2005; Osborn and Tseloni 1998; Tseloni 2006), but these tend to be analyses at single points in time. Our previous papers examined a number of characteristics available in
British data. The only other empirical study of which we are aware which concerns equity if distribution of crime events during the crime drop was the study of domestic
burglary of James Hunter and Andromachi Tseloni (2016).
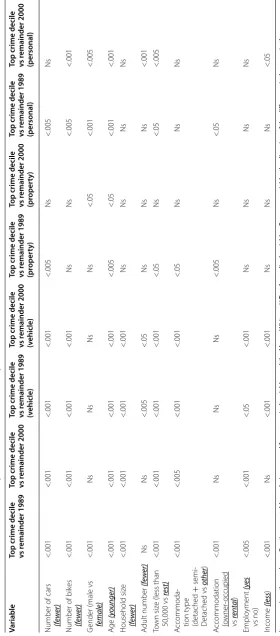
Here the question is whether the variables which distin-guish the most victimised households and individuals in 1989 are the same as those which distinguish the most victimised in 2000. The conclusion reached is that the risk factors of 2000 are similar to the risk factors of 1989. Bear in mind that the present analysis says nothing directly about area effects, which will also inform prioritisation
of crime prevention effort (Tseloni 2006; Kershaw and
Tseloni 2005; Osborn and Tseloni 1998) (Table 1).
Probabilities matter little with the sample sizes avail-able. The important point is the consistency of the findings, as the characteristics associated with highly vic-timised are consistent across the 12 years of data avail-able from the ICVS. Households with less favouravail-able economic, geographic and demographic characteristics are consistently experiencing an overwhelmingly greater proportion of victimisation.
Conclusions
Considering the convergence of patterns found in previ-ous analyses limited to England and Wales and the cur-rent international investigation, it appears that with little doubt the cross-national crime drop can be seen as the product of a drop in the count alongside a change in the distribution of crime across households. Around half of all property victimisation is suffered by the 1 % of house-holds which are most victimised, as is about one third of personal victimisation. The greater proportion of prop-erty relative to personal victimisation differs from the British picture, and is suspected to be an artefact intro-duced by the capping of crime events. If there are many victims of multiple personal crimes, this reversal of effect would be the result. Research which is urgently neces-sary and has been absent from the victimisation survey literature to date has been follow-up interviews with those multiply victimised to confirm the veracity of their accounts. For those accusing multiple victims of confabu-lation, the question why this confabulation should have declined over time in line with decreased crime counts.
Table
1
C
har
ac
teristics of those hea
vily vic timised o ver IC V S sw eeps It summar
ises the analy
ses
. C
on
tingenc
y table analy
sis w
as used f
or ca
tegor
ical v
ar
iables and the M
ann– W hitney U Test f or or dinal v ar iables . F or ev er y v ar iable
, the dir
ec
tion of the diff
er
enc
e is the same in the y
ears
compar
ed
. T
he italicised and under
lined w
or
d or phr
ase in the lef
t c
olumn of the table is the o
ver -r epr esen ted alt er na tiv e. F or e xample
, households in
rental ac commoda tion w er e mor e vic
timised than o
wner -oc cupied homes . C ell en tr ies ar e pr
obabilities of the r
ela tionship Ca tegor ical v ar iable sta tistics ar
e Chi squar
e with 1° of fr
eedom.
The or
dinal v
ar
iable sta
tistic is z
Variable
Top crime decile vs r
emainder 1989
Top crime decile vs r
emainder 2000
Top crime decile vs r
emainder 1989
(v
ehicle)
Top crime decile vs r
emainder 2000
(v
ehicle)
Top crime decile vs r
emainder 1989
(pr
oper
ty)
Top crime decile vs r
emainder 2000
(pr
oper
ty)
Top crime decile vs r
emainder 1989
(personal)
Top crime decile vs r
emainder 2000
(personal)
Number of cars (few
er) <.001 <.001 <.001 <.001 <.005 Ns <.005 Ns
Number of bik
es (few er) <.001 <.001 <.001 <.001 Ns Ns <.005 <.001 G
ender (male vs female)
<.001 Ns Ns Ns Ns <.05 <.001 <.005 A ge (y ounger) <.001 <.001 <.001 <.001 <.005 <.05 <.001 <.001 Household siz e (few er) <.001 <.001 <.001 <.001 Ns Ns Ns Ns A dult number (few er) Ns Ns <.005 <.05 Ns Ns Ns <.001 To wn siz
e (less than
50,000 vs rest) <.001 <.001 <.001 <.001 <.05 Ns <.05 <.005 A ccommoda -tion t ype (detached + semi-D etached vs other ) <.001 <.005 <.001 <.001 <.05 Ns Ns Ns A
ccommodation (owner
Authors’ contributions
KP has conceived of the study, participated in the design of the paper and drafted the manuscript. DI carried out the necessary statistical analyses and helped to draft the manuscript. Both authors read and approved the final manuscript.
Author details
1 Jill Dando Institute, University College London, 35 Tavistock Square, Lon-don WC1H 9EZ, UK. 2 University of Huddersfield, London, UK.
Competing interests
The authors declare that they have no competing interests.
Received: 17 December 2015 Accepted: 22 September 2016
References
Farrell, G., & Pease, K. (2007). The sting in the tail of the British crime survey: multiple victimisations. In M. Hough & M. Maxfield (Eds.), Surveying crime in the 21st century. Cullompton: Willan.
Hunter, J., & Tseloni, A. (2016). Equity, justice and the crime drop: the case of Burglary in England and Wales. Crime Sci, 5(1), 1.
Ignatans, D., & Pease, K. (2015a). Distributive justice and the crime drop. In M. Andresen & G. Farrell (Eds.), The criminal act: festschrift for Marcus Felson. London: Palgrave Macmillan.
Ignatans, D., & Pease, K. (2015b, in press). On whom does the burden of crime fall now? Changes over time in counts and concentration. Int Rev of Victimol.
Kershaw, C., & Tseloni, A. (2005). Predicting crime rates, fear and disorder based on area information: evidence from the 2000 British crime survey. Int Rev Victimol, 12, 295–313.
Lauritsen, J., Gatewood Owens, J., Planty, M., Rand, M. R., & Truman, J. L. (2012). Methods for counting high-frequency repeat victimizations in the national crime victimization survey. Washington DC: Bureau of Justice Statistics. Lorenz, M. O. (1905). “Methods of measuring the concentration of wealth”. Publications of the American Statistical Association (Publications of the American Statistical Association, Vol. 9, No. 70) 9(70): 209–219. Netherlands Institute for Scientific Information Services (1999). Steinmetz
Archive documentation set version 1.0, Den Haag
Osborn, D., & Tseloni, A. (1998). The distribution of household property crimes. Journal of Quantitative Criminology, 14, 307–330.
Tonry, M. (2014). Why crime rates are falling throughout the Western World. Crime Justice, 43, 1–63.
Tseloni, A. (2006). Multilevel modelling of the number of property crimes: household and area effects. J Royal Stat Soc Ser A Stat Soc, 169, 205–233. Tseloni, A., & Pease, K. (2014). Using modelling to predict and prevent
victimisa-tion. New York: Springer.
Tseloni, A., & Pease, K. (2015). Area and individual differences in personal crime victimisation incidence: the role of individual, lifestyle/routine activities and contextual predictors. Int Rev Victimol, 21(1), 3–29.
Tseloni, A., Mailley, J., Farrell, G., & Tilley, N. (2010a). Exploring the international decline in crime rates. Eur J Criminol, 7(5), 375–394.