R E S E A R C H
Open Access
Input-dependent subcellular localization of spike
initiation between soma and axon at cortical
pyramidal neurons
Rongjing Ge
1,2, Hao Qian
1, Na Chen
1and Jin-Hui Wang
1,2,3*Abstract
Background:Action potentials can be initiated at various subcellular compartments, such as axonal hillock, soma and dendrite. Mechanisms and physiological impacts for this relocation remain elusive, which may rely on input signal patterns and intrinsic properties in these subcellular compartments. We examined this hypothesis at the soma and axon of cortical pyramidal neurons by analyzing their spike capability and voltage-gated sodium channel dynamics in response to different input signals.
Results:Electrophysiological recordings were simultaneously conducted at the somata and axons of identical pyramidal neurons in the cortical slices. The somata dominantly produced sequential spikes in response to long-time steady depolarization pulse, and the axons produced more spikes in response to fluctuated pulse. Compared with the axons, the somata possessed lower spike threshold and shorter refractory periods in response to long-time steady depolarization, and somatic voltage-gated sodium channels demonstrated less inactivation and easier reactivation in response to steady depolarization. Based on local VGSC dynamics, computational simulated spike initiation locations were consistent with those from the experiments. In terms of physiological impact, this input-dependent plasticity of spike initiation location made neuronal encoding to be efficient.
Conclusions:Long-time steady depolarization primarily induces somatic spikes and short-time pulses induce axonal spikes. The input signal patterns influence spike initiations at the axon or soma of cortical pyramidal neurons through modulating local voltage-gated sodium channel dynamics.
Keywords:Action potential, Soma, Axon, Neuron and sodium channel
Introduction
Neurons integrate synaptic inputs and produce sequen-tial spikes as digital codes in the brain. In terms of the sources of producing spikes, previous studies indicated that a single spike was initiated at axonal hillock [1-10], as well as somata and dendrites [11-21]. These data raise the question whether the location of spike initiation undergoes plasticity, in which input signals and local in-trinsic properties may be involved. The elucidation to the dynamical alternation of spike initiation locations is critically important to understand how the neurons
integrate synaptic signals and produce their digital codes in the brain efficiently.
Synaptic input signals that evoked neuronal spikes
in vivo appeared long duration [15,22-25]. This long-time physiological depolarization induced sequential spikes dominantly at the somata [15], whereas short pulses initiated individual spikes at the axonal hillock [2,3,7,9]. Why the long-time versus short-time input sig-nals influence the locations of spike initiation remains elusive. In addition, long-time signals integrated from
synaptic inputs in vivo are classified into steady
depolarization and fluctuated pulses [15]. It needs to be addressed whether these two patterns of input signals evoke sequential spikes at different subcellular compart-ments, an input-dependent plasticity of spike initiation location.
* Correspondence:[email protected] 1
State Key Lab for Brain and Cognitive Sciences, Institute of Biophysics, Chinese Academy of Sciences, 15 Datun Road, Chaoyang District, 100101 Beijing, China
2University of Chinese Academy of Sciences, 100049 Beijing, China
Full list of author information is available at the end of the article
© 2014 Ge et al.; licensee BioMed Central Ltd. This is an Open Access article distributed under the terms of the Creative Commons Attribution License (http://creativecommons.org/licenses/by/2.0), which permits unrestricted use, distribution, and reproduction in any medium, provided the original work is properly credited. The Creative Commons Public Domain Dedication waiver (http://creativecommons.org/publicdomain/zero/1.0/) applies to the data made available in this article, unless otherwise stated.
Geet al. Molecular Brain2014,7:26
In terms of mechanisms underlying the subcellular localization of spike initiation, the dynamics and density of local voltage-gated sodium channel (VGSC) are pre-sumably involved. It was suggested that a high density of VGSCs is critical for spike initiation at the axonal hillock [2,7,9]. However, the depolarization did not increase the number of functional VGSCs at axonal initial segment [26]. The intact initial segment with dense VGSC clus-ters was unnecessary for inducing spikes in the neurons [27]. VGSC’s dynamics also played an important role in spike initiation location [3,28]. Therefore, the changes in local VGSC dynamics and/or density are likely involved in the plasticity of spike initiation location. As the activity-dependent redistribution of high dense VGSCs occurred within axonal hillock and took a long time [29,30], the plasticity of spike initiation location may be based on local VGSC dynamics. In order to address the roles of input sig-nal patterns and local VGSC dynamics in spike initiation relocation, we analyzed the sequential spikes and VGSC’s dynamics at the axonal bleb and soma of identical pyram-idal neurons simultaneously in sensory cortical slices.
Results
Membrane depolarization signals in vivoare long time,
whose patterns are generally classified into steady and fluctuated pulses [15]. The action potentials can be evoked at various subcellular compartments, such as axonal hillock, soma and/or dendrite [2,3,11-13,15]. We have proposed to examine whether input signal patterns influenced spike-initiation location as well as how local VGSC dynamics regulated this input-dependent reloca-tion of spike-initiareloca-tion sites. In terms of the strategies to address these issues, we mainly analyzed correlations between input-signal patterns and spike-initiation loca-tions by changing input signal patterns and subcellular compartment functions. This analysis would indicate whether the dynamic relocation of the spike-initiation sites was naturally present. To its underlying mecha-nisms, we focused on analyzing VGSC dynamics at these subcellular compartments in response to different input signals. Based on the dynamics of local VGSCs, we conducted computation simulation to test whether their dynamics characteristics were responsible for spike-initiation relocation. Furthermore, we examined whether the changes of local VGSC’s dynamics would shift spike-initiation location. Finally, we studied physiological impacts for the spike-initiation relocation, such as the efficacy of neuronal encoding.
Input signal patterns influence spike-initiation at the somata and axons
If steady depolarization versus fluctuated one initiate sequential spikes at the different locations of given neurons, altering input signal patterns should drive spike-initiation
relocation. In other words, if one of the subcellular com-partments is preferentially sensitive to an input pattern for firing spikes, the spike capability in response to this input signal should be higher in this compartment than others. While changing input signal patterns, we analyzed the
input–output curves of these compartments to assess
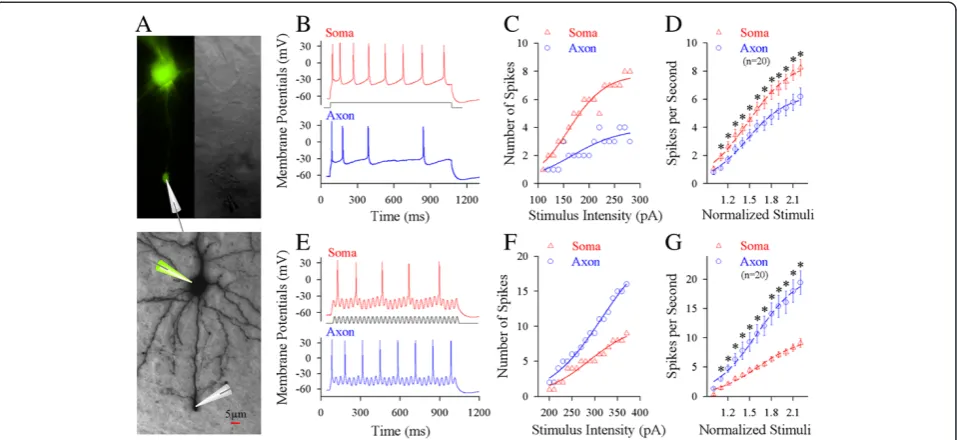
their sensitivity to input signals and their spike capability. Whole-cell recording was simultaneously conducted on the soma and axonal bleb of the same cortical pyr-amidal neurons to apply different input signals locally and to acquire sequential spikes (Figure 1A). Long-time (1 second) steady depolarization pulses or fluctuated pulses (cosine-wave, [31]) were injected into these two compartments to induce spikes, respectively (Additional file 1: Figure S1). While these depolarization pulses were injected into either of two compartments, the same amount of spikes was recorded at these two compart-ments. This spiking fidelity was due to the secure spike propagation on cell membrane between the axonal blebs and somata [13]. On the other hand, the subthreshold potential was electrotonically propagated and shunted by potassium channels, such that they would be decayed. We evaluated the capability of firing spikes (input–output and spike threshold) in these two compartments by injecting pulses and evoking spikes locally.
No matter what the axon or soma is a location to initiate spikes, this compartment should have higher capability to convert input signals into spikes, i.e., more efficient input-outputs transformation. Steady pulses in various intensities were injected into the soma and axonal bleb (20 ~ 50μm away from the soma), respectively, to induce spikes (red trace in Figure 1B for the soma and blue for the axon). Figure 1C shows spikes per second versus stimulus intensities at the soma (red symbols) and axon (blue) in this example. Somatic input–output curve (red triangles in Figure 1D, n = 20) appears on the left-top side of axonal one (blue circles, n = 20; asterisks, p < 0.05, paired-t test), indicating that somatic spike threshold is lower and identical stimuli induce more somatic spikes. The somata are sensitive to long-time steady input signals. On the other hand, the fluctuated pulses (black trace in Figure 1E) in various intensities were injected into the soma and axon of these pyramidal neurons, respect-ively, to induce spikes (red trace for the soma and blue
for the axon). Axonal input–output curve (blue
sym-bols in Figure 1F ~ G) is on left-top side of somatic one (red, n = 20; asterisks, p < 0.05, paired-t test), indicating that the axons are more sensitive to the fluctuated in-put signals than the somata.
We examined these indications under a voltage-clamp to reduce the effect of passive membrane property on the recording. Steady depolarization induced more spikes at the soma (red trace in Figure 2A) than at the axon (blue). Somatic input–output curve (red triangles in Figure 2B) is
Geet al. Molecular Brain2014,7:26 Page 2 of 16
on the left-top side of axonal one (blue circles, n = 9; asterisk, p < 0.05, paired-t test). On the other hand, the fluctuated signals induced more axonal spikes (blue trace in Figure 2C) than somatic spikes (red). Axonal input–output curve (blue circles in 2D) appears on left-top side of somatic one (red triangles, n = 9; asterisks, p < 0.05, paired-t test). The data are consistent with those under current-clamp (Figure 1).
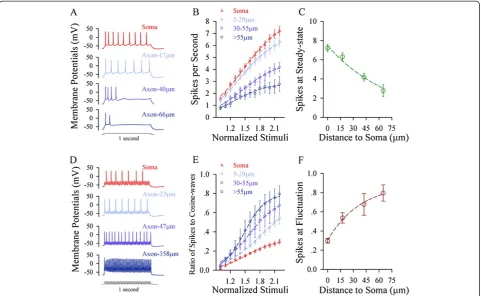
If the soma is sensitive to steady pulse and the axonal segments are sensitive to fluctuated pulse, each of these compartments would fire the spikes in the highest fre-quency when receiving its sensitive signal. This assump-tion is based on a principle that sinoatrial node with the highest pacemaker spikes controls the heart rate. Steady depolarization pulses in various intensities were injected into the soma and different axonal segments, respect-ively, to induce spikes (Figure 3A). Figure 3B illustrates input–output curves for the somata (red symbols, n = 49)
and axonal segments away from the soma in 5 ~ 29 μm
(light-blue, n = 36), 30 ~ 55μm (purple, n = 26) and >55μm (dark-blue, n = 7). The maximal number of spikes from 3B versus the distances between axonal segments to soma were plotted in Figure 3C. The sensitivity to steady depolarization and the capability to produce its induced spikes are decreasing from the soma toward distal axons.
Moreover, the fluctuated pulses at various intensities were injected into the soma and different axonal segments,
respectively, to induce spikes (Figure 3D). Figure 3E illustrates input–output curves at the soma (red symbols, n = 19) and the axonal segments away from the soma in 5 ~ 29μm (light-blue, n = 13), 30 ~ 55μm (purple, n = 10) and >55μm (dark-blue, n = 10). The efficiency of convert-ing the fluctuated signals into the spikes (the ratio of spikes to cosine-waves; dark-red) versus the distances of axonal segments to the soma were plotted in Figure 3F. The sensitivity to fluctuated signals and the capability to fire its induced spikes are increasing from the soma toward distal axons.
We analyzed input–output curve between the soma
and axon segments of identical pyramidal neurons by alter-ing input signal patterns. Long-time steady depolarization preferentially induces sequential spikes at the soma, but fluctuated one (sequential short-time pulses) initiates spikes at the axons. Moreover, we confirm this input-dependent plasticity of spike initiation location by changing com-partment functions to shift spike initiation locations. It is noteworthy that spike initiation relocation is not caused by passive membrane property since there is no difference in the input resistance between the soma and axon (Additional file 2: Figure S2). As spike initiation is presumably controlled by VGSCs, we propose that the sensitivities of the somata and axons to the different input signals are due to the difference of their local
VGSC’s dynamics, which we examined below.
Figure 1Long-time step pulses initiate sequential spikes at the soma of cortical pyramidal neurons, but the fluctuated signals induce spikes at the axon. A)Top panel shows the images of dual recording on the soma and axonal bleb under fluorescent (left)/DIC (right) microscope. Bottom panel shows an image of neurobiotin-labeled pyramidal neuron.B)Long-time step depolarization (middle black trace) induces more spikes at the soma (red trace) than at the axon (blue).C)shows the number of spikes vs. stimulus intensities at the soma (red symbols) and axon (blues) of this pyramidal neuron.D)illustrates input–output curves at the soma (red symbols) and axon (blues; n = 20, p < 0.05).E)The fluctuated signal (a cosine wave, middle black trace) induces more spikes at the axon (blue trace) than at soma (red).F)shows the ratio of spikes to cosine-waves vs. stimulus intensities at the axon (blue symbols) and the soma (reds) of this pyramidal cell.G)shows input–output curves for the axon (blue symbols) and the soma (reds; n = 20, p < 0.05).
Geet al. Molecular Brain2014,7:26 Page 3 of 16
Somatic and axonal VGSCs are different in response to long-time and short-time signals
The VGSC dynamics sets spike capability as well as thresh-old potentials and refractory periods [32,33]. In examining the role of somatic and axonal VGSCs in this input-dependent plasticity of spike initiation location, we ana-lyzed the influences of input signal patterns on spike thresholds and refractory periods at the soma versus the axon of pyramidal neurons. We also examined the
influ-ences of changing VGSC’s dynamics on spike thresholds
and refractory periods at the soma and axon.
Somatic and axonal spike thresholds and refractory periods change in response to different signals
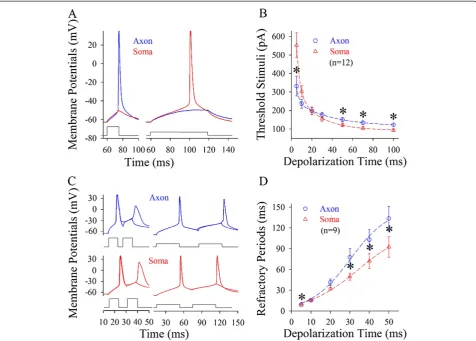
Spike thresholds and refractory periods were measured at the soma and axonal bleb of identical cells [13]. In the measurements of somatic and axonal thresholds, pulse durations and intensities were inversely adjusted to
induce the spikes at threshold level. Axonal spike thresholds appear low in response to short-time pulses (blue trace in Figure 4A), but somatic thresholds are low to long-time pulses (red). Threshold stimuli versus depolarization time at the soma (triangles) and the axon (circles) are plotted in Figure 4B, in which their fitting curves cross at 20 ms (asterisks, p < 0.05, n = 12). In addition, the refractory periods of axonal spikes induced by short-time pulses appear short (blue traces in Figure 4C), while those of somatic spikes by long-time pulses are short (reds). Figure 4D shows spike refractory periods versus depolarization time at the axon (circles) and soma (triangles, n = 9; p < 0.05). When long-time depolarization signals are inputted to pyramidal neu-rons, somatic spike thresholds and refractory periods are converted to be lower than axonal ones, so that sequential spikes are initiated primarily at cell body, or vice versa.
Figure 2Long-time step pulses preferentially initiate spikes at the soma of cortical pyramidal neurons under the condition of voltage-clamp recording, but the fluctuated signals induce spikes at the axon. A)A long-time depolarization voltage (50 mV, middle black trace) induces more spikes at the soma (red trace) than at the axon (blue).B)illustrates input–output curves at the soma (red symbols) and the axon (blues; n = 9, p < 0.01).C)A fluctuated voltage signal (cosine-wave, 50 mV; middle black trace) induces more spikes at the axon (blue trace) than at the soma (red).D)shows input–output curves for the axon (blue symbols) and the soma (reds; n = 9, p < 0.01).
Geet al. Molecular Brain2014,7:26 Page 4 of 16
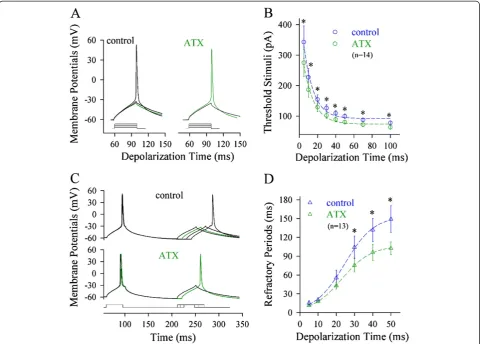
We also examined the effects of reducing VGSC in-activation on spike threshold and refractory period. The reduction of VGSC inactivation was fulfilled by using anemone toxin (ATX), a blocker of VGSC inactivation [34,35]. ATX appears to reduce axonal spike threshold (green traces in Figure 5A). Figure 5B illustrates thresh-old stimulations versus depolarization time at the axon, in which the spike thresholds are attenuated by ATX (green symbols; p < 0.05, n = 14). Furthermore, ATX appears to shorten axonal refractory periods (green trace in Figure 5C). Figure 5D shows spike refractory periods versus depolarization time at the axon, in which ATX shortens spike refractory periods mainly induced by long-time pulses (green symbols; p < 0.05; n = 13). It is noteworthy that ATX does not influence somatic spike threshold and refractory period (Additional file 3: Figure S3). These data indicate that long-time depolarization signals mainly inactivate axonal VGSCs and lower its spike capability.
In terms of the influence of input signals on VGSC’s dynamics, long-time steady depolarization mainly inacti-vates axonal VGSCs, such that the steady signals initiate
sequential spikes at the somata and the fluctuated signals to initiate spikes at the axons. We further investigated how long-time steady depolarization pulses influence the inacti-vation and reactiinacti-vation of axonal VGSCs vs. somatic ones.
Axonal VGSCs are easily inactivated and less reactivated by long-time steady depolarization
VGSCs were inactivated in voltage-/state-dependent
manners [36,37]. In vivo signals induced sequential
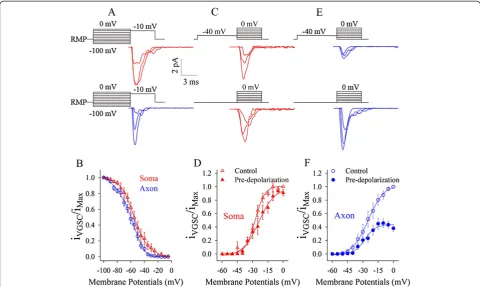
spikes on the long-time depolarization [13,22-25]. This pre-depolarization may inactivate axonal VGSCs [38] to elevate spike threshold and refractory period (Figure 4), such that spike initiation shifts to the soma [15,39]. To examine this implication, we compared VGSC inactivation and reactivation at the soma versus axon by cell-attached recording simultaneously at the two subcellular compart-ments of identical pyramidal neurons (Figure 6).
VGSCs’inactivation curves were measured by giving pre-depolarization pulses ahead of a fixed pre-depolarization pulse. Compared to somatic VGSCs (red traces in Figure 6A), axonal ones (blue trace) appear obvious inactivation in
Figure 3The axon possesses the maximal ability of firing spikes in response to fluctuated signals, and the soma has the maximal ability of firing spikes in response to long-time steady depolarization. A)An example shows spike waveforms from the soma to different axonal segments.B)shows the input–output curves for the soma (red symbols) and different axonal fragments in 5 ~ 29μm (light-reds), 30 ~ 55μm (pinks) and >55μm (blues) away from the soma, in which sequential spikes are induced by long-time steady depolarization.C)illustrates the maximal values of input–output curves (normalized stimuli at 10) for steady-state pulses versus distances of axonal bleb to the soma.D)A sample shows spike waveforms from the soma to different axonal segments.E)shows input–output curves for the soma (red symbols) and distinct axonal fragments in 5 ~ 29μm (light-reds), 30 ~ 55μm (pinks) and >55μm (blues) away from the soma, in which the spikes are induced by the fluctuated depolarization (cosine wave at 50 Hz).F)shows the maximal values of input–output curves for the fluctuated pulses vs. distances of axonal bleb to the soma.
Geet al. Molecular Brain2014,7:26 Page 5 of 16
response to these pre-depolarization pulses. Axonal VGSC inactivation curve (blue line/circles in Figure 6B) is on the left side of somatic one (red triangles), that is, the pre-depolarization pulses make axonal VGSCs to be easily inactivated. This result is consistent to a report that axonal Nav1.6 inactivation is more than somatic Nav1.2 inactivation during pre-depolarization [40].
To test whether the inactivation of axonal or somatic VGSCs affects their subsequent activation, we measured their activation curves under a pre-depolarization.
Figure 6C ~ D shows somatic VGSC’s activation with
(top panel in 6C and filled triangles in 6D) and without a pre-depolarization (control; bottom in 6C and open trian-gles in 6D). Figure 6E ~ F shows axonal VGSC’s activation under partial inactivation (top panel in 6E and filled circles in 6F) and control (bottom in 6E and open circles in 6F). Axonal VGSCs become difficultly reactivated if a pre-depolarization induces their partial inactivation.
In summary, long-time signals dominantly suppress the reactivation of axonal VGSCs and lead to the high values of axonal spike thresholds and refractory periods (Figures 4, 5 and 6). So, long-time steady signals mainly initiate sequential spikes at the soma, and the fluctuated ones induce spikes at the axon (Figures 1, 2 and 3). We examined this indication by changing axonal VGSC dy-namics and computational simulation.
The role of local VGSCs in input-dependent relocation of spike initiation
The data above indicate that spike onset at the axon or the soma is related to their local VGSC dynamics. To examine the role of local VGSCs in the input-dependent plasticity of spike initiation location, we conducted computational simulation as well as changed local VGSC dynamics to see spike initiation relocation. Introducing VGSCs, which possess somatic featured
Figure 4Spike thresholds and refractory periods are changed dynamically by the patterns of input signals at the soma vs. axon. A)
Axonal spike thresholds appear low by short-time pulses (blue trace) and somatic ones are lower by long-time pulses (red).B)shows threshold stimuli vs. depolarization time at the soma (triangle symbols) and the axon (circles, n = 12).C)Left panels show that spike refractory periods ap-pear short at the axon (blue traces at top panels) by short-time pulses. Right panels show that refractory periods are short at the soma (red lines at bottom panels) by long pulses.D)shows refractory periods vs. depolarization time at the soma (triangle symbols) and axon (circles, n = 9). Asterisks present p < 0.05.
Geet al. Molecular Brain2014,7:26 Page 6 of 16
VGSC dynamics, into computational modeling is ex-pected to simulate sequential spikes similar to somatic spikes, or vice versa. The experimental upregulation and downregulation of local VGSC dynamics are ex-pected to cause the relocation of spike initiation.
Easier inactivation and less reactivation of axonal VGSCs simulate spikes being somatic origin
In computational simulation, we introduced the curves of axonal VGSC reactivation (blue trace in Figure 7A) and somatic one (red) under pre-depolarization (from
Figure 6D and 6F) into NEURON model [41,42]. In the
modeling, threshold potentials (ΔV) for axonal VGSCs
were more positive than somatic VGSCs, and axonal VGSC reactivation (Δi) was 50% lower than somatic one. By introducing these factors, long-time steady signal induced more simulated spikes at the soma (red trace in Figure 7B) than the axon (blue). The threshold of
sequential spikes is lower, and the number of spikes by identical stimuli is higher at the soma (red symbols in Figure 7C) than the axon (blue).
On the other hand, we inputted the curves of axonal VGSC activation (blue curve in Figure 7D) and somatic one (red) under no pre-depolarization (control in Figure 6D
and F) into NEURON model. In the modeling, threshold
potential (ΔV) and VGSC activation (Δi) for the axon were similar to those for the soma. The fluctuated signals under this condition induced more simulated spikes at the axon (blue trace in Figure 7E) than the soma (red trace). The thresholds of sequential spikes are lower, and the number of spikes by identical stimulus is higher at the axon (blue symbols in Figure 7F) than the soma (red).
The data from computational simulation supports the experimental data that long-time steady depolarization mainly inactivates axonal VGSCs and initiates sequential spikes at the soma, whereas fluctuated signals initiate
Figure 5ATX, a reagent of preventing VGSC inactivation, reduces spike thresholds and shortens refractory periods at the axon.Spike thresholds and refractory periods are measured dynamically by changing the patterns of input signals at the axon.A)shows the effect of ATX on axonal spike thresholds (green traces).B)shows threshold stimuli vs. depolarization time at the axon. ATX reduces axonal spike thresholds significantly (green symbols; asterisks, p < 0.05, n = 14; paired t-test).C)shows the effects of ATX on the refractory periods of axonal spikes (green trace).D)illustrates spike refractory periods vs. depolarization time at the axon. ATX shortens the refractory periods of axonal spikes induced mainly by long-time pulses (green symbols, n = 13; asterisks, p < 0.05).
Geet al. Molecular Brain2014,7:26 Page 7 of 16
the spikes at the axon, i.e., input-dependent plasticity of spike initiation location.
The manipulation of axonal VGSC’s function changes the location of spike initiation
Long-time steady depolarization initiates more somatic spikes than axonal spikes (Figures 1, 2 and 3) by inactivat-ing axonal VGSCs (Figures 4, 5, 6). If it is right, axonal spike capability in response to steady depolarization should be enhanced by upregulating axonal VGSC dy-namics. While puffed ATX to the axonal blebs of pyr-amidal neurons (a green electrode in Figure 8A), we observed that ATX increased the number of spikes in-duced by steady pulses at the axon (Figure 8B). Figure 8C
shows input–output curves for the soma (red symbols)
as well as axon before (blues) and after using ATX (greens; p < 0.01, n = 10). The prevention of axonal VGSC inactiva-tion strengthens axonal spike capability.
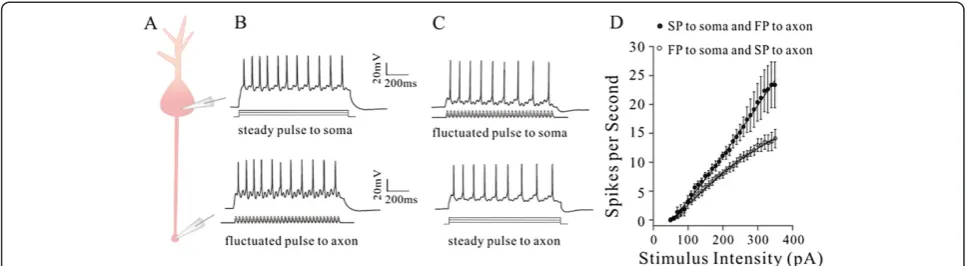
On the other hand, we inactivated axonal VGSCs by long-time depolarization pulse to examine whether axonal spike capability in response to fluctuated signal would be weakened. In dual recording on the soma and axonal bleb of identical pyramidal cells (Figure 9A), we inactivated
axonal VGSCs by using long-time steady depolarization pulses in two methods. The fluctuated signals were injected into the axons to evoke the spikes, while the steady signals were injected into the somata to indir-ectly inactivate axonal VGSCs (Figure 9B). The fluctu-ated signals were injected into the somata to evoke the spikes, while the steady signals were injected into the axons to directly inactivate axonal VGSCs (Figure 9C). Both approaches reduce spike capability induced by the fluctuated signal, but the direct inactivation of axonal VGSCs more dominantly reduces spike capability (gray symbols in Figure 9D) than the indirect inactivation of axonal VGSCs does (orange symbols, n = 7). Neuronal spike capability and patterns by inactivating axonal VGSCs are similar to somatic spikes (please compare to Figure 3). Thus, an inactivation of axonal VGSCs weakens axonal spike capability in response to the fluctuated signals, or shifts spike initiation location toward the soma.
The input-dependent plasticity of spike initiation location increases neuronal encoding efficiency
In terms of physiological significances for the plasticity of spike initiation location, we assume that this relocation of
Figure 6Pre-depolarization inactivates voltage-gated sodium channels (VGSC) partially and weakens their subsequent activation at the axon. A-B)Pre-depolarization pulses inactivate VGSCs mainly at the axons (A). The inactivation curve of axonal VGSCs (blue symbols in B) is on the left side of that of somatic ones (red triangles). Axonal VGSCs are more easily inactivated.C-D)A pre-depolarization pulse weakens somatic VGSCs activation slightly (top panel in C for waveform and red-filled symbols in D) compared with control (bottom panel in C and opens in D).
E-F)A pre-depolarization pulse significantly weakens axonal VGSCs activation (top panel in E for waveform and blue-filled symbols in F) compared with control (bottom in E and opens in F).
Geet al. Molecular Brain2014,7:26 Page 8 of 16
Figure 7Computational simulation favors a somatic origin of sequential spikes under the condition of pre-depolarization, and axonal origin for spikes without pre-depolarization. A)A pre-depolarization pulse significantly inactivates axonal VGSCs, including an increase of their threshold byΔV and a decrease of activation byΔi.B)The number of simulated spikes appears higher at the soma (red trace) than the axon (blue) induced by a long-time step depolarization (black).C)illustrates spike number vs. normalized stimuli at the soma (red triangles) and the axon (blue circles; n = 20, p < 0.01).D)shows the activation curves of somatic VGSCs (red trace) and of axonal ones (blue) by the pulses without pre- depolarization and hyperpolarization.E)The number of simulated spikes appears higher at the axon (blue trace) than the soma (blue) induced by a cosine-wave depolarization pulse (black).F)illustrates input–output curves at axonal spikes (blue circles) and somatic ones (red triangles; n = 20, p < 0.01).
Figure 8ATX dominantly secures the axonal capability of firing sequential spikes induced by long-time steady depolarization pulses. A)shows a diagram for whole-cell recording at the soma and axon, and puffing 5μM ATX (green pipette) toward axonal bleb.B)Long-time steady pulse initiates sequential spikes at the axon of cortical pyramidal neurons before (blue trace) and after ATX application (green), as well as sequential spikes at the soma of pyramidal neurons (red trace).C)shows spikes per second versus stimulus intensities at the axons of pyramidal neuron before (blue circles) and after ATX applications (greens, n = 10; asterisks, p < 0.05), as well as input–output curves at the somatic recordings (red triangles; n = 10).
Geet al. Molecular Brain2014,7:26 Page 9 of 16
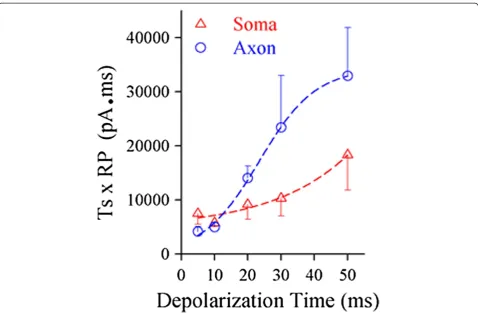
spike initiation may be for the neurons to save the energy during neuronal encoding. The neurons have to step over two barriers [43], spike thresholds and refractory periods [32,44-46], to produce the spikes. If this assumption is right, we should see lower energetic barriers for somatic spikes by long-time steady signal or axonal spikes by fluc-tuated signal. By calculating the energetic barrier, the multiplication of spike threshold and refractory period [43], we found that this value at the soma was low by using long-time pulses (red symbols in Figure 10) and the value at the axon was lower by short-time ones (blues). Thus, spike initiations at the soma by long-time signals and at the axon by short ones make the neurons to utilize the lower levels of energy. In other words, the input-dependent plasticity of spike initiation location is benefi-cial for the neurons to save energy during encoding digital signals.
In addition, the portion of the fluctuated signal was about 40% in the integrated synaptic signals [15]. To convert synaptic inputs into spikes efficiently, the neu-rons should make each of fluctuated signals to induce a spike. Where is this optimal conversion fulfilled? As the axon is more sensitive to the fluctuated signal (Figures 1, 2 and 3), it is likely a subcellular compartment that converts the fluctuated signals into the spikes with an optimal match in their frequencies. We tested this possi-bility by measuring the optimal efficiency of converting cosine waves into spikes at the soma and the axonal segments.
The fluctuated signals (cosine wave) with frequency increments were injected into the soma and different axonal segments, respectively, to induce the spikes. If the soma or axon in response to these signals reached
an optimal level (each of pulses triggered a spike), we named it as optimal response frequency. The optimal frequency of converting fluctuated signals into spikes ap-pears the highest at the distal axon (Figure 11A). Figure 11B shows optimal frequency versus distance of axonal seg-ments to the soma (n = 17 for soma; n = 43 for axon). Figure 11C shows number of spikes versus frequency of depolarization (DP) at the axon (blue symbols) and soma (reds, n = 11). Therefore, the axonal segments
away from the soma above 50 μm are the subcellular
compartment that converts the fluctuated signals into the spikes with optimal match in high frequencies, i.e., the axons confer the neurons to efficiently encode digital spikes in response to the fluctuated input signals.
Discussion
Long-time steady depolarization initiates sequential spikes dominantly at the somata of cortical pyramidal neurons, whereas fluctuated signal instigates the spikes at their axons (Figures 1, 2 and 3), i.e., an input-dependent plasticity of spike initiation locations. In terms of its mechanism, long-time pulses make somatic spike thresholds and refractory periods to be lower and short-time ones make such parameters to be lower at the axon (Figures 4 and 5). Long-time depolarization mainly inactivates axonal VGSCs, or vice versa (Figure 6). Computational simulation based on the kinetics of axonal and somatic VGSCs supports that long-time steady depolarization induces somatic spikes and fluctuated signals do axonal ones (Figure 7). Our studies in the experiments and computational simulation reveal the spike initiation relocation between the somata and
Figure 9The reduction of axonal VGSC function by steady depolarization signal may weaken axonal capability to produce spikes in response to fluctuated signals.Axonal VGSCs are inactivated by long-time steady depolarization pulses in two ways.A)shows dual recording at the soma and axonal bleb.B)The fluctuated pulse (FP) is injected into the axon to induce spikes, while the steady pulse (SP) is injected into the soma to indirectly inactivate axon VGSCs.C)FP is injected into the soma to induce the spikes, while SP is injected into the axon to directly inactivate axonal VGSCs.D)shows input–output curves for directly (open symbols) and indirectly (filled symbols) inactivating axonal VGSCs. Spike capability induced by the fluctuated pulse is more dominantly reduced by the direct inactivation of axonal VGSCs than the indirect inactivation of axonal VGSCs does (n = 7).
Geet al. Molecular Brain2014,7:26 Page 10 of 16
Figure 10The cortical pyramidal neurons encode digital spikes in an economical way.The plot shows the comparison of the energetic barriers for the soma and axon to fire spikes induced by the different durations of synaptic inputs. The values of energetic barriers are calculated by multiplication of threshold and refractory period. These values at the soma are low by giving long-time pulses (red symbols) and the values at the axon are low by short ones (blues).
Figure 11The axons confer the pyramidal neurons to efficiently encode the digital spikes in response to the fluctuated input signals.
The fluctuated signals (cosine waves) at threshold stimuli in different frequencies were injected into the soma and different axonal segments, respectively, to induce spikes.A)shows the optimal frequency of converting the fluctuated signals into spikes at the soma and axons.B)illustrates optimal frequency versus distance of axonal segments to the soma (soma, n = 17; axons, n = 43).C)shows the frequency of depolarization (DP) vs. number of spikes (n = 11). Axonal segments away from the soma larger than 50μm appear a subcellular compartment of converting the fluctuated signals into the spikes with optimal match in their frequencies.
Geet al. Molecular Brain2014,7:26 Page 11 of 16
axons of cortical pyramidal neurons, which is con-trolled by local VGSC kinetics.
In order to make sure the input-dependent plasticity of spike initiation location, we applied multiple strat-egies. For instance, subcellular compartments in terms of their sensitivity to distinct input signals and their ability to produce spikes were analyzed under the con-ditions of current-clamp and voltage-clamp record-ings. These experiments were conducted from the somata to different axonal segments in order to find a dominant location of spike initiation. Moreover, the methods in the functional upregulation and downreg-ulation of subcellular compartments were used to analyze the relocation of spike initiation. The results proved by these strategies make the conclusion, the input-dependent plasticity of spike initiation location, to be convincing.
Current reports indicated that the neuronal activities induced the plasticity in terms of the length and distri-bution of high dense VGSCs at axonal hillock [29,30]. This plasticity of VGSC distribution spends long time for its onset and occurs within axonal hillock. Different from this slow onset plasticity, the input-dependent plasticity of spike initiation location in our study develops quickly, shifts between the soma and axon (Figures 1, 2 and 3) and depends on local VGSC kinet-ics (Figures 4, 5 and 6). This subcellular relocation of spike initiation is a novel type of neuronal plasticity, compared to long-term plasticity in neuronal excitabil-ity [47-54], neuronal homeostasis [55] and VGSC redis-tribution [29,30].
A major finding in our studies is that long-time steady depolarization signals initiate sequential spikes at the somata of cortical pyramidal neurons (Figures 1, 2 and 3) through inactivating axonal VGSCs and conferring somatic VGSCs to be less inactivation and easily reacti-vation (Figures 4, 5 and 6). As long-time steady pulses are a major portion ofin vivosignals [15], a somatic ori-gin to fire sequential spikes is physiologically important. One could argue that the smaller axonal volume than somatic one plus the higher density of axonal VGSCs may enable the depolarization to bring denser positive charges into the axon that facilitates the axons to reach a threshold and produce the first spike ahead of the soma. However, the voltage-/state-dependent VGSC in-activation (Figures 4, 5 and 6; [36,37]) may also make this depolarization inactivating axonal VGSCs, espe-cially axonal Nav1.6 [40], which does not help to fire se-quential spikes at the axon.
On the other hand, the fluctuated depolarization sig-nals, a sequence of short-time pulses, initiate axonal spikes at cortical pyramidal neurons (Figures 1, 2 and 3), due to low threshold and refractory periods (Figure 4) mediated by VGSCs (Figures 5 and 6). Our data grant a
dogma that short-time pulse initiates a single spike at axonal hillock [1,4,6], due to low thresholds and high density of VGSCs at this segment [2,3,7,9,10,56-67]. It is noteworthy that the durations ofin vivo fluctuated sig-nals are over 50 ms [15] and unitary synaptic events last for longer than 20 ms [13,68]. Despite a high density of VGSCs at axonal hillock, depolarization pulses above these durations make the number of functional VGSCs not being high at AIS [26] as well as convert somatic threshold and refractory periods to be lower (Figure 4), such that physiological signals induce sequential spikes being somatic in origin [15].
What are physiological impacts for the input-dependent plasticity of spike initiation location? This plasticity is re-lated to saving the energy during neuronal encoding. The neurons step over two barriers [43], spike threshold and refractory period [32,44-46], to produce the spikes. The energetic barriers to fire the spikes at the soma are lower by giving long-time pulses, and these values at the axon are lower by short-time ones (Figure 10). There-fore, the relocation of spike initiation is used for the neurons to save the energy in spike encoding. Moreover, the propagation of soma-integrated input signals in long-time depolarization toward the axons may inac-tivate their VGSCs and be shunted by GABAergic receptor-channels at axonal hillock. To prevent the decay of these signals in their propagation, the integra-tion of analog synaptic signals and the encoding of digital spikes are better fulfilled in a single subcellular compartment, i.e., neuronal soma. On the other hand, fluctuated pulses allow VGSCs to be recovery (Figure 4) and even facilitate Nav1.6 activation at the axons [69], such that the axons serve to an optimal match for the frequency between input signals and spikes as well as optimal response to high frequent inputs (Figures 1, 2, 3 and 11).
We have studied the regulation of spike initiation relocation between the soma and axon of cortical pyr-amidal neurons, a role of VGSC dynamics in this input-dependent plasticity and its physiological impact for the neurons to save energy. The studies in these three as-pects reveals the natural features of spike initiation and strengthens the local presence in the input-dependent relocation of spike initiation.
Methods and materials Brain slices
The study and all experiments were fully approved by the Institutional Committee of Animal Care Unit in Administration Office of Laboratory Animals Beijing China (ID# B10831). The slices from sensory cortices
(300 μm) were prepared from FVB mice. Mice in
post-natal day 15–20 were anesthetized by injecting chloral hydrate (300 mg/kg) and decapitated with a guillotine.
Geet al. Molecular Brain2014,7:26 Page 12 of 16
The cortical slices were cut with a Vibratome in the modified and oxygenized (95% O2/5% CO2) artificial cerebrospinal fluid (mM: 124 NaCl, 3 KCl, 1.2 NaH2PO4, 26 NaHCO3, 0.5 CaCl2, 5 MgSO4, 10 dextrose and 5 HEPES; pH 7.35) at 4°C, and then were held in the normal oxygenated ACSF (mM: 126 NaCl, 2.5 KCl, 1.25
NaH2PO4, 26 NaHCO3, 2.0 CaCl2, 2.0 MgSO4 and 25
glucose; pH 7.35) 35°C for 1 hour before the experi-ments. A slice was transferred to a submersion cham-ber (Warner RC-26G) that was perfused with normal ACSF for electrophysiological experiments [70].
Dual recording
The soma and axonal bleb [71] of identical pyramidal cells in layers IV-V of cerebral cortex were simultaneously recorded (MultiClapm-700B, Axon Instrument Inc. CA USA) under a fluorescent/DIC microscope (Nikon FN-E600). The identification of axonal blebs rather than dendritical bleb was based on the diameter and branches of processes as well as the polarity of neurons [13,15]. Neuronal processes with less branches and fine diam-eter are axon. The electrical signals were inputted into pClamp-10 (Axon Instrument Inc. USA) with 50 kHz sampling rate.
In whole-cell recording on the soma and axonal bleb, the action potentials were induced at these two compart-ments, respectively, by long-time steady depolarization pulses or cosine waves in various intensities, but the stimulus intensities to the soma and axonal bleb of each neuron were identical. As the excitability varied among the neurons [68], the stimulus intensities for different cells were normalized, in which we set the threshold current as 1, and then increased pulse intensities by 10%
gradually, i.e., 1, 1.1, 1.2……2.2 times of threshold
current. This strategy made the data from different neu-rons to be statistically comparable. A judgment for record-ing two sites from an identical neuron was based on the presence of direct and corresponding electrical signals. Transient capacitance was compensated and output band-width was 3 kHz. Pipette solution contained (mM) 150 K-gluconate, 5 NaCl, 0.4 EGTA, 4 Mg-ATP, 0.5 Tris- GTP, 4 Na-phosphocreatine and 5 HEPES (pH 7.4 adjusted by 2 M KOH). The osmolarity of pipette solution freshly
made was 295–305 mOsmol, and the pipette resistance
was 10–15 MΩ.
It is noteworthy that the axonal blebs of pyramidal neurons were formed from the resealing at the end of cut axons during slice preparation. Although this prepar-ation could be argued as an injured axon, several lines of evidence indicated the functional intact of axonal blebs. The values of resting membrane potentials and action potentials are closely normal (Figures 1, 2, 3, 4 and 5). These axons underwent the functional plasticity, i.e.,
upregulation and downregulation in their abilities to fire spikes (Figures 8 and 9). Moreover, other studies in immunohistochemistry and electrophysiology suggested that the functions of axonal blebs were likely normal [7]. The intrinsic properties of the somata and axonal blebs in our studies included spike thresholds and refractory periods measured under a whole-cell current-clamp. Spike thresholds were measured by depola-rization pulses with the inverse changes in their in-tensities and durations. Spike refractory periods were measured by injecting two pulses (5% above threshold) with various durations into the neurons after each spike, in which inter-pulse intervals were adjusted [32,33,55,68,72]. In the measurement of spike refrac-tory periods versus pulse durations, the increment of depolarization duration was inversely associated with the reduction of its intensities, which were 5% above thresholds.
Pharmacological studies
Anemone toxin (ATX; [34] was dissolved freshly in the
standard ACSF at 5 μM for a final concentration, and
was given to a specific subcellular compartment by a pipette perfusion via the pressure. In the application of
ATX, fluorescent Alex-488 (10μM) was also added into
this solution in order to show the size of areas for per-fusing ATX to be restricted to specific subcellular com-partment. The pressure was added into the pipettes to have ATX/ Alex-488 diffusion within an area of less than
10 μm diameters, which was seen under a fluorescent
microscope at 488 nm.
Single channel recordings
VGSCs’currents were recorded in a cell-attached config-uration by MultiClamp-700B and pClamp-10 at the axonal bleb and soma of identical pyramidal neurons. Seal resistance was above 10 GΩ, and pipette resistance
was 10–12 MΩ. Pipette solution contains (mM) 120
NaCl, 2 MgCl2, 10 HEPES, 30 TEA and 0.1 mibefradil [13]. The threshold potentials for VGSC activation were measured by adding negative voltage-pulses into the re-cording pipettes.
Modeling
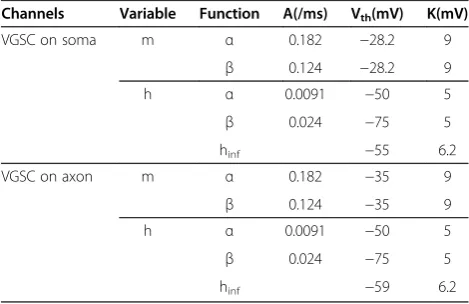
Computational simulation was achieved in NEURON (v7.0), and the following facts were taken into account. The dynamics of axonal and somatic VGSCs (Figure 6) was introduced into the axon and soma of a neuronal model, respectively, to test the initiation of action potentials [42,73,74]. Other parameters about VGSCs were based on Hodgkin-Huxley kinetics and current reports [7,9,10].
Geet al. Molecular Brain2014,7:26 Page 13 of 16
The equations for the Na current were based on the works of Hodgkin and Huxley. Na current was calcu-lated by Ohmic relation:
Ina¼gnam3h V m−Ena
ð Þ
mandhwere calculated by first order kinetic equations:
m0
¼ minf−m
τm
h0 ¼ hinf−h
τh
minf and hinf represented the steady-state value of m and h. τm and τh were time constant.minf and τm were calculated by following equations:
minf ¼αþαβ
τm¼ 1
αþβ
In these equations,αand βwere the functions of local membrane potential (Vm), which were calculated by:
αðVmÞ ¼1A Vð m−VthÞ −e−ðVm−VthÞ=κ βðVmÞ ¼1−A Vð m−VthÞ −e−ðVm−VthÞ=κ
All constants in these equations were shown in Table one. In terms of h, τh was described analogously to τm, buthinfwas given directly by:
hinf ¼1 1
þeðVm−VthÞ=κ
The constants of this equation also are shown in Table 1. The distributions of VGSCs in these two compart-ments were based on the references [2,3,7,9,10]. VGSCs’ reversal potential was set at 50 mV. For potassium
channels, high-voltage-activated K+ channels (Kv) and
slowly-activated/non-inactivated M-type K+ channels
(Km) were added into this neuronal model. To have the initiation of sequential spikes, the densities of Kv
and Km were 50 and 100 pS/cm2 on these two
com-partments, respectively. The reversal potential for K+
channels was set to−77 mV. In addition, cylinder axon
was calculated based on 1.6μm in diameter and 70μm
in length, as well as the soma was 30 μm in diameter.
Their passive electrical properties include Cm= 1 μF/
cm2, Rm= 15000 Ω/cm2 and Ri= 100 Ω/cm. Resting
membrane potentials were −71 mV. The simulations
were run under 37°C. The time step was 0.025 ms.
Data analyses
The data were analyzed if the soma and axon had resting membrane potentials negatively more than−63 mV and ac-tion potentials above 90 mV. Criteria for the acceptaac-tion of each experiment also included less than 5% changes in rest-ing membrane potential, spike magnitude, input and seal resistance during each experiment. The data for VGSCs’ re-cording was taken into account if seal resistance reached to 10 GΩ. The values of spike threshold, refractory period and VGSC currents are presented as mean ± SE. The statistical analyses and comparisons of the results among the different subcellular compartments are done by paired t-test.
Additional files
Additional file 1: Figure S1.The same inputs to different sites induce different outputs, while the propagation of spikes is faithful. The insets show simultaneous recordings on soma and axon bleb. The red curves are recordings from soma while the blue curves are from axon.A)The same long-time step pulse is injected to axon (left panel) and to soma (right panel) separately. The outputs are different, but keep consistent between the two recording sites. More spikes are induced when long-time step pulse is injected to soma (right panel).B)The same fluctuated signal is injected to axon (left panel) and to soma (right panel) separately. The outputs are different, but also keep consistent between the two recording sites. In this case, more spikes are induced when fluctuated signal is injected to axon.
Additional file 2: Figure S2.Current-voltage relationships of axon and soma.A)Membrane potentials of axon (blue) and soma (red) under grade subthreshold pulses to these two sites respectively. Schematic for step currents is at the bottom of the panel. Dotted lines indicate the points which are chose to calculate current-voltage correlation.B)Correlations between input currents and membrane potentials of axon (filled circles and blue line) and soma (open circles and red line, n=9). There’s no obvious difference between two lines.
Additional file 3: Figure S3.ATX does not significantly influence spike thresholds and refractory periods at the soma of cortical pyramidal neurons. The spike thresholds and refractory periods are measured dynamically by changing the patterns of input signals at the soma.A)shows threshold stimuli vs. depolarization time at the soma. Compared with the control (red symbols), ATX does not change somatic spike thresholds significantly (green symbols; n=12).B)illustrates spike refractory periods vs. depolarization time at the soma. Compared with the control, ATX does not change the refractory periods of somatic spikes (green symbols, n=11).
Competing interests
Authors claim no competing interests.
Table 1 Parameters for the equations describing VGSCs
Channels Variable Function A(/ms) Vth(mV) K(mV)
VGSC on soma m α 0.182 −28.2 9
β 0.124 −28.2 9
h α 0.0091 −50 5
β 0.024 −75 5
hinf −55 6.2
VGSC on axon m α 0.182 −35 9
β 0.124 −35 9
h α 0.0091 −50 5
β 0.024 −75 5
hinf −59 6.2
Geet al. Molecular Brain2014,7:26 Page 14 of 16
Authors’contributions
RG and NC contribute to the experiments and data analyses. HQ works on the computational simulation. JHW contributes to project design and manuscript writing. All authors have read and approved the final version of manuscript.
Acknowledgement
This study is granted by National Basic Research Program (2013CB531304 and 2011CB504405) and Natural Science Foundation China (30990261 and 81171033) to JHW.
Author details
1
State Key Lab for Brain and Cognitive Sciences, Institute of Biophysics, Chinese Academy of Sciences, 15 Datun Road, Chaoyang District, 100101 Beijing, China.2University of Chinese Academy of Sciences, 100049 Beijing, China.3Qingdao University, Medical College, 38 Dengzhou, Shandong
266021, China.
Received: 2 January 2014 Accepted: 26 March 2014 Published: 4 April 2014
References
1. Brock LG, Coombs JS, Eccles JC:Intracellular recording from antidromically activated motoneurones.J Physiol Lond1953,122:429–461.
2. Clark BA, Monsivais P, Branco T, London M, Hausser M:The site of action potential initiation in cerebellar Purkinje neurons.Nat Neurosci2005, 8:137–139.
3. Colbert CM, Pan E:Ion channel properties underlying axonal action potential initiation in pyramidal neurons.Nat Neurosci2002,5:533–538. 4. Eccles JC:The physiology of nerve cells.Baltimore: Johns Hopkins University
Press; 1957.
5. Edwards C, Ottoson D:The site of impulse initiation in a nerve cell of a crustacean sretch receptor.J Physiol Lond1958,143:138–148. 6. Fuortes MGF, Frank K, Becker MC:Steps in the production of motor
neuron spikes.J Gen Physiol1957,40:735–752.
7. Hu W, Tian C, Li T, Yang P, Hou H, Shu YS:Distinct contribution of Nav1.6 and Nav1.2 in action potential initiation and backpropagation.Nat Neurosci2009,12:996–1002.
8. Kandel ER, Spencer WA, Brinley FJJ:Electrophysiology of hippocampal neuron. I. Sequential invasion and synaptic organization.J Neurophysiol 1961,24:225–242.
9. Kole MHP, Ilschner SU, Kampa BM, Williams SR, Ruben PC, Stuart GJ:Action potential generation requires a high sodium channel density in the axon initial segment.Nat Neurosci2008,11:178–186.
10. Kole MH, Stuart GJ:Is action potential threshold lowest in the axon? Nat Neurosci2008,11:1253–1255.
11. Chen WR, Midtgaard J, Shepherd GM:Forward and backward propagation of dendritic impulses and their synapstic control in mitral cells.Science 1997,278:463–467.
12. Chen WR, Shen GY, Shepherd GM, Hines ML, Midtgaard J:Multiple modes of action potential initiation and propagation in mitral cell primary dendrite.J Neurophysiol2002,88:2755–2764.
13. Chen N, Yu J, Qian H, Ge R, Wang JH:Axons amplify somatic incomplete spikes into uniform amplitudes in mouse cortical pyramidal neurons. PLoS One2010,5(7):e11868.
14. Gasparini S, Migliore M, Magee JC:On the initiation and propagation of dendritic spikes in CA1 pyramidal neurons.J Neurosci2004,24:11046–11056. 15. Ge R, Qian H, Wang JH:Physiological synaptic signals initiate sequential
spikes at soma of cortical pyramidal neurons.Mol Brain2011,4:19. 16. Gulledge AT, Stuart GJ:Action potential initiation and propagation in
layer 5 pyramidal neurons of the rat prefrontal cortex: absence of dopamine modulation.J Neurosci2003,23:11363–11372. 17. Hanson JE, Smith Y, Jaeger D:Sodium channels and dendritic spike
initiation at excitatory synapses in globus pallidus neurons.J Neurosci 2004,24:329–340.
18. Larkum ME, Waters J, Sakmann B, Helmchen F:Dendritic spikes in apical dendrites of neocortical layer 2/3 pyramidal neurons.J Neurosci2007, 27:8999–9008.
19. Luscher HR, Larkum ME:Modeling action potential initiation and back-propagation in dendrites of cultured rat motoneurons.J Neurophysiol 1998,80:715–729.
20. Roberts CB, Campbell RE, Herbison AE, Suter KJ:Dendritic action potential initiation in hypothalamic gonadotropin-release hormone neurons. Endocrinology2008,149:3355–3360.
21. Stuart GJ, Schiller J, Sakmann B:Action potential initiation and propagation in rat neocortical pyramidal neurons.J Physiol Lond1997, 505:617–632.
22. Deqenetais E, Thierry AM, Glowinski J, Gioanni Y:Electrophysiological properties of pyramidal neurons in the rat prefrontal cortex: an in vivo intracellular recording study.Cereb Cortex2002,12:1–16.
23. Haider B, Duque A, Hasenstaub A, McCormick DA:Neocortical network activity in vivo is generated through a dynamic balance of excitation and inhibition.J Neurosci2006,26:4535–4545.
24. Henze DA, Buzsaki G:Action potential threshold of hippocampal pyramidal cells in vivo is increased by recent spiking activity. Neuroscience2001,105:121–130.
25. Zhang Z, Yu YQ, Liu CH, Chan YS, He J:Reprint of“frequency tuning and firing pattern properties of auditory thalamic neurons: an in vivo intracellular recording from the guinea pig”.Neuroscience2008, 154:273–282.
26. Colbert CM, Johnston D:Axonal action-potential initiation and Na + channel densities in the soma and axon initial segment of subicular pyramidal neurons.J Neurosci1996,16:6676–6686.
27. Zonta B, Desmazieres A, Rinaldi A, Tait S, Sherman DL, Nolan MF, Brophy PJ: A critical role for Neurofascin in regulating action potential initiation through maintenance of the axon initial segment.Neuron2011, 69:945–956.
28. Milescu LS, Yamanishi T, Ptak K, Smith JC:Kinetic properties and functional dynamics of sodium channels during repetitive spiking in a slow pacemaker neuron.J Neurosci2010,30:12113–12127.
29. Grubb MS, Burrone J:Activity-dependent relocation of the axon initial segment fine-tunes neuronal excitability.Nature2010,465:1070–1074. 30. Kuba H, Oichi Y, Ohmori H:Presynaptic activity regulates Na(+) channel
distribution at the axon initial segment.Nature2010,465:1075–1078. 31. Fellous JM, Houweling AR, Modi RH, Rao RPN, Tiesinga PHE, Sejnowski TJ:
Frequency dependence of spike timing reliability in cortical pyramidal cells and interneuron.J Neurophysiol2001,85:1782–1787.
32. Chen N, Chen SL, Wu YL, Wang JH:The refractory periods and threshold potentials of sequential spikes measured by whole-cell recordings. Biochem Biophys Res Commun2006,340:151–157.
33. Chen N, Zhu Y, Gao X, Guan S, Wang J-H:Sodium channel-mediated intrinsic mechanisms underlying the differences of spike programming among GABAergic neurons.Biochem Biophys Res Commun2006, 346:281–287.
34. Mantegazza M, Franceschetti S, Avanzini G:Anemone toxin (ATX II)-induced increase in persistent sodium current: effects on the firing properties of rat neocortical pyramidal neurones.J Physiol1998, 507(Pt 1):105–116.
35. Rathmayer W:Anemone toxin discriminates between ionic channels for receptor potential and for action potential production in a sensory neuron.Neurosci Lett1979,13:313–318.
36. Aldrich RW, Corey DP, Stevens CF:A reinterpretation of mammalian sodium channel gating based on single channel recording.Nature1983, 306:436–441.
37. Goldman L:Stationarity of sodium channel gating kinetics in excised patches from neuroblastoma N1E 115.Eur Biophys1995,69:2364–2368. 38. Milescu LS, Bean BP, Smith JC:Isolation of somatic Na + currents by
selective inactivation of axonal channels with a voltage prepulse. J Neurosci2010,30:7740–7748.
39. Melinek R, Muller KJ:Action potential initiation site depends on neuronal excitation.J Neurosci1996,16:2585–2591.
40. Rush AM, Dib-Hajj SD, Waxman SG:Electrophysiological properties of two axonal sodium channels, Nav1.2 and Nav1.6, expressed in mouse spinal sensory neurones.J Physiol2005,564:803–815.
41. Hines ML, Carnevale NT:The NEURON simulation environment.Neural Comput1997,9:1179–1209.
42. Mainen ZF, Joerges J, Huguenard JR, Sejnowski TJ:A model of spike initiation in neocortical pyramidal neurons.Neuron1995,15:1427–1439. 43. Ge R, Chen N, Wang JH:Real-time neuronal homeostasis by coordinating
VGSC intrinsic properties.Biochem Biophys Res Commun2009,387:585–589. 44. Calvin WH:Three modes of repetitive firing and the role of threshold
time course between spikes.Brain Res1974,69:341–346.
Geet al. Molecular Brain2014,7:26 Page 15 of 16
45. Hodgkin AL, Huxley AF:Resting and action potentials in single nerve fibres.J Physiol1945,104:176–195.
46. Hodgkin AL:Beginning: some reminiscences of my early life (1914–1947). Annu Rev Physiol1983,45:1–16.
47. Daoudal D, Debanne D:Long-term plasticity of intrinsic excitability: learning rules and mechanisms.Learn Mem2003,10:456–465.
48. Desai NS, Rutherford L, Turrigiano GG:Plasticity in the intrinsic excitability of cortical pyramidal neurons.Nat Neurosci1999,2:515–520.
49. Ganguly K, Kiss L, Poo M-M:Enhancement of presynaptic neuronal excitability by correlated presynaptic and postsynaptic spiking. Nat Neurosci2000,3:1018–1026.
50. Nelson AB, Krispel CM, Sekirnjak C, du Lac S:Long-lasting increases in intrinsic excitability triggered by inhibition.Neuron2003,40:609–620. 51. Nick TA, Ribera AB:Synaptic activity modulates presynaptic excitability.
Nat Neurosci2000,3:142–149.
52. Sourdet V, Russier M, Daoudal G, Ankri N, Debanne D:Long-term enhancement of neuronal excitability and temporal fidelity mediated by metabotropic glutamate receptor subtype 5.J Neurosci2003,
23:10238–10248.
53. Spitzer NC, Kingston PA, Manning TJ JR, Conklin MW:Outside and in: development of neuronal excitability.Curr Opin Neurobiol2002,12:315–323. 54. Zhang M, Hung F, Zhu Y, Xie Z, Wang J:Calcium signal-dependent
plasticity of neuronal excitability developed postnatally.J Neurobiol2004, 61:277–287.
55. Chen N, Chen X, Wang J-H:Homeostasis established by coordination of subcellular compartment plasticity improves spike encoding.J Cell Sci 2008,121:2961–2971.
56. Angelides KJ, Elmer LW, Loftus D, Elson E:Distribution and lateral mobility of voltage-dependent sodium channels in neurons.J Cell Biol1988, 106:1911–1925.
57. Boiko T, Van Wart A, Caldwell JH, Levinson SR, Trimmer JS, Matthews G: Functional specialization of the axon initial segment by isoform-specific sodium channel targeting.J Neurosci2003,23:2306–2313.
58. Duflocq A, Le Bras B, Bullier E, Couraud F, Davenne M:Nav1.1 is
predominantly expressed in nodes of Ranvier and axon initial segments. Mol Cell Neurosci2008,39:180–192.
59. Fleidervish IA, Lasser-Ross N, Gutnick MJ, RW N:Na + imaging reveals little difference in action potential-evoked Na + influx between axon and soma.Nat Neurosci2010,13:852–860.
60. Garrido JJ, Fernandes F, Moussif A, Fache MP, Giraud P, Dargent B:Dynamic compartmentalization of the voltage-gated sodium channels in axons. Biol Cell2003,95:437–445.
61. Hill AS, Nishino A, Nakajo K, Zhang G, Fineman JR, Selzer ME, Okamura Y, Cooper EC:Ion channel clustering at the axon initial segment and node of Ranvier evolved sequentially in early chordates.PLoS Genet2008, 4:e1000317.
62. Inda MC, Defelipe J, Munoz A:Voltage-gated ion channels in the axon initial segment of human cortical pyramidal cells and their relationship with chandelie cells.Proc Natl Acad Sci U S A2006,103:2920–2925. 63. Lorincz A, Nusser Z:Cell-type-dependent molecular composition of the
axon initial segment.J Neurosci2008,28:14329–14340.
64. Royeck M, Horstmann MT, Remy S, Reitze M, Yaari Y, Beck H:Role of axonal NaV1.6 sodium channels in action potential initiation of CA1 pyramidal neurons.J Neurophysiol2008,100:2361–2380.
65. Schmidt-Hieber C, Bischofberger J:Fast sodium channel gating supports localized and efficient axonal action potential initiation.J Neurosci2010, 30:10233–10242.
66. Van Wart A, Trimmer JS, Matthews G:Polarized distribution of ion channels within microdomains of the axon initial segment.J Comp Neurol2007,500:339–352.
67. Wollner DA, Catterall WA:Localization of sodium channels in axon hillocks and initial segments of retinal ganglion cells.Proc Natl Acad Sci U S A1986,83:8424–8428.
68. Wang JH, Wei J, Chen X, Yu J, Chen N, Shi J:The gain and fidelity of transmission patterns at cortical excitatory unitary synapses improve spike encoding.J Cell Sci2008,121:2951–2960.
69. Zhou W, Goldin AL:Use-dependent potentiation of the Nav1.6 sodium channel.Biophys J2004,87:3862–3872.
70. Wang J-H:Short-term cerebral ischemia causes the dysfunction of inter-neurons and more excitation of pyramidal inter-neurons.Brain Res Bull2003, 60:53–58.
71. Hori N, Tan Y, Strominger NL, Carpenter DO:Intracellular activity of rat spinal cord motoneurons in slices.J Neurosci Methods2001,112:185–191. 72. Chen N, Chen X, Yu J, Wang J-H:After-hyperpolarization improves spike
programming through lowering threshold potentials and refractory periods mediated by voltage-gated sodium channels.Biochem Biophys Res Commun2006,346:938–945.
73. Kress GJ, Dowling MJ, Eisenman LN, Mennerick S:Axonal sodium channel distribution shapes the depolarized action potential threshold of dentate granule neurons.Hippocampus2010,20:558–571.
74. Pospischil M, Toledo-Rodriguez M, Monier C, Piwkowska Z, Bal T, Fregnac Y, Markram H, Destexhe A:Minimal Hodgkin-Huxley type models for different classes of cortical and thalamic neurons.Biol Cybern2008,99:427–441.
doi:10.1186/1756-6606-7-26
Cite this article as:Geet al.:Input-dependent subcellular localization of spike initiation between soma and axon at cortical pyramidal neurons.
Molecular Brain20147:26.
Submit your next manuscript to BioMed Central and take full advantage of:
• Convenient online submission
• Thorough peer review
• No space constraints or color figure charges
• Immediate publication on acceptance
• Inclusion in PubMed, CAS, Scopus and Google Scholar
• Research which is freely available for redistribution
Submit your manuscript at www.biomedcentral.com/submit
Geet al. Molecular Brain2014,7:26 Page 16 of 16