© 2010 Fridlyand and Philipson; licensee BioMed Central Ltd. This is an Open Access article distributed under the terms of the Creative Commons Attribution License (http://creativecommons.org/licenses/by/2.0), which permits unrestricted use, distribution, and repro-duction in any medium, provided the original work is properly cited.
Open Access
R E S E A R C H
Research
Glucose sensing in the pancreatic beta cell: a
computational systems analysis
Leonid E Fridlyand* and Louis H Philipson
Abstract
Background: Pancreatic beta-cells respond to rising blood glucose by increasing oxidative metabolism, leading to an increased ATP/ADP ratio in the cytoplasm. This leads to a closure of KATP channels, depolarization of the plasma membrane, influx of calcium and the eventual secretion of insulin. Such mechanism suggests that beta-cell metabolism should have a functional regulation specific to secretion, as opposed to coupling to contraction. The goal of this work is to uncover contributions of the cytoplasmic and mitochondrial processes in this secretory coupling mechanism using mathematical modeling in a systems biology approach.
Methods: We describe a mathematical model of beta-cell sensitivity to glucose. The cytoplasmic part of the model includes equations describing glucokinase, glycolysis, pyruvate reduction, NADH and ATP production and consumption. The mitochondrial part begins with production of NADH, which is regulated by pyruvate dehydrogenase. NADH is used in the electron transport chain to establish a proton motive force, driving the F1F0 ATPase. Redox shuttles and mitochondrial Ca2+ handling were also modeled.
Results: The model correctly predicts changes in the ATP/ADP ratio, Ca2+ and other metabolic parameters in response to changes in substrate delivery at steady-state and during cytoplasmic Ca2+ oscillations. Our analysis of the model simulations suggests that the mitochondrial membrane potential should be relatively lower in beta cells compared with other cell types to permit precise mitochondrial regulation of the cytoplasmic ATP/ ADP ratio. This key difference may follow from a relative reduction in respiratory activity. The model demonstrates how activity of lactate dehydrogenase, uncoupling proteins and the redox shuttles can regulate beta-cell function in concert; that independent oscillations of cytoplasmic Ca2+ can lead to slow coupled metabolic oscillations; and that the relatively low production rate of reactive oxygen species in beta-cells under physiological conditions is a consequence of the relatively decreased mitochondrial membrane potential.
Conclusion: This comprehensive model predicts a special role for mitochondrial control mechanisms in insulin secretion and ROS generation in the beta cell. The model can be used for testing and generating control hypotheses and will help to provide a more complete understanding of beta-cell glucose-sensing central to the physiology and pathology of pancreatic β-cells.
Background
The appropriate secretion of insulin from pancreatic β-cells is critically important for energy homeostasis. Pancreatic β-cells are adapted to sense blood glucose and other secret-agogues to adjust insulin secretion according to the needs of the organism. Rather than acti-* Correspondence:
lfridlia@medicine.bsd.uchicago.edu
1 Department of Medicine, The
University of Chicago, Chicago, IL, USA 60637
vating specific receptor molecules, glucose is metabolized to generate downstream signals that stimulate insulin secretion. Pancreatic β-cells respond to rising blood glu-cose by increasing oxidative metabolism, leading to increased ATP production in mito-chondria and in an enhanced ratio of ATP to ADP (ATP/ADP) in the cytoplasm [1-3]. The increase in intracellular ATP/ADP closes the ATP-sensitive K+ channels (K
ATP),
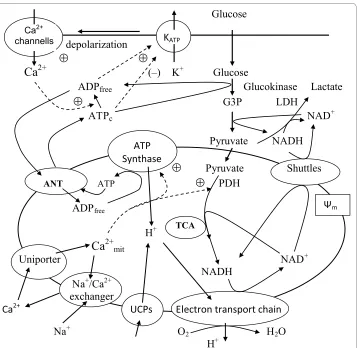
decreasing the hyperpolarizing outward K+ flux. This results in depolarization of the plasma membrane, influx of extracellular Ca2+ through the voltage-gated Ca2+ channels, a sharp increase in intracellular Ca2+ and activation of protein motors and kinases, which then mediate exocytosis of insulin-containing vesicles [2-5]. The currently accepted pro-cesses of glucose metabolism and Ca2+ handling in the cytoplasm and mitochondria of β -cells considered in this analysis are summarized in Figure 1[1-4].
A brief summary of these processes includes the following steps. Glucose enters β-cells by facilitated diffusion through glucose transporters (GLUT1 and 2). While this process is not limiting in β-cells [6], the next irreversible step, glucose phosphorylation, is cata-lyzed by a single enzyme, glucokinase (GK). This enzyme is specific for metabolic con-trol in the β-cell and hepatocyte, because the Km of GK for glucose is ~8 mM, a value that is almost two orders of magnitude higher than that of any other hexokinase. This step appears to be rate limiting for β-cell glycolytic flux under normal physiological condi-tions, so that GK is regarded as the β-cell 'glucose sensor' [1,3], underlying the depen-dence of the β-cell insulin secretory response to glucose in the physiological range.
Pyruvate is the main end product of glycolysis in β-cells and essential for mitochon-drial ATP synthesis. In the mitochonmitochon-drial matrix, pyruvate is oxidized by pyruvate dehy-drogenase to form acetyl-coenzyme A (acetyl-CoA). Acetyl-CoA enters the tricarboxylic acid (TCA) cycle to undergo additional oxidation steps generating CO2 and the reducing equivalents, flavin adenine dinucleotide (FADH2) and NADH. Oxidation of reducing equivalents by the respiratory chain is coupled to the extrusion of protons from the matrix to the outside of the mitochondria, thereby establishing the electrochemical gra-dient across the inner mitochondrial membrane (Figure 1). The final electron acceptor of these reactions is molecular oxygen, as in other eukaryotic cells. The electrochemical gradient then drives ATP synthesis at the F1F0-ATPase complex to phosphorylate mito-chondrial ADP, thereby linking respiration to the synthesis of ATP from ADP and inor-ganic phosphate (Figure 1). Adenine nucleotide translocase (ANT) exchanges matrix ATP for ADP to provide ATP for energy consuming processes in the cytosol. Some cyto-solic ATP is also produced in the latter part of glycolysis. However, this appears to be of minor consequence relative to that subsequently generated in the mitochondria, which represents an estimated 90% of the total β-cell ATP production [7,8].
of LDH expression in insulin-secreting cells is important to preferentially channel pyru-vate towards mitochondrial metabolism (see [1,10,16]). However, the low LDH levels likely leads to activation of compensatory mechanisms because NAD+-dependent glyco-lytic enzymes (e.g., glyceraldehyde 3-phosphate dehydrogenase) require that cytoplas-mic NADH must be re-oxidized to NAD+. This reaction is usually catalyzed by LDH, but because β-cells cannot use this pathway effectively, these cells must re-oxidize cytoplas-mic NADH by activation of two mitochondrial hydrogen shuttles (Figure 1), the malate-aspartate shuttle and the glycerol phosphate shuttle [15,17-19].
Figure 1 Schematic diagram of biochemical pathways involved in energy metabolism and Ca2+ han-dling in the pancreatic β-cell. Glucose equilibrates across the plasma membrane and is phosphorylated by glucokinase to glucose 6-phosphate, which initiates glycolysis. Lactate dehydrogenase (LDH) converts a por-tion of pyruvate to lactate. Pyruvate produced by glycolysis preferentially enters the mitochondria and is me-tabolized in the tricarboxylic acid (TCA) cycle, which then yields reducing equivalents in the form of NADH and FADH2. The transfer of electrons from these reducing equivalents through the mitochondrial electron trans-port chain is coupled with the pumping of protons from the mitochondrial matrix to the intermembrane space. The resulting transmembrane electrochemical gradient drives the ATP synthesis at ATP-synthase. Part of the protons may leak back through uncoupling proteins (UCPs). The shuttle systems are required for the transfer of reducing equivalents from the cytoplasm to the mitochondrial matrix. Calcium handling proteins such as the uniporter and Na+/Ca2+ exchanger regulate Ca2+ handling in mitochondria. ATP is transferred to the
cytosol, raising the ATP/ADP ratio. This results in the closure of the ATP sensitive K+ channels (katp), which in
turn leads to depolarization of the cell membrane. In response, the voltage-sensitive Ca2+ channels open,
pro-moting calcium entry and increasing the cytoplasmic Ca2+. ATP
c and ADPfree are the free cytosolic form of ATP
Glucose signaling in β-cells has several other peculiarities, including generation of
multiple oscillations in metabolism, mitochondrial membrane potential Ψm) and
NADH, mitochondrial and cytoplasmic Ca2+ and, ultimately, the oscillations of insulin secretion [5,20-23]. The coupling of these various oscillators is not clearly understood. In addition, the respiratory rate is lower and relative leak activity is higher in isolated β-cell mitochondria (as found in a cultured β-cell line) compared with isolated mitochondria from skeletal muscle [24,25]. These observations need clarification to better understand how mitochondrial processes are linked with insulin secretion.
The unique character of the β-cell response to glucose is usually attributed solely to glucokinase. Because of its near-dominant control of glycolytic flux, this enzyme is thought to govern the ATP/ADP ratio and insulin secretion almost exclusively [1,3]. While glucokinase certainly exerts a critical level of control on downstream events, other cytoplasmic and mitochondrial processes also play an essential role in glucose-stimu-lated insulin secretion (GSIS) [1,2,10]. In particular the relatively high flexibility of the ATP/ADP ratio in β-cells may be accounted for, at least partly, by mitochondrial pecu-liarities as well as by properties of glucokinase [24,26,27]. For these reasons it is critical to develop a comprehensive understanding as to how cytoplasmic and intramitochon-drial fuel metabolism is coupled to fuel availability and thereby "sensed."
The goal of this work is to determine the contribution of the cytoplasmic and mito-chondrial processes regulating GSIS using a mathematical modeling approach. Mathe-matical modeling can be a powerful systems biology tool allowing quantitative descriptions of the control individual components exert over the whole biological sys-tem. Several mathematical approaches in the literature have provided quantitative esti-mates of energetic and mitochondrial processes in pancreatic β-cells. However, these models are limited in the pathways that are considered, so that a more comprehensive approach is now necessary.
The first detailed β-cell model was developed by Magnus and Keizer [28-30]. However, several mechanisms used for simulations in this model have recently been reevaluated. For example, steady-state electron transport and the F1F0 ATPase proton pump were modeled according to the "six states proton pump mechanism" [28]. This mechanism does not correspond to the present understanding of the function of the electron trans-port chain (ETC) and the mitochondrial F1F0 adenosine trisphosphatase (see for example [31]). Models of the LDH and NADH shuttles were not included, and mitochondrial fluxes may also have been overestimated in this model (see below). The main goal of these models was to examine the possible mechanisms underlying oscillations in pancre-atic β-cells, not biochemical regulation of β-cell glucose sensitivity that we are focused on here.
A complex kinetic model of the metabolic processes in pancreatic β-cells based on in vitro enzyme kinetics was recently developed [32]. However, while heroically compli-cated models with numerous parameters and enzyme activities are interesting, they require data on in vivo enzyme activities and coefficients that are not readily available.
pancre-atic β-cell energetics and mitochondrial calcium regulation fall short of a comprehensive explanation of the mechanisms of β-cell sensitivity.
To address this we have developed a specific quantitative, kinetic model (see Appen-dix) of the core processes of β-cell cytoplasmic and mitochondrial energetic based on a simplified map of the biochemical pathways schematized in Figure 1. We included the most recent experimental characterizations of the majority of processes in the model to insure accuracy. However, for simplification, we modeled only those regulatory cou-plings that we have deemed most crucial for the β-cell metabolic regulation based on experimental evidence. The model includes the dynamic equations for cytoplasmic ADP,
NADH and glyceraldehyde 3-phosphate, mitochondrial Ψm and NADH, mitochondrial
and cytoplasmic Ca2+ and pyruvate. When available we used the values of the coeffi-cients determined for living cells rather than for isolated enzymes and cell-free mito-chondria (Appendix).
We show that this model has qualitative properties consistent with expectations for the pancreatic β-cell including showing appropriate oscillations in mitochondrial metabo-lism and Ca2+ concentration. The model also reproduces simultaneous measurements of the behavior of multiple constituents within the cytoplasm and mitochondria such as
NADH, Ca2+ and Ψ
m at high temporal resolution. We also discuss specific differences in muscle and β-cell mitochondrial function, providing insight into essential control prop-erties of the β-cell. Furthermore, predictions on the dynamics of as yet unmeasured mol-ecules could be made, and the model further tested by verifying these predictions.
Nutrient-stimulated insulin secretion in β-cells is impaired in the diabetic state. This may result from impaired glucose-induced ATP/ADP ratio elevation in β-cells [26,35]. Furthermore, it is becoming increasingly clear that the development of type 2 diabetes is associated with mitochondrial dysfunction [27,35-37]. Insulin signaling also effects mitochondrial function in β-cells [38]. Thus, knowledge of the mechanisms of regulation of ATP production and consumption are central to understand β-cell glucose-sensing and mechanisms of dysfunction in type 2 diabetes.
Results and Discussion
Steady state stimulation with a step increase in glucose concentration
was establishment of an elevated Ψm. The hyperpolarization of the inner mitochondrial membrane resulted in increased ATP production by F1F0 ATPase, decreased [ADP]c and a corresponding increased ATP/ADP ratio (Figure 2D). The phosphorylation rate (Jph) reached saturation at high glucose concentration (Figure 2C) as a consequence of decreased [ADP]c and saturated Ψm(see Equation 7 and Figure 12 in Appendix).
Simul-taneously, [Ca2+]
c increased with increased ATP/ADP ratio according to the empirical
Equation 23 (Appendix). We also simulated the steady-state response of free mitochon-drial matrix Ca2+ to changes in cytoplasmic Ca2+ concentration, Ψ
m and finally glucose (Figure 2E).
As expected, our simulations were consistent with experimental data. Glucose utiliza-tion increased lactate synthesis, O2 consumputiliza-tion and CO2 producutiliza-tion [1,7,39,40]. Both cellular [G3P] and [PYR] increased after simulating increased extracellular glucose (Fig-ure 2B). This result is consistent with the finding of increased glycolytic intermediates and pyruvate after glucose challenge in the INS1 β-cell line [41] as well as the increase in Ψm with increased glucose in mouse islets [20-22,42-44].
An accurate measurement of lactate output in β-cells from isolated islets is difficult to obtain because LDH expression in non-β-cells is considerably higher than in β-cells, and high rates of lactate output may also originate from cells in the centers of isolated islets that are prone to oxygen depletion and necrosis [39,45]. However, the oxidative produc-tion of CO2 from [3,4-14C]glucose represented close to 100% of the total glucose utiliza-tion in purified rat β-cells [39] indicating that lactate output should not exceed several percent. Very low lactate output was also found in β-cell lines [46]. Our simulated small lactate output in Figure 2A is consistent with these experimental data.
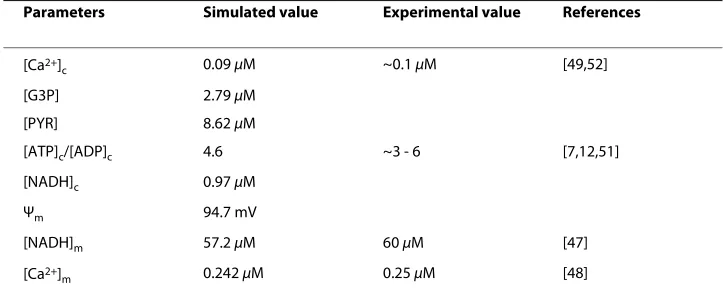
The results of the simulation (Table 1 and Figure 2B) were also consistent with the range of measured [NADH]m reported previously. For example, the concentration of free
NADH in mitochondria of intact pancreatic islets at resting glucose levels (4-5 mM) is
about 60 μM and the maximum mitochondrial glucose-induced increase in free
NAD(P)H reached 75 μM [47]. The simulated increased [Ca2+]
c versus glucose
concen-tration (Figure 2E) was also in agreement with previous reports (see for example [42,48-50]).
Several studies have confirmed an increase in the ATP/ADP ratio in response to high glucose (see for e.g. [3,7,12,26,51]. A simultaneous rise in ATP/ADP and NADH/(NAD+ + NADH) ratio was found in rat islets [52], and NAD+/NADH was increased in rat β -Table 1: Stimulated steady-state values for low glucose (5 mM) (see text for explanations)
Parameters Simulated value Experimental value References
[Ca2+]
c 0.09 μM ~0.1 μM [49,52]
[G3P] 2.79 μM
[PYR] 8.62 μM
[ATP]c/[ADP]c 4.6 ~3 - 6 [7,12,51]
[NADH]c 0.97 μM
Ψm 94.7 mV
[NADH]m 57.2 μM 60 μM [47]
[Ca2+]
Figure 2 Effect of increasing glucose on cell energetics. Extracellular glucose concentration was varied and the steady-state simulations of the model parameters represented. Simulations were run with the basic set of parameters (Tables 2 and 3). A: Jglu is the rate of the glucokinase reaction (for comparison with other fluxes the
amount of 2 Jglu is represented since two pyruvate molecules are synthesized from one molecule of glucose),
jpyr is the rate of pyruvate decarboxylation, jtnadh is the flux through the NADH shuttles measured as the rate of cytoplasmic NAD+ production from cytoplasmic NADH, J
LDH is the lactate flux catalyzed by lactate
dehydro-genase; B: [NADH]c and [NADH]m are cytoplasmic and mitochondrial NADH, [Pyr] is the pyruvate concentration,
[G3P] is the cytoplasmic glyceraldehydes 3-phosphate concentration; C: Jhres is the rate of proton pumping through ETC, Jph is the proton flux through the F1F0 ATPase, Jhi is the leak of protons from mitochondria; D: Ψm
is the mitochondrial membrane potential, [ATP]c/[ADP]c is the cytoplasmic ATP/ADP ratio; E: [Ca2+]
c and [Ca2+]m
cells and in the MIN6 β-cell line in response to high glucose [53]. The rise in ATP/ADP ratio as well as in relative NAD(P)H, Ψm, [Ca2+]
m and oxygen consumption were also
observed with glucose stimulation in control INS-1 cells [54,55]. Our simulations are generally consistent with these data.
Regulation at the mitochondrial level
The model suggests a possible reconciliation of several apparent contradictions between live cell experimental data and regulation of mitochondrial energetics obtained in exper-iments with isolated mitochondria.
1. A basic principle of mitochondrial energetics is given by the inverse relationship between the respiratory flux and Ψm, i.e. the higher Ψm, the lower the respiration rate [24,56]. We simulated this relationship using Equation 5C (Appendix). However, the electron transport rate (Jhres) and O2 consumption increased simultaneously with Ψm in our simulation of the β-cell (see Figure 2C) as well as in vivo (see above). The model offers the following explanation of this contradiction. In our model (as in living cells) the electron transport rate (Equation 5) depends on at least two factors: one is a decrease in the electron transport rate with an increase in Ψm (Equation 5C) but another factor is an increase of this rate with increased substrate concentration (NADH) (Equation 5A). Increasing the electron transport rate simultaneously with Ψm means that the enhance-ment of Jhres as a result of the increased [NAPH]m was greater than its decrease with the
rise of Ψm following the step increase in glucose. Substrate concentrations are usually maintained at constant or saturated levels in experiments with isolated mitochondria, where one can only see inhibition of the electron transport rate with increased Ψm.
2. The respiratory control hypothesis for ATP production in intracellular mitochon-dria was based on experiments with isolated mitochonmitochon-dria which found that ADP avail-ability to the ATP-synthase is the limiting factor for mitochondrial ATP production [57], that is, the rate of ATP synthesis should decrease with decreased [ADP]c. This mecha-nism corresponds to Equation 7A in our model. Experimentally this hypotheses has been tested in permeabilized clonal β-cells, where ATP/ADP ratios can be externally fixed showing that a decrease in [ADP] led to decreased O2 consumption [3]. However, an
increased ATP/ADP ratio (usually due to decreased [ADP]c) coincidentally with
increased respiration rate and oxidative phosphorylation has been firmly established for
pancreatic β-cells as a signal for GSIS in response to increased glucose
[1,3,7,12,26,51,55]. Similar results were obtained in our simulation of β-cell shown in Figure 2D. At first glance these data seem inconsistent with the expected inhibition of respiration with decreased ADP concentration [3,55].
Our analysis resolves this apparent contradiction. In our model the ATP synthesis rate is dependent on at least two factors: one is a decreased ATP synthesis rate with decreased [ADP]c (Equation 7A) but another factor is an increased ATP synthesis rate with increased Ψm(Equation 7B). Our simulation shows that enhancement of ATP pro-duction with increasing Ψm was greater than its decrease as a result of decreasing [ADP]c following a step increase in glucose. As a result, ATP synthesis and respiration rate increase despite decreased [ADP]c and the ATP/ADP ratio increased with a step glucose increase (Figure 2D). These simulations imply that glucose challenge can lead to simulta-neous increases in Ψm, the ATP/ADP ratio and in the rates of mitochondrial ATP
The concentrations of free ATP and ADP in the cytoplasm were used in our model since only free molecules can take part in reactions. However, the free ATP concentra-tion is close to its total concentraconcentra-tions, whereas the fracconcentra-tion of bound ADP may be sub-stantial [58,59]. On the other hand, most estimated ATP/ADP ratios are based on measurements of total nucleotide content [7,12,51]. For this reason, the measured ATP/ ADP ratio of total ATP and ADP nucleotide content is likely to be substantially smaller than ratio of concentration of the free components, simply because the measured total ADP content includes bound ADP. Therefore, it is not surprising that the simulated ATP/ADP ratio change in Figure 2D using free nucleotide concentrations is greater than that in published experimental data (see for example [7,12,51].
According to our simulation only a small increase in the ATP concentration occurred following glucose challenge (not shown). A decrease in the free [ADP]c is the main factor leading to an increase in the ATP/ADP ratio following increased glucose in Figure 2D. This simulation is in agreement with experimental data and can be a consequence of the initial high ATP/ADP ratio even with a low glucose level in our model (see Table 1). For this reason, the ATP concentration cannot be increased significantly if the total adenine nucleotide concentration is kept constant, whereas the relative [ADP] may undergo a pronounced decrease (see our previous publication [26] for a detailed consideration of this question).
Decreased Ψm and respiratory activity regulate mitochondrial glucose sensitivity in β-cells
β-cell regulatory mechanisms endow this cell type with unique metabolic properties to control insulin secretion in comparison with metabolism in other cell types. For exam-ple, liver cells maintain a stable ATP/ADP equilibrium while respiring at widely varying rates [60]. Cardiac myocytes can increase, by three- to sixfold, the rate of cardiac power generation, myocardial oxygen consumption, and ATP turnover in the transition from rest to intense exercise [61]. Nevertheless, at high work states the myocardial ATP and ADP concentrations are maintained at a relatively constant level despite the increased turnover rates [34,62].
Specific β-cell respiratory mechanisms can be illustrated by comparing isolated mito-chondria from skeletal muscle and cultured β-cells. The rate of respiration was higher (>5.5 fold) and the relative leak rate was significantly lower at any Ψm value in isolated mitochondria from skeletal muscle than in those from cultured β-cells [24,25]. We exam-ined how these differences effect mitochondrial function by simulating the conditions of work in muscle mitochondria (Figure 3). Mitochondrial NADH and cytoplasmic ADP concentration are maintained at a relatively high and constant level in muscle cells [34,62]. To simulate this, the concentration of [NADH]m was set as a constant reflecting this concentration for high glucose level in a β-cell (25 mM). [ADP]c was also set to an elevated constant level (700 mM), that was 5-fold higher than the calculated [ADP]c level
(at 9 mM glucose) in β-cells.
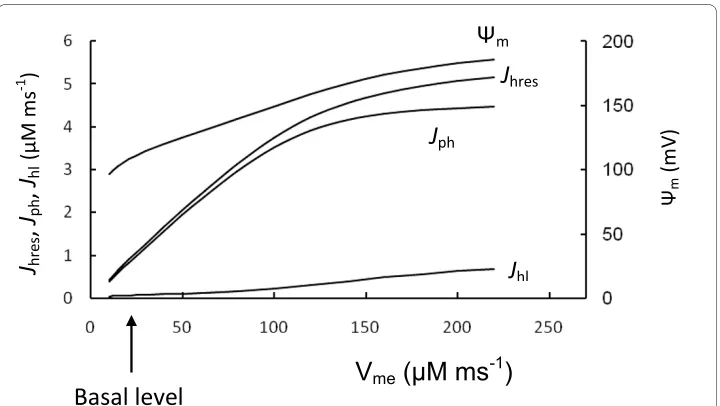
Figure 3 shows the results of simulations in which the maximal rate of ETC (Vme) was increased in steps. Mitochondrial F1F0 ATPase activity (Vmph) was unchanged. Simulated Ψm and the rate of ATP production (Jph) were significantly increased with an increased Vme, such that F1F0 ATPases work with maximal activity under these conditions (com-pare Jph in Figure 2C and Figure 3). This can be explained by the high Ψm (more
β-cells. Note that the rate of ATP production (Jph) depended only slightly on Ψm change when Ψm was increased above 160 mV, since these levels of Ψm were saturating for F1F0 ATPase activity (Appendix, Figure 12).
This indicates that the F1F0 ATPase can work in muscle cells with maximal productiv-ity during increased respiration activproductiv-ity because ADP concentration and Ψm are sup-ported at relatively higher levels. It thus appears that a decrease in the efficiency of mitochondrial energy production with decreased Ψm can lead to a relatively high degree
of control on the phosphorylation potential in β-cells, i.e. a change in Ψm leads to a large change in Jph. Interestingly, the simulated relative leak (Jh1) magnitude was significantly lower in the muscle cell simulation in comparison with respiration rate (evaluated as
Jhres) at increased Vme even with invariant coefficients for the proton leak, since the rates of respiration and ATP production were highly increased but a coefficient of leak (Jh1) would remain as constant (Figure 3).
Our simulations help explain the data of Affourit and Brand [24,25] showing decreased respiratory and increased relative leak activity in isolated β-cell mitochondria. This sug-gests that mitochondrial glucose sensitivity in β-cells results from decreased respiratory activity compared with F1F0 ATPase activity. This leads to mitochondrial work at decreased Ψm that is in the region where variations in Ψm should result in an increased sensitivity to glucose. Decreased respiratory activity in β-cells leads to a decreased ATP production rate by the F1F0 ATPase. However, this gives β-cells the ability to adaptively change the ATP/ADP ratio in response to changes in glucose concentration.
Figure 3 Comparison with muscle cell mitochondria. To compare β-cell and muscle cell mitochondria function we increased step by step the maximal rate of respiration (Vme, Equation 5) from basal β-cell level
(ar-row) (Table 3) and calculated the respiration rate (as Jhres), phosphorylation rate (as Jph), leak (Jhl) and Ψm in
Interestingly, the oxidative phosphorylation rate (per g dry weight) was significantly lower in pancreatic islets even in high glucose, compared with brain or heart [7], sup-porting our suggestion regarding decreased respiratory activity in β-cells.
Changes in leak activity and the role of uncoupling agents
Our model features increasing proton-leak with increased Ψm (Equation 8, Appendix). We simulated how changes in leak activity affect the response of the variables. To do this we increased the regulated coefficient of proton leak (P1r in Equation 8, Appendix) three-fold leading to an increase in the total proton leak rate by twothree-fold (Figure 4). As expected, one effect was to reduce the inner membrane potential that causes a corre-sponding right-shift in the ATP/ADP ratio and [Ca2+]
c response to glucose. To simulate decreased leak activity (for example following decreased uncoupling protein expression) we set the regulated proton leak coefficient equal to zero in Equation 8 (P1r = 0) (Figure 4). In this way the general leak activity was decreased by 50%. Decreased leak activity increased Ψm and reduced the sensitivity range of the inner membrane potential to
glu-cose leading to a left-shift in the ATP/ADP ratio and [Ca2+]
c response.
These simulations show that proton leak can modulate GSIS by shifting the depen-dence on glucose of the ATP/ADP ratio and [Ca2+]
c, altering cellular sensitivity to glu-cose challenge. This effect of proton leak is only possible when the ATP/ADP ratio can be regulated by changes in Ψm, i.e. when Ψm lies below the β-cell maximal level for ATP
Figure 4 Effect of increasing glucose at different leak activity. A. [Ca2+]
c; B. Ψm. To simulate the increase
leak activity we magnified the proton leak rate twofold by increasing Plr (Plr = 0.0036 μM ms-1) in Equation 8. As
production. On the other hand, in muscle cells Ψm can be maintained at a high level (see above) and changes in Ψm exert an insignificant effect on the ATP production rate.
This role of uncoupling agents can be illustrated by considering the experimental data for the principal β-cell uncoupling protein 2 (UCP2) (see for review [63,64]. For example, overexpression of UCP2 in normal rat islets diminished the change in mitochondrial membrane potential in response to glucose, reduced cytoplasmic ATP content, GSIS and mitochondrial ROS production [65,66]. β-cells exposed to free fatty acids displayed a lower mitochondrial membrane potential (less electronegative) and a decreased glucose-induced hyperpolarization. These effects were due to increased activity of UCP2 [67]. Conversely, UCP2-deficient mice demonstrated increased ATP production and improved GSIS [66]. In pancreatic islets from wild type but not Ucp2-knockout mice, genipin, a cell-permeant compound that was reported to inhibit UCP2-mediated proton leak, increased the mitochondrial membrane potential and cytosolic ATP, closed KATP channels, and stimulated insulin secretion [68].
Our simulation gave similar results (Figure 4), showing that at a constant glucose level, increased uncoupling protein activity leads to decreases in Ψm, the ATP/ADP ratio and
[Ca2+]
c. However, our simulation also shows a novel aspect of this problem: an ability of uncoupling proteins (and other uncoupling agents) to shift the glucose dependence of the ATP/ADP ratio and [Ca2+]
c. This shifting mechanism is not simply varying the rates of a few processes. In our model, the shifting mechanism is generally characterized by small changes in Ψm, ATP/ADP ratio or [Ca2+]
c at low and high glucose levels. However,
larger changes of [Ca2+]
c can be expected in the region of physiological glucose concen-trations (Figure 4), a hypothesis that needs to be further tested.
The shifting set-point mechanism would regulate insulin secretion particularly during a fluctuating nutrient supply. For example, UCP2 has been shown to be both induced and activated by exposure of rodent islets to high free fatty acids that cause mild uncou-pling [64,67,69,70]. According to our analysis uncouuncou-pling can lead to a right shift in the glucose dependence of the ATP/ADP ratio and [Ca2+]
c. This shift can result in decreased insulin secretion at moderate levels of glucose and at high levels of free fatty acids in blood. It may be a mechanism for restricting glucose consumption under conditions of increased serum fatty acid concentrations, when muscle cells can use free fatty acids as fuel rather than glucose.
Interestingly, this may be a physiologically important mechanism to blunt insulin pro-duction in starved animals even without increasing free fatty acid concentration. During starvation homeostatic mechanisms attempt to maintain a minimal acceptable blood glucose concentration, in part to maintain neurons that cannot use free fatty acids. Star-vation induces UCP2 expression and reduces cellular NADH generation in response to glucose in mouse β-cells that would limit insulin secretion to reduce glucose uptake in muscle and adipose cells [71].
Our analysis supports an important role for uncoupling agents in β-cells that can coor-dinate the appropriate response of β-cells to fluctuating nutrient supply (see for example [24,63]. However, a pathological side effect might also accompany shifting ATP/ADP ratio and [Ca2+]
with this model supports the idea that either an under or over-expression of UCP2 may lead to a failure of β-cells to properly respond to glucose.
Role of Lactate dehydrogenase (LDH) and lactate production
Since β-cells have low levels of LDH (see Introduction) [1,14,15], we included a low level of LDH activity under basal conditions (Appendix). This led to a small lactate flux within the cytoplasm at low and medium glucose levels in our simulations (Figure 2A). How-ever, the simulated lactate production increased significantly in response to high
glu-cose. This can be accounted for by increased [NADH]c/[NAD+]
c (see Equation 3, Appendix).
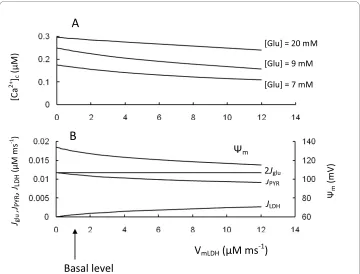
We also simulated a rise in LDH activity (Figure 5). This led to accelerated conversion of pyruvate to lactate, that decreased NADH production in mitochondria from pyruvate and the corresponding [NADH]m, Ψm, ATP/ADP ratio as well as [Ca2+]
c in response to increased glucose. This was all a consequence of the increased fraction of the glycolytic flux that was directed to lactate production.
Our simulations confirm that low levels of LDH expression in insulin-secreting cells are important for the correct channeling of pyruvate towards mitochondrial metabolism (see [1,16]). However, we also found that net lactate production increases significantly when extracellular glucose is increased (see Figures 2 and 5). For this reason, even low LDH activity can be an effective safeguard to prevent mitochondrial overexcitation at high glucose levels, where [Ca2+]
c concentration is already saturated and increased Ψm can lead to increased ROS production (see below).
Figure 5 Model parameters in response to changes of lactate dehydrogenase activity (VLDH). A. [Ca2+]c
at different glucose levels. Low glucose level was 7 mM, medium was 9 mM and high was 20 mM; B. Depen-dence of Ψm, Jpyr and JLDH at a medium glucose concentration ([Glu] = 9 mM). Arrow corresponds to VLDH
Interestingly, overexpression of LDH in single MIN6 β-cells diminished their response to glucose as measured by mitochondrial NAD(P)H, Ψm, cytosolic free ATP and Ca2+
and led to a right shift in the glucose response of insulin secretion [16], all of which are simulated by our model. Since islet levels of LDH were increased in a rat pancreatectomy model of type 2 diabetes [72] and β-cell lines such as INS-1 have increased LDH activity that can partially explain their decreased sensitivity to glucose [14], overexpression of LDH may also be a possible mechanism of β-cell failure in specific cases.
Role of NADH in cytoplasm and shuttle activity
The free cytoplasmic [NAD+]
c/[NADH]c ratio can vary from about 700:1 to 200:1 in rat
liver [73]. Zhang et al. [74] measured free [NAD+]
c/[NADH]c in Cos7 cells and found a ratio of 644. Patterson et al. [47] found that the NAD(P)H concentration (NADH plus NADPH) was much lower in the cytoplasm than in mitochondria in pancreatic islets. Our calculations for the basal [NAD+]
c/[NADH]c ratio level (Figure 2B) yield a
magni-tude of about 750:1 (at a glucose of 9 mM). Generally, our simulated [NAD+]
c/[NADH]c
ratios were in the range of experimentally observed values. As free NAD+ levels greatly exceed those of NADH, large changes in the [NAD+]
c/[NADH]c ratio do not require
cor-respondingly large changes in free [NAD+]
c. Thus, changes in cytoplasmic redox level could be manifested primarily through variation in [NADH]c.
Pyridine nucleotides are not only key molecules for metabolic conversions, but also can serve as critical signaling molecules, such as the cytoplasmic NAD(P)H/NAD(P)+ ratio [2,42,53,75]. Here we have focused only the energetic aspects of pyridine nucle-otides and modeling. Generally, redox shuttles are responsible for maintaining and
restoring cytoplasmic NAD(P)H/NAD(P) + ratios and the cytoplasmic/mitochondrial
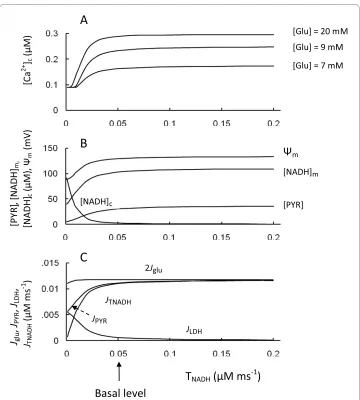
redox state in pancreatic β-cells (see Introduction). NADH generated by glycolysis was efficiently reoxidized by highly active mitochondrial shuttles rather than by lactate dehy-drogenase in basal conditions in our model (flux JTNAD is considerably higher than JLDH in Figure 2A). Steady-state simulation was designed to investigate a role of the redox shut-tles in cytoplasmic and mitochondrial events following a step change in the transport rate coefficient for NADH shuttles at several glucose levels (Figure 6).
The result of this simulation showed that [Ca2+]
c quickly reached saturation with
increased shuttle activity from the basal level. However, a decrease in transport rate coef-ficient (TNADH) resulted in a decrease in ATP/ADP ratio and in [Ca2+]
c from the apparent
threshold (Figure 6A). Failure to activate NADH-NAD+ transport between the cytosol and mitochondria does not significantly alter the mitochondrial [NAD+]
m/[NADH]m
ratio but significantly increases the cytosolic [NADH]c/[NAD+]
c ratio, since [NADH]c
increases quickly with decreased TNADH (Figure 6B). Increasing the [NADH]c/[NAD+] c ratio led to an acceleration of lactate production from pyruvate (Equation 9, Appendix). The corresponding reduction in pyruvate concentration decreased mitochondrial ATP production, leading to a decreased ATP/ADP ratio and decreased [Ca2+]
was considerably decreased from basal conditions. Similar results were obtained in a simulation of the shuttle system in cardiomyocytes [76].
The model simulations on the role of shuttles are also similar to published data. For example, in islets deficient in glycerol-3-phosphate dehydrogenase (GPDH) (which would effectively eliminate the glycerol-phosphate shuttle), when the malate-aspartate shuttle was blocked by inhibiting aspartate aminotransferase by aminooxyacetate, glu-cose-induced increases in cellular ATP content were impaired and insulin secretion was eliminated, whereas the glycolytic flux remained unchanged [19]. However, studies of this mGPDH-/- mouse model also show that neither absence of the glycerol-phosphate shuttle (in mGPDH-/- islets) nor suppression of the malate-aspartate shuttle alone (in wild-type islets) altered ATP synthesis or GSIS [19]. Our simulations (Figure 6) suggest an explanation for these interesting results. Decreased shuttle activity did not lead to a change in [Ca2+]
c, if the TNADH initial value was close to a saturated level, and only
signif-Figure 6 Model parameters in response to changes of the transport rate coefficient for NADH shuttles (TNADH). A: [Ca2+]
c at different glucose levels. B: Ψm, [PYR], [NADH]c and [NADH]m at medium glucose level (9
mM); C: 2 Jglu, JPYR, JLDH and JTNADH at medium glucose level (9 mM). Arrow corresponds to TNADH (Equation 9) for
icant inhibition of shuttle activity, when both shuttles are blocked, resulted in a decrease of [Ca2+]
c, whereas the glucose consumption remained unchanged.
The effects of agents known to increase shuttle activities were also examined. Shuttle agonists increased the average [Ca2+]
c in mouse islets in the presence of 12 mM glucose
[18]. Adenoviral overexpression of the protein Aralarl, a Ca2+ sensitive member of the malate-aspartate shuttle, in both insulin-secreting INS-IE cells and rat pancreatic islets,
enhanced glucose-evoked NAD(P)H autofluorescence, Ψm and insulin secretion.
Glu-cose oxidation was enhanced and lactate production was reduced [77]. These experi-mental results are in reasonably good agreement with the simulated [Ca2+]
c, Ψm and [NADH]m increases and decreased lactate output (JLDH) in Figure 6 when TNADH was
increased from the basal level.
Interestingly, activity and expression of the key enzymes of NADH shuttles were found to be significantly decreased in fetal rat and pig islets compared with adult islets. This can contribute to the inability of fetal β-cells to secrete insulin robustly in response to glucose [78]. Activity of mGPDH, the key enzyme in the glycerol phosphate shuttle, was reduced in islets from patients with type 2 diabetes [79], and it follows that decreased levels of NADH shuttle activity could also be a possible contributor to β-cell secretory failure [27]. Our simulations confirm the possibility that substantial decreases in activity of NADH shuttles can result in secretory failure of β-cells. In this case our model also predicts an increased lactate production rate in β-cells.
Role of mitochondrial Ca2+ handling in β-cells
Calcium signaling is associated with mitochondrial uptake of Ca2+ [10]. Recent islet stud-ies have shown steady state resting mitochondrial [Ca2+]
m levels are relatively low.
Cali-brated resting [Ca2+]
m in rat islets was approximately 250 nM at 3 mM external glucose.
Increasing glucose to 16 mM resulted in a rise of cytoplasmic and mitochondrial [Ca2+] above its resting level [48,50]. The simulated increase of [Ca2+]
m versus glucose concen-tration for steady-state (Figure 2E) was in agreement with these experimental data.
We explored the parameter space with respect to the mitochondrial Na+/Ca2+ anti-porter rate to simulate a change of [Ca2+]
m. We simulated inhibition and activation of the
Na+/Ca2+ exchanger velocity at medium glucose level that resulted in changes in [Ca2+] m
at steady-state (Figure 7). We analyzed several aspects of the possible role of [Ca2+] c in regulating mechanisms comparing of the experimental evidences and our simulations.
1. Mitochondrial Ca2+ as an accelerator of ATP production
Mitochondrial Ca2+controls the key rate-limiting steps in the TCA cycle through activa-tion of pyruvate dehydrogenase and at least two TCA cycle enzymes: isocitrate dehydro-genase and α-ketoglutarate dehydrogenase (reviewed in [80]) and F1F0 ATPase [11]. A control hypothesis emerged from this discovery [81]. According to this hypothesis an increase in glucose concentration is accompanied by a rise in cytoplasmic Ca2+, and the subsequent effect of matrix Ca2+ on the TCA cycle increases the supply of reducing equivalents (NADH, FADH2) leading to a "push" of electrons through the respiratory chain. This accelerates ATP production by generating more proton motive force, leading to increased [NADH]m and stimulating oxidative phosphorylation [9,81].
However, a dominant role of [Ca2+]
m in a control of β-cell oxidative metabolism under
response precedes increased cytoplasmic and mitochondrial Ca2+ in response to a sharp increase in glucose [3,20,21,50]. In addition, respiration rate and insulin secretion can initially follow the glycolytic rate, which is determined by glucokinase activity, rather than by [Ca2+]
m increase (see [10]). For this reason, it was proposed that Ca2+ is more involved in the maintenance rather than in the initiation of glucose metabolism-secre-tion coupling. At high glucose, glycolysis may become sufficiently fast such that pyruvate oxidation becomes rate limiting in the formation of ATP or glucose-derived intermedi-ates [41,52]. Under this limitation, positive regulation of mitochondrial metabolism can require additional Ca2+ activation for the synthesis of ATP and other coupling factors (see [10]).
Because [Ca2+]
m can be regulated by mitochondrial Na+/Ca2+ exchanger activity,
inhi-bition of the Na+/Ca2+ exchanger was suggested as a possible target to increase [Ca2+] m
and thereby improve insulin secretion in type 2 diabetes. An inhibitor of the exchanger
(CGP37157) was shown to prolong mitochondrial Ca2+ signals and increase insulin
secretion [82]. (However, this inhibitor could block plasma membrane Ca2+ channels at high concentrations [83]).
Our model allows an evaluation of the influence of [Ca2+]
m changes on GSIS. The
results of simulations (Figure 7) showed that increasing mitochondrial [Ca2+]
m by
inhib-iting the Na+/Ca2+antiporter did not initially lead to any changes in mitochondrial fluxes
Figure 7 Model parameters in response to changes of the maximal Na+/Ca2+ antiporter rate (V mNc). A: [Ca2+]
c and [Ca2+]m; B: respiration rate (Jhres), phosphorylation rate (Jph), leak (Jhl) and Ψm. Arrow corresponds to
VmNc (Equation 11) for basal level of coefficients (Table 3). Calculations were performed at medium glucose level
or the corresponding increase in the ATP/ADP ratio and [Ca2+]
c at all glucose levels
eval-uated. The initial decrease of [Ca2+]
m due to an increased maximal velocity of Na+/Ca2+
also did not lead to significant changes in the ATP/ADP ratio and [Ca2+]
c (Figure 7). We
found that the reason for such insensitivity to [Ca2+]
m was that [Ca2+]m was above the
threshold for activation of mitochondrial processes even at basal conditions. Our simu-lations showed that the respiration rate and insulin secretion may follow the glycolytic rate at physiological conditions, rather than an increase in [Ca2+]
m (see above).
However, a large decrease in [Ca2+]
m due to a large increase in the maximal velocity of
Na+/Ca2+ exchange led to an inhibition of ATP production and a decreased ATP/ADP ratio and [Ca2+]
c (Figure 7). Our simulations also suggest that an increase in GSIS can be
expected following increased [Ca2+]
m, for example, following inhibition of the Na+/Ca2+
exchanger but only if the initial [Ca2+]
m is so low as to limit mitochondrial reactions. The
effect of [Ca2+]
m on activation of mitochondrial processes in β-cells should therefore be further tested specifically under hyperglycemic and hyperlipidemic conditions.
2. Mitochondrial Ca2+ influx as a suppressor of ATP production
Physiological influx of Ca2+ into the mitochondrion can cause a measurable concurrent mitochondrial depolarization [84]. Ca2+ cycling in mitochondria reflects the uptake of Ca2+ electrogenically coupled to the efflux of Ca2+ in exchange for protons or sodium ions. This effectively results in uncoupling and would be included in proton leak mea-surements (Equation 18, Appendix). A high mitochondrial Ca2+ influx and efflux equiva-lent to an increased proton leak would cause a fall in membrane potential. This would shut down ATP production by the F1F0 ATPase, a process referred to as "short circuiting"
in the several mathematical models for β-cell mitochondria in [29,30,85]. In these mod-els the uptake of Ca2+ by β-cell mitochondria suppressed the rate of production of ATP via oxidative phosphorylation.
However, the conclusion that mitochondrial Ca2+ cycling leads to energy dissipation in the pancreatic β-cell is not supported by experimental data which actually favors the opposite idea, that the primary role of mitochondrial Ca2+ is the stimulation of oxidative phosphorylation [9]. The contribution of Ca2+ cycling to proton leak was estimated to be only about 1% of the state 3 rate [9,86]. Mitochondrial Ca2+ cycling also does not lead to marked energy dissipation in the heart [87]. Recordings in mouse islet cells revealed no effect of the inhibitor of the Na+/Ca2+ exchanger (CGP-37157) on the hyperpolarized Ψ
m
under glucose-stimulated conditions [83] suggesting that mitochondrial Ca2+ cycling likely does not make a major contribution to energy dissipation. Our simulation shows increased ATP production coincidentally with increased [Ca2+]
c does not decrease Ψm
(Figure 2). The contribution of Ca2+ cycling to the fluxes that result in a dissipation of Ψ m
was less than 1% in our model. This is due to low activity of the Ca2+ uniporter and Na+/ Ca2+ exchanger that we have employed to approximate the observed delay between the oscillations [Ca2+]
c and [Ca2+]m in β-cells in vivo (see Appendix). The overestimation of
the role of Ca2+ fluxes in the dissipation of Ψ
m in β-cell models [28-30,85] may have
3. Regulation of cytoplasmic Ca2+ concentration by [Ca2+] m
The role of mitochondrial Ca2+ handling in the regulation of cytoplasmic Ca2+ concen-tration has been emphasized in several cell types [9]. Mitochondria are an important storage component for Ca2+ handling in cardiomyocytes, where fast and large cytoplas-mic Ca2+ changes define cardiac excitation-contraction coupling [87,88]. However, an estimation of the subcellular compartmental volumes of cardiomyocytes gave 58.5% cytosolic and 36% mitochondrial volumes, respectively [89]. On the other hand, β-cell mitochondrial volumes ranged from only 4% to 8% per cell [90,91]. This greatly limits the degree to which mitochondria can regulate cytoplasmic Ca2+ concentration in β -cells.
Ca2+ influx through L-type Ca2+ channels and efflux through plasma membrane
pumps, along with endoplasmic reticulum (ER) stores are the principal regulators of β -cell cytoplasmic Ca2+ homeostasis [4,5,10,92,93]. A robust mitochondrial Ca2+ pool was not a necessary component of our previous model examining regulation of cytoplasmic Ca2+ homeostasis (see [5,26]). The mitochondrial Ca2+ pool is significantly smaller com-pared with the ER free Ca2+ pool, because the ER volume can be up to 20% of total β-cell volume [90] and its free Ca2+ concentration can reach several hundred mM (see Refs. [4,5,92]). Given the smaller mitochondrial volume, our simulations did not show signifi-cant Ca2+ fluxes between cytoplasm and mitochondria (see above). This raises the ques-tion as to whether β-cell mitochondrial Ca2+ handling can play a significant role in the regulation of β-cell [Ca2+]
c under physiological conditions.
Variations in mitochondria operation rates and content
Reduction in mitochondrial metabolism and/or cellular content (number or volume) can in principle underlie progression to the decreased insulin secretion typical of Type 2 dia-betes [35,37,94]. For this reason, we employed our model to simulate the effect of changes in mitochondrial functional activity and/or content.
1. Suppression of respiratory activity
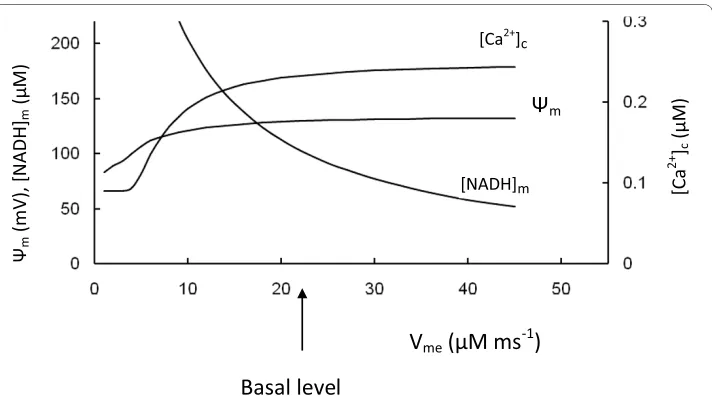
We varied the maximal rate of ETC proton pumping (Vme) (Equation 5, Appendix) to
simulate of the results of experiments where the electron transport chain activity was decreased (Figure 8). As expected, this simulation showed an increased [NADH]m with decreased Vme, however, Ψm, ATP production, respiration rate, ATP/ADP ratio and
[Ca2+]
c were also decreased. The glucokinase reaction rate was not changed because the
rate of pyruvate reduction by LDH was increased as a consequence of increased [Pyr]. This was due to increased [Pyr] and the part of glycolytic substrate that was not used for ATP synthesis was removed by increased lactate production (not shown).
These simulations correspond to data [95-97] obtained following inhibition of tran-scription of mitochondrial DNA by ethidium bromide (EtBr), leading to a reduced expression of the mitochondrial electron transport system. After EtBr treatment (in the INS-1 β-cell line), Ψmfailed to hyperpolarize in response to glucose and ATP production and insulin secretion were significantly decreased [97]. Noda et al. [96] found EtBr caused increased NADH accumulation and lactate production in β HC9 cells, along with decreased [Ca2+]
c and ATP/ADP ratio. In contrast, glucose utilization was only
2. Suppression of F1F0 ATPase activity
We varied also the maximal F1F0 ATPase activity (Vmph) (Appendix, Equation 7) to simu-late of the results of experiments where this activity was changed. Suppression of F1F0 ATPase activity resulted in decreased of ATP synthesis in mitochondria. This decreased
[ATP]c and increased [ADP]c leading to a decreased ATP/ADP ratio and decreased
[Ca2+]
c (Figure 9). Decreased proton flux rates through the F1F0 ATPase led to an
increase in Ψm. According to Equation 5C an increase in Ψm decreases ETC activity. This decreased [NADH]m consumption lead to decreased respiration rate (measured as O2 consumption) (simulations not shown) and insignificant [NADH]m accumulation. Inter-estingly, here as well as in first case, the rate of glucokinase reaction was not changed
Figure 8 Model parameters in response to changes of the maximal rate of proton pumping in ETC (Vme). [Ca2+]c, Ψm and mitochondrial NADH concentration were calculated for medium glucose level (9 mM).
Arrow corresponds to the basal Vme (Table 3).
Figure 9 Model parameters in response to changes of the maximal rate of proton flux in F1F0 ATPase (Vmph). [Ca2+]c, Ψm, [ATP]c/[ADP]c and mitochondrial NADH concentration were calculated for medium glucose
because the NADH not utilized for ATP production was expended on increased leak due to increased Ψm (not shown).
These simulations correspond to the data obtained on BHE/cdb rats, which have a mutation in ATP synthase that limits ATP production and leads to development of mild diabetes [98,99]. BHE/cdb rat islets showed reduced responsiveness to glucose stimula-tion and ATP content was lower than in control islets [99]. The authors suggested that Ψm is increased in BHE/cdb rat islets due to increased oxygen radical formation [99]. GSIS was reduced, but could not be attributed to changes in glucokinase activity or islet glucose uptake [100].
3. Changes in mitochondria activity or content
To simulate changes in mitochondrial activity or content we varied the mitochondrial volume and corresponding maximum rate of the mitochondrial reaction fluxes in the model (Figure 10). The simulation showed that decreased maximal rates of all intramito-chondrial processes from the basal level, corresponding to decreased mitointramito-chondrial
Figure 10 Steady-state simulations of parameters in response to changes of mitochondria content. We simultaneously changed all maximal rates of mitochondrial processes (JPYR, Jhres, Jph, Jhl, jTNADH, Juni, JNCa)- The arrow corresponds to the basal maximal rates and mitochondrial volume from Tables 2 and 3 (shown on axis as 1). A: [Ca2+]
c at different glucose levels. B: Ψm, [PYR], [NADH]c and [ATP]c/[ADP]c at medium glucose level (9
activity or content per cell volume, resulted in increased pyruvate and [NADH]m
concen-trations, coincidentally with a decreased Ψm, ATP/ADP ratio and [Ca2+]c (Figure 10A,B). The glucose consumption rate decreased moderately since the increase in [PYR] led to an increase in lactate production (Figure 10C) that together with a decreased rate of pyruvate decarboxylation in mitochondria led to an insignificant change in glycolytic flux.
These model simulations for decreased mitochondrial activity or content are in accor-dance with experimental data. For example, a pancreatic β-cell mouse model for mito-chondrial diabetes induced by tissue-specific disruption of the nuclear gene encoding the mitochondrial transcription factor A (Tfam) displayed severe mtDNA depletion, deficient oxidative phosphorylation and abnormally enlarged islet mitochondria [101]. Tfam is essential for mtDNA expression and maintenance, β-cell stimulus-secretion cou-pling in isolated islets from tfam -/- mice showed reduced hyperpolarization of the
mito-chondrial membrane potential, impaired Ca2+-signaling and lowered GSIS [101].
Similarly, β-cell specific disruption of Tfam led to 50% reduction in mRNA levels for the
mitochondrially encoded nd1 gene, a subunit of the NADH dehydrogenase comprising
complex I of the mitochondrial respiratory chain. As a consequence, total cellular ATP concentration was drastically decreased by 75%, and glucose failed to augment cytosolic ATP, explaining the blunted GSIS [102].
Simulation of increased mitochondrial content above basal levels leads to an initial increase in [Ca2+]
c at the tested glucose levels. This initial increase of [Ca2+]c is due to
increased ATP production (and an increase in ATP/ADP ratio) as a result of decreased lactate production (see Figure 10C). Interestingly, our simulation shows decreased [Ca2+]
c following increased mitochondrial content, due to decreased ATP production (with decreased ATP/ADP ratio) at low and medium glucose levels. This is a result of increased total leak activity that occurs in the model as a consequence of increased mito-chondrial content. According to the simulation, lactate production was higher and rela-tive leak was lower (compared with electron transport rate) in basal conditions at high glucose content. For this reason [Ca2+]
c did not decrease with increased mitochondrial activity or content at high glucose level ([Glu] = 20 mM) (Figure 10A).
While our simulations support the obvious result that a decrease in mitochondrial function (or content) leads to decreased ATP production, ATP/ADP ratio and [Ca2+]
c response to glucose, together giving decreased glucose sensitivity (Figure 8, 9, 10), the simulations also show that subtle variation in mitochondrial function or content could underlie β-cell defects in type 2 diabetes (see [10,37,103]. On the other hand, increased mitochondrial content can, in theory, initially increase β-cell sensitivity to glucose (Fig-ure 10) especially if their initial content was decreased in comparison with basal levels. This supports the idea that an increase in mitochondrial content can be a possible target for treatment of type 2 diabetes.
Oscillation processes
Oscillations in cytoplasmic and mitochondrial metabolism, membrane potential,
intrac-ellular and mitochondrial Ca2+ due to increased glucose concentrations has been
described as a specific characteristic of glucose signaling in the β-cell [3,20-22,104]. The source of these oscillations and the mechanism of orchestration are not clearly under-stood and may reflect multiple processes [5,23,26,105]. Particularly, [Ca2+]
can be the driving force for other oscillations in pancreatic β-cells (see [26,106]). For this reason, the aim of this section is testing the hypothesis that independent [Ca2+]
c
oscilla-tions can create coupled oscillaoscilla-tions in metabolic processes.
We previously developed a mathematical model describing β-cell ion regulation that shows how [Ca2+]
c oscillations can be independently established from mitochondrial
processes when the ATP/ADP ratio achieved some threshold leading to initial depolar-ization of the plasma membrane [5]. However, for ease of use here we employed a simpli-fied mathematical model that created a periodically varied [Ca2+]
c in the cytoplasm
(Equations 24-30, Appendix) (Figure 11A). Using this simpler model we simulated the characteristic shape of slow [Ca2+]
c oscillations (with a period of one minute and longer),
where [Ca2+]
c increased sharply and the quiescent time was longer than the period with
increased [Ca2+]
c (the experimental examples of such oscillations in β-cells are shown
Figure 11 Model-predicted dynamic responses of parameters in pancreatic β-cells for independent [Ca2+]
c oscillations at 9 mM glucose concentration. A: independent [Ca2+]c oscillations (Appendix) and
sim-ulated [Ca2+]
m transient in response to [Ca2+]c oscillations; B: Ψm, [ADP]c and [NADH]m; C: glucose consumption
(Jglu, Equation 1) and oxygen consumption (JO2, Equation 6). All other parameters set points were taken for
bas-al conditions (Tables 2 and 3). Variations in the oxidative phosphorylation rate (as Jph) were determined in our model mainly by the [ADP]c changes (Equation 7) and this rate increased with [ADP]c increase following [Ca2+]c
[5,23,106]). Our model simulated the corresponding changes in several β-cell mitochon-drial and metabolic processes (Figure 11). This simulation showed that the metabolic and membrane variables in the cytoplasm and mitochondrial matrix can display oscilla-tory behavior when [Ca2+]
c oscillated independently.
A mechanism involving periodic nucleotide concentrations links [Ca2+]
c changes to
activation of metabolic oscillations. Each [Ca2+]
c increase during oscillations leads to
increased cytoplasmic ATP consumption (Equation 20, Appendix). This decreases [ATP]c and increases [ADP]c (Figure 11B) leading to a decreased ATP/ADP ratio. This resulted in an amplification of ATP synthesis by the mitochondrial F1F0 ATPase (Equa-tion 7A). Increasing the rate of proton flux through F1F0 ATPase led to a decrease in Ψm
(Figure 11B). According to Equation 5C (Appendix) a decrease in Ψm increases ETC
activity. This enhanced [NADH]m consumption and the respiration rate, measured as O2
consumption. For this reason, the electron transport and respiration rates were substan-tially in phase with [Ca2+]
c oscillations (Figure 11C). The oscillations in the glucose con-sumption rate determined by glucokinase (Equation 1, Appendix), that follows the [ATP]c changes, were out of phase with [Ca2+]
c oscillations (Figure 11C).
The experimental data are in accordance with our model simulations. For example, increased [Ca2+]
c in MIN6 cells at constant glucose levels caused a fall in the ATP/ADP ratio as inferred from an experiment tracking luciferase-generated photons in trans-fected cells expressing luciferase [13]. Glucose-induced NAD(P)H and [Ca2+]
c slow oscil-lations were measured simultaneously in mouse pancreatic islets, revealing that NAD(P)H oscillations were small and preceded those of calcium by about 0.1 of a period [21]. In our model the mitochondrial NADH peak concentrations also slightly preceded [Ca2+]
c periodic maxima (see Figures 11A,B). The delay (about 9 sec) was about 0.1 of a
period of simulated [Ca2+]
c oscillations.
Glucose-induced [Ca2+]
c and Ψm slow oscillations have been reported [20-22,104], and measured simultaneously in mouse pancreatic islets [20]. The results (Figure 4 from Ref. [20]) were similar to the dependence that we calculated (Figures 11A,B).
Oscillations in islet oxygen and glucose consumption have also been recorded [95,107]. The glucose consumption rate was out of phase with slow [Ca2+] oscillations, and oxygen consumption rate and [Ca2+]
c changes were approximately in phase. The mechanism of
this phenomenon is as yet unknown. However, these data are in accord with our model simulation (Figure 11A,C) and could be explained by decreased ATP and increased free ADP concentrations with increased [Ca2+]
c during the appropriate phase of slow
oscilla-tions.
Mechanisms other than [ADP]c changes can cause variations in [Ca2+]
m. Because the
changes of Ψm were modest while [Ca2+]
c varied with significant amplitude during
oscil-lations, an influx of Ca2+ into mitochondria is determined mainly by a change in [Ca2+] c
while Ca2+ efflux depended predominantly on [Ca2+]
m changes in our model. This led to
some delay in [Ca2+]
m oscillations in comparison with [Ca2+]c (14 sec in Figure 11A). The
value of this delay was used here to determine maximal rates of Ca2+ fluxes (P
These results of simulations were consistent with observations demonstrating that oscillations in mitochondrial Ca2+ were in response to glucose elevations, presumably tracking oscillations in [Ca2+]
c [50,82,108,109]. Periodic oscillations in [Ca2+]m followed
[Ca2+]
c oscillations with a delay of approximately 14 sec [50,109]. A similar delay between
the maxima of [Ca2+]
c and [Ca2+]m (14 sec) was simulated in Figure 11A.
From these results, our simulations at least partially confirm a possible cycle of events previously suggested whereby increased [Ca2+]
c during oscillations results in a decrease in ATP/ADP ratio due to increased ATP consumption [13,50]. In the next phase, when [Ca2+]
cdecreases, ATP production outweighs ATP consumption leading to an increasing ATP/ADP ratio. However, this pathway is unlikely to be a possible pacemaker mecha-nism for [Ca2+]
c oscillations as has been proposed [13,50]). Rather this could serve as a mechanism where cyclic changes in ATP/ADP ratio are determined by independent cytoplasmic Ca2+ oscillations.
Oscillations in Ψm and mitochondrial NADH are usually small in amplitude in
pancre-atic β-cells [20-22,104]. Mitochondrial Ca2+ oscillations, on the other hand, are reason-ably large.
However, they have a typical dynamic that is intrinsic to two successive components where [Ca2+]
m follows [Ca2+]c with a particular delay (see above). Our dynamic
simula-tions also clearly show that the independent [Ca2+]
c oscillations lead to simulation of
[Ca2+]
m, Ψm, mitochondrial NADH and respiration oscillations that were similar to
experimental observations. These experimental data and our simulations suggest that independent [Ca2+]
c oscillations can be a pacemaker in the generation of oscillations of
mitochondrial and cytoplasmic parameters in β-cells.
Regulation of ROS content in β-cells
In most cells mitochondria represent the main source of the physiological production of reactive oxygen species (ROS), which may be a byproduct of ETC function [9,110], while recent evidence suggests that NADPH oxidase-dependent generation of ROS in pancre-atic β-cells [111] and ROS generation from sulfhydryl formation in proinsulin biosynthe-sis [112] are also potentially important potential sources of ROS generation.
ROS production in mitochondria depends upon the redox state of the ETC complexes, since the ETC carriers in a reduced state have the property of donating electrons to oxy-gen [110]. The redox state of the ETC complexes and, consequently, the rate of superox-ide production also highly depend on Ψm. The increased Ψm (above about 160 mV)
decreases electron transport capability leading to a reduced state of the carriers and sharply increases ROS production [110,113]. A pronounced increase in Ψm also aug-mented ROS production in pancreatic β-cells [36,70].
![Figure 2 Effect of increasing glucose on cell energetics[G3P] is the cytoplasmic glyceraldehydes 3-phosphate concentration; C: Jhres is the rate of proton pumping through ETC, genase; B: [NADH]is the mitochondrial membrane potential, [ATP]are the concentra](https://thumb-us.123doks.com/thumbv2/123dok_us/332392.1525699/7.595.117.478.91.615/increasing-energetics-cytoplasmic-glyceraldehydes-concentration-mitochondrial-potential-concentra.webp)