RESEARCH
A Bayesian inference method for the
analysis of transcriptional regulatory networks
in metagenomic data
Elizabeth T. Hobbs
†, Talmo Pereira
†, Patrick K. O’Neill and Ivan Erill
*Abstract
Background: Metagenomics enables the analysis of bacterial population composition and the study of emergent population features, such as shared metabolic pathways. Recently, we have shown that metagenomics datasets can be leveraged to characterize population-wide transcriptional regulatory networks, or meta-regulons, providing insights into how bacterial populations respond collectively to specific triggers. Here we formalize a Bayesian infer-ence framework to analyze the composition of transcriptional regulatory networks in metagenomes by determining the probability of regulation of orthologous gene sequences. We assess the performance of this approach on syn-thetic datasets and we validate it by analyzing the copper-homeostasis network of Firmicutes species in the human gut microbiome.
Results: Assessment on synthetic datasets shows that our method provides a robust and interpretable metric for assessing putative regulation by a transcription factor on sets of promoter sequences mapping to an orthologous gene cluster. The inference framework integrates the regulatory contribution of secondary sites and can discern false positives arising from multiple instances of a clonal sequence. Posterior probabilities for orthologous gene clusters decline sharply when less than 20 % of mapped promoters have binding sites, but we introduce a sensitivity adjust-ment procedure to speed up computation that enhances regulation assessadjust-ment in heterogeneous ortholog clusters. Analysis of the copper-homeostasis regulon governed by CsoR in the human gut microbiome Firmicutes reveals that CsoR controls itself and copper-translocating P-type ATPases, but not CopZ-type copper chaperones. Our analysis also indicates that CsoR frequently targets promoters with dual CsoR-binding sites, suggesting that it exploits higher-order binding conformations to fine-tune its activity.
Conclusions: We introduce and validate a method for the analysis of transcriptional regulatory networks from metagenomic data that enables inference of meta-regulons in a systematic and interpretable way. Validation of this method on the CsoR meta-regulon of gut microbiome Firmicutes illustrates the usefulness of the approach, revealing novel properties of the copper-homeostasis network in poorly characterized bacterial species and putting forward evidence of new mechanisms of DNA binding for this transcriptional regulator. Our approach will enable the compar-ative analysis of regulatory networks across metagenomes, yielding novel insights into the evolution of transcriptional regulatory networks.
Keywords: Transcription factor, Regulatory network, Regulon, Metagenomics, Bayesian inference, Copper homeostasis, Metal resistance, Stress response, CsoR
© 2016 The Author(s). This article is distributed under the terms of the Creative Commons Attribution 4.0 International License (http://creativecommons.org/licenses/by/4.0/), which permits unrestricted use, distribution, and reproduction in any medium, provided you give appropriate credit to the original author(s) and the source, provide a link to the Creative Commons license, and indicate if changes were made. The Creative Commons Public Domain Dedication waiver (http://creativecommons.org/ publicdomain/zero/1.0/) applies to the data made available in this article, unless otherwise stated.
Open Access
*Correspondence: erill@umbc.edu
†Elizabeth T. Hobbs and Talmo Pereira contributed equally to this work
and should be considered co-first authors
Background
The advent of next-generation sequencing methodologies has enabled the study of bacterial populations through direct sampling of their genetic material [1]. Metagenom-ics techniques allow the detailed investigation of bacterial communities, their shared metabolic pathways and their interaction with environment and hosts [2–7], but they also pose many challenges regarding data standardization, processing and analysis [8, 9]. To date, most analyses of metagenomics datasets have focused on the phylogenetic composition of metagenomes and the relative contribu-tion of different bacterial clades to metabolic pathways [3, 9–12]. However, metagenomics data also constitute a powerful resource for the direct analysis of transcrip-tional regulatory networks, or regulons, in natural envi-ronments. Such analyses can be used to characterize the contribution of non-culturable bacteria and mobile genetic elements to global regulatory networks, to analyze the changes in a population’s regulatory program in response to interventions or habitat adaptation, and to quantify the relative importance of genetic elements in the makeup of known regulatory systems. Comparative research on mul-tiple metagenomes has revealed that regulatory potential, measured as the local density of putative transcription fac-tor (TF)-binding sites, correlates with processes involved in the response to stimuli present in specific environments [13, 14]. Recently, we provided proof of concept that TF-binding motifs can be effectively leveraged to analyze the genetic makeup of known transcriptional regulatory net-works using metagenomic data, providing insights into the function of such networks in specific microbiomes [15]. In this work we formalize an inference method to ana-lyze transcriptional regulatory networks in metagenomics datasets. The Bayesian inference approach we put forward provides a consistent framework for the study of regula-tory networks using metagenomics datasets, facilitating the interpretation of results, standardizing the outcome of analyses to facilitate comparison and allowing users to selectively adjust sensitivity. We validate the novel infer-ence framework on the Integrated Referinfer-ence Catalog of the Human Gut Microbiome [16], analyzing the regula-tion of copper-homeostasis in gut microbiome Firmicutes through the recently characterized copper-responsive repressor CsoR [17]. Our results reveal an inferred cop-per-homeostasis network congruent with that reported in studies on model organisms, outlining the core elements of this regulatory system and highlighting specific features of the human gut CsoR meta-regulon.
Methods Datasets
Human gut metagenomics data was obtained from the Integrated Reference Catalog of the Human Gut
Microbiome service (http://meta.genomics.cn/) [16]. The dataset contains 1267 gut metagenomes, totaling 6.4 Tb. To ensure consistency, here we restricted the analysis to 401 samples from healthy European individuals obtained in the MetaHIT project. This subset contains 5,133,816 predicted genes, with roughly half of them (2,579,737) functionally annotated with eggNOG/COG identifi-ers from the eggNOG v4.0 database [18]. The bacterial population in these 401 samples is dominated by two bacterial orders [Bacteroidales (58.51 %) and Clostridi-ales (32.11 %)] belonging to two major bacterial phyla [Bacteroidetes (59.29 %) and Firmicutes (34.97%)]. A CsoR-binding motif was compiled by combining exper-imentally-validated and computationally inferred Fir-micutes CsoR-binding sites available in the CollecTF and RegPrecise databases [19, 20].
Data processing
For each sample and scafftig therein, predicted open-reading frames (ORF) in the same strand and with a con-servative intergenic distance (<50 bp) were considered to constitute an operon. Only operons with a complete lead ORF (containing a predicted translational start codon on their 5′ end) and at least 60 bp of sequence upstream of the translational start codon were considered for analy-sis. We also excluded from analysis any operons with no gene product mapping to a Firmicutes reference genome [15]. Taxonomical and eggNOG information for all ORFs in the remaining 752,783 operons was re-annotated by searching the eggNOG v4.0 database with DIAMOND [21]. The available upstream region (up to 300 bp) for these operons was scored on both strands with the posi-tion-specific scoring matrix (PSSM) derived from the compiled CsoR-binding motif using a Laplacian pseu-docount and equiprobable background base frequencies [22]. For every sequence position, the scores from both strands were combined following the soft-max function (Additional file 1):
where PSSM(Si) denotes the combined PSSM score of a site at position i and PSSM(Sif) and PSSM(Sir) denote the score of the site at position i in the forward and reverse strands, respectively.
Inference method
For a given eggNOG/COG functional identifier, we con-sider the set of promoters (D) from all operons contain-ing at least one gene mappcontain-ing to that eggNOG/COG. We define two theoretical distributions for the set of posi-tional PSSM scores in promoters associated with a par-ticular eggNOG/COG identifier. If the eggNOG/COG
(1)
PSSM(Si)=log2
2PSSM(Sfi)+2PSSM(Sri)
is not regulated by the TF, we expect that the promoters mapping to it display a background distribution of scores (B), which we can approximate by a normal distribution parametrized by the statistics of the set of all promoters in the metagenome (G):
Conversely, for an eggNOG/COG regulated by the TF, the distribution of PSSM scores (R) in promoters should be a mixture of the background distribution and the dis-tribution of scores in functional sites. Again, we can approximate the distribution of scores in functional sites with a normal distribution parametrized by the statistics of the known sites belonging to the TF-binding motif (M).
The mixing parameter α corresponds to the probability of observing a functional binding site in a regulated pro-moter, which can be estimated from known instances of TF-binding sites in their genomic context. For CsoR, we expect on average one binding site in a regulated pro-moter of length 300 bp, so α is defined to be 1/300 [23, 24].
Given a promoter Di from the set of promoters (D) mapping to a particular eggNOG/COG identifier, we seek to obtain the probability that the eggNOG/COG is regulated by the TF. Formally, we seek to obtain the pos-terior probability of the mixture distribution of scores (R) given the scores sj observed in the promoter mapping to the eggNOG/COG (Di):
After applying the law of total probability, we can express this more conveniently in a likelihood ratio form:
The likelihood functions P(Di|R) and P(Di|B) can be estimated for a given score sj using the density function of the R and B distributions defined above. If we assume approximate independence among the scores at different positions, we obtain:
and
(2) B∼N(µg,σg2)
(3)
R∼αN(µm,σm2)+(1−α)N(µg,σg2)
(4)
P(R|Di)=
P(Di|R)P(R)
P(Di)
(5)
P(R|Di)=
P(Di|R)P(R)
P(Di|R)P(R)+P(Di|B)P(B)
=
1
1+ P(Di|B)P(B) P(Di|R)P(R)
(6) P(Di|R)=
sj∈Di
Lsj|αN(µm,σm2)+(1−α)N(µg,σg2)
The priors P(R) and P(B) can be inferred from genomic data. P(R) and P(B) can be approximated by the fraction of annotated operons in a genome that are known and not known, respectively, to be regulated by the TF. Using
B. subtilis as a reference genome for CsoR, we obtain
P(R) = 3/1811 and P(B) = 1 −P(R).
The contributions of all promoters Di mapping to a par-ticular eggNOG/COG can be assumed to be independ-ent. Therefore, we obtain:
where we can naturally assign a likelihood ratio product of 1 to any eggNOG/COGs that presents no mapped pro-moters in the samples under analysis.
Sensitivity adjustment and determination of putatively regulated eggNOG/COGs
The large size of metagenomics datasets poses challenges for the efficient computation of the posterior probabili-ties outlined above. It is known that a large fraction of the eggNOG/COG identifiers will not be regulated by the TF. The computation may therefore be simplified by defin-ing a score threshold to exclude operons with promoters that show no evidence of regulation [15]. This strategy has the added benefit of compensating for heterogeneity in eggNOG/COG clustering, which may assign distant orthologs to the same eggNOG/COG identifier, poten-tially diluting the contribution of a regulated ortholog to the eggNOG/COG posterior probability.
Formally, we consider the subset of the promoters
D*⊂ D mapping to a particular eggNOG/COG that have at least one score above a predefined threshold θ. That is,
Di∈ D* if max(sj∈ Di) ≥ θ. It follows that we should adjust the score likelihoods of Eqs. 6 and 7 to take into account the fraction of probability mass assigned to the data that will not be observed in the reduced promoter set D*. The probability of observing a promoter Di with no positions
pj scoring above the threshold θ under the background (B) and regulated (R) models is given by the cumulative distribution function (Φ) for each model:
(7)
P(Di|B)=
sj∈D
Lsj|N(µg,σg2)
(8)
P(R|D)= 1
1+
Di∈D P(Di|B) P(Di|R)
P(B) P(R)
(9)
UB=
pj∈Di
�(θ,µg,σg2)
(10) UR=
pj∈Di
Hence, the probability of observing a promoter with at least one score above the threshold θ under the back-ground (B) and regulated (R) models is given by (1 −UB) and (1 −UR), respectively. We can use these probabilities to normalize the likelihoods as follows:
Similarly, the priors P(R) and P(B) must be renormal-ized by multiplying the observed number of regulated and non-regulated operons in a reference genome by (1 − UB) and (1 − UR), respectively, in order to account for the fact that thresholding alters the base rate at which regulated promoters are observed.
The inference method outlined above assigns a poste-rior probability value P(D|R) to all eggNOG/COG iden-tifiers present in the metagenome. Ultimately, however, we wish to extract a set of putatively regulated eggNOG/ COG for further analysis. This requires discretization of the list of posterior probabilities. Formally, given a list of eggNOG/COGs S with posterior probabilities p, we wish to find a sublist S* with posterior probabilities p�∗, so that
the mean probability of regulation for a promoter chosen uniformly at random from S* is at least (1−φ). To define
S*, let p be sorted in reverse order and S be sorted simi-larly. Then let n be the greatest integer such that:
and set S* = {S
0,…,Sn}. S* is therefore the largest sublist of
S having average posterior probability of at least (1−φ). Permutation test
Several alternative methods can be proposed to deter-mine putatively regulated eggNOG/COGs in a metagen-omic dataset. To benchmark the Bayesian framework introduced above against a frequentist approach, we define a permutation test based on the likelihood func-tion P(Di|R) of Eq. 6. Given the original TF-binding motif defined by the collection of TF-binding sites, we gener-ate F random symmetrical permutations of the TF-bind-ing motif and parametrize their score distribution under the background (Bf) and regulated (Rf) models following Eqs. 2 and 3. Hence, for each permuted model f, we can compute the likelihood of the score distribution observed in a given promoter (Di) as:
(11)
P(Di|R)=
sj∈DiL
sj|αN(µm,σ2
m)+(1−α)N(µg,σ2 g)
(1−UR)
(12)
P(Di|B)=
sj∈DiL
sj|N(µg,σg2)
(1−UB)
(13) 1
n
n
i=0
pi≤(1−φ)
Under the approximation of independence between promoter sequences used in Eq. 8, we can define P(D|R)
for an eggNOG/COG as follows:
For each eggNOG/COG, we then can empirically approximate the p-value as the probability of obtaining a score distribution as extreme as the one observed in the promoters mapping to an eggNOG/COG given the null hypothesis that the distribution of scores is due to chance:
where I(·) is the indicator function.
The permutation test therefore defines an alternative statistic to assess putative regulation of an eggNOG/ COG based on the distribution of scores in the promot-ers mapping to it.
Results
Validation of the Bayesian inference pipeline on synthetic datasets
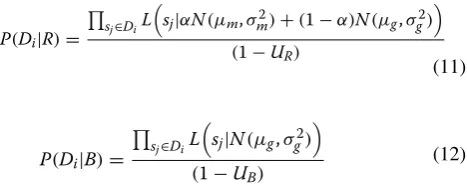
To assess the behavior of the proposed inference framework, we evaluated its performance on synthetic datasets consisting of randomly generated sequence backgrounds with inserted sites sampled from the CsoR motif. Figure 1a shows the posterior probability P(R|D)
of individual sequences (Eq. 5) as a function of the score of the inserted CsoR sites. The observed upward devia-tions from the baseline sigmoidal shape illustrate the ability of the inference method to integrate contributions from secondary sites, which occur at a low frequency in randomly generated sequences. Figure 1b compares the behavior of the posterior probability for an eggNOG/
COG (Eq. 8) between a simulated eggNOG/COG in
which sequences contain sites randomly sampled from the CsoR motif distribution and an eggNOG/COG in which the sequences containing sites are clonal. Multiple instances of a clonal sequence containing a putative TF-binding site are often found in metagenome samples. On average, the method assigns lower posterior probabilities to clonal sequences, hence decreasing the likelihood of designating the corresponding eggNOG/COG as puta-tively regulated.
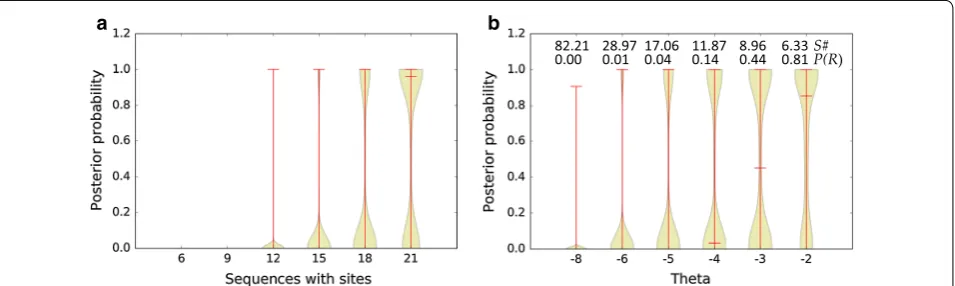
Figure 2a documents the behavior of the eggNOG/ COG posterior probability (Eq. 8) as a function of the
(14)
P(Di|Rf)=
sj∈Di
Lsj|αN(µmf,σ 2
mf)+(1−α)N(µgf,σ
2
gf)
(15) P(D|Rf)=
Di∈D
P(Di|Rf)
(16)
p=PP(D|Rf)≥P(D|R)
≈
1+F
f=1I
P(D|Rf)≥P(D|R)
number of sequences with functional sites mapping to the eggNOG/COG. The results show that when the pro-portion of sequences containing functional sites among those mapping to an eggNOG/COG falls below 20 %, the posterior probability decreases sharply. Figure 2b illustrates the effect of introducing the sensitivity adjust-ment outlined in Eqs. 11 and 12. In addition to speed-ing up the computation, the use of a score threshold θ to exclude sequences with no evidence of regulation makes
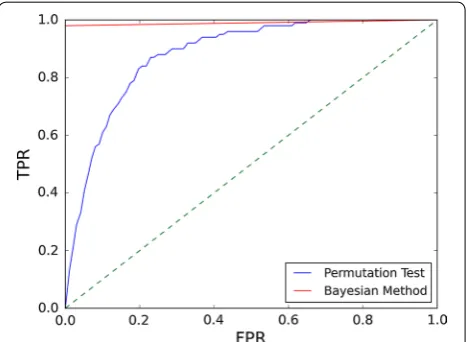
it possible to obtain high posterior probability values for eggNOG/COGs with less than 20 % sequences con-taining functional sites. This allows detecting putative regulation in heterogeneous eggNOG/COGs where the regulated ortholog is a minority contributor. In Fig. 3, the performance of the Bayesian framework is benchmarked against a permutation test with F = 100 on a synthetic dataset of 10,000 COGs. As it can be readily observed, the posterior probability generated by the Bayesian
0 0.2 0.4 0.6 0.8 1
-10 0 10 20 30
Sequence posterior probabilit
y
Score of inserted site
-0.4 -0.2 0 0.2 0.4 0.6 0.8 1 1.2 1.4
Posterior probabilit
y
Replicate Mulple sites Single site
a b
Fig. 1 a Posterior probability of a 300 bp-long randomly generated sequence (40 % G + C) as a function of the score of a sampled CsoR site inserted at the first position of the sequence. The plot shows the results of 10,000 independent replicates. b Average posterior probability of a simulated eggNOG/COG. The eggNOG/COG contains 100 (300 bp-long, 40 % G + C) sequences, 30 of which contain inserted sites. Sites were either sampled randomly from the CsoR motif and inserted the first 30 sequences (multiple sites) or a single site was sampled from the motif and inserted in the first 30 sequences (single site). The plot shows the results of 10 independent experiments for each case. Vertical bars denote the standard deviation
82.21 28.97 17.06 11.87 8.96 6.33 S#
0.00 0.01 0.04 0.14 0.44 0.81 P(R)
a b
framework yields a significantly more robust predictor of eggNOG/COG regulation [Area under the curve (AUC): 0.99] than a conventional permutation test p-value (AUC: 0.88).
Analysis of the copper‑homeostasis CsoR regulon in the human gut microbiome
To evaluate the proposed inference method in a real life setting, we analyzed the copper-homeostasis regu-lon controlled by CsoR in the human gut microbiome. Together with CopY and CueR, CsoR-family members are well-characterized copper-responsive regulators that detect and modulate the abundance of copper ions in the cell [25]. CsoR provides a suitable target for analysis, because it is presumed to be the sole regulator of cop-per homeostasis in Clostridiales, the second most abun-dant bacterial order in the IGC MetaHIT project dataset, while being noticeably absent in the most abundant order (Bacteroidales) [17, 26]. We analyzed the CsoR regulon by running the Bayesian inference pipeline on operons containing genes mapping to the Firmicutes. Computa-tion was sped up by adjusting sensitivity with θ = 6.65 (6 standard deviations below the CsoR motif mean). This substantially decreased the number of processed promot-ers while increasing the prior for regulation P(R) only to 0.01 (Fig. 2). We established a mean probability of regu-lation of 0.9 for the set of putatively regulated eggNOG/
COGs and required that they had at least 5 promoters mapping to them at the established θ value.
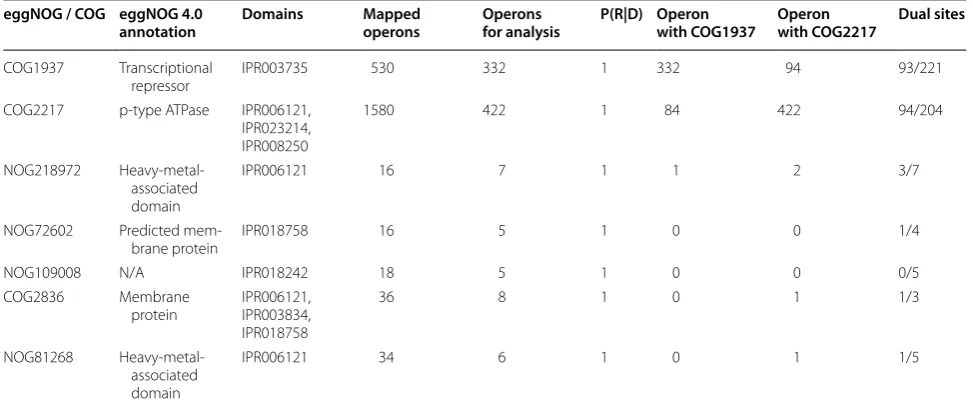
The results shown in Table 1 provide an outline of the Firmicutes CsoR meta-regulon of the human gut micro-biome. The inferred CsoR meta-regulon is in broad agree-ment with the reported CsoR regulons in Firmicutes [23, 24, 27, 28], but displays also several characteristic features that have not been previously reported. The inferred human gut Firmicutes CsoR meta-regulon comprises six distinct eggNOG/COG identifiers with annotated func-tion, but is primarily defined by two COG identifiers that encompass 96 % of the putatively CsoR-regulated promoters (Additional files 2, 3). COG1937 maps to the CsoR repressor, and all the putatively regulated com-plete gene sequences mapping to this COG contain the conserved C-H-C motif (Additional file 4). This indicates that these COG1937 instances are functional copper-responsive regulators and suggests that the reported self-regulation of CsoR is a common trait of human gut Firmicutes species [17, 23]. COG2217 maps to the cop-per-translocating P-type ATPases (CopA). These pro-teins harbor heavy metal-associated (HMA; IPR006121), haloacid dehydrogenase-like (HAD-like; IPR023214) and P-type ATPase A (IPR008250) domains and are canoni-cal members of the Firmicutes CsoR regulon [25]. The remaining eggNOG/COGs map to proteins containing a HMA (IPR006121) domain [NOG218972, NOG81268], an unknown function (DUF2318; IPR018758) membrane domain [NOG72602] or HMA (IPR006121), DsbD_2 (IPR003834) and DUF2318 (IPR018758) transmembrane domains [COG2836]. Proteins mapping to NOG218972 and NOG81268 are often annotated as copper chaper-ones, whereas those mapping to COG2836 are mainly annotated as heavy metal transport/detoxification pro-teins, and those mapping to NOG72602 are simply annotated as membrane proteins. Analysis of site score distribution for the eggNOG/COGs reported in Table 1 indicates the presence of a single putative false positive. The sequences mapping to NOG109008 belong to clonal instances of a glycoside hydrolase family 18 protein-cod-ing sequence harborprotein-cod-ing an average (19.42 score) putative CsoR-binding site in its promoter region.
Analysis of the dominating eggNOG/COG identi-fiers in the human gut Firmicutes CsoR meta-regulon (COG1937 and COG2217) indicates that the copper-responsive regulator and copper-translocating P-type ATPase genes mapping to these regulated COGs are found in an operon configuration in a relatively small fraction of instances (Table 1; Additional file 5). Protein-coding genes mapping to COG2217 are in some cases associated with those coding for chaperone-like proteins (NOG218972, COG2836 and NOG81268), but there is
only one instance of a three-gene operon mimicking the CsoR-CopA-CopZ organization described in Listeria monocytogenes [27]. The promoter region of protein-coding sequences mapping to COG1937 and COG2217 reveals that around half of them contain high-confidence CsoR-binding sites (sites with score larger than two standard deviations below the mean for the CsoR motif). On both sequence sets, the distribution of high-confi-dence CsoR-binding sites peaks around 90 and 65 bp upstream of the predicted translation start site (TLS) (Fig. 4). Interestingly, almost half of these promoter sequences contain two high-confidence sites separated by 26, 36–38 or 51 bp (Additional file 6).
Discussion
A Bayesian inference pipeline for metagenomics analysis of regulatory networks
The increasing availability of large metagenomics data-sets prompts and enables the development of algorithms to interrogate novel aspects of these heterogeneous sequence repositories. Here we formalize and validate a Bayesian inference framework to analyze the composi-tion of transcripcomposi-tional regulatory networks in metage-nomes. Comparative genomics analyses have long established that the study of bacterial regulons ben-efits significantly from the availability of genomic data. Enrichment in TF-binding sites upstream of orthologous genes provides the means to curb the false positive rate of in silico methods for detecting these regulatory sig-nals and to identify the key components of a regulatory
network [29–32]. Leveraging the clusters of orthologous groups defined in the eggNOG database, here we define a conceptually similar approach to analyze bacterial regu-lons in metagenomic samples. We apply Bayesian infer-ence to compute the probability that an eggNOG/COG is regulated by a TF with a known binding motif. To facili-tate computation, the method assumes independence among the scores over a sequence and a normal distribu-tion for site scores, which may be replaced by the exact distribution [33]. Beyond these assumptions, the method relies only on the availability of priors for site density (α) and operon regulation P(R), which can be estimated from Table 1 Inferred human gut Firmicutes CsoR meta-regulon
Operons for analysis denotes the total number of operons mapping to each eggNOG/COG after sensitivity adjustment. P(R|D) designates the posterior probability of regulation for the eggNOG/COG. The Operon with COG1937 and Operon with COG2217 columns indicate the number of genes mapping to an eggNOG/COG that were assigned to an operon containing also COG1937 or COG2217, respectively. Dual sites denotes the number of sequences mapping to an eggNOG/COG harboring two high-confidence sites, out of the total number of sequences mapping to that eggNOG/COG with high-confidence sites
eggNOG / COG eggNOG 4.0
annotation Domains Mapped operons Operons for analysis P(R|D) Operon with COG1937 Operon with COG2217 Dual sites
COG1937 Transcriptional
repressor IPR003735 530 332 1 332 94 93/221
COG2217 p-type ATPase IPR006121, IPR023214, IPR008250
1580 422 1 84 422 94/204
NOG218972 Heavy-metal-associated domain
IPR006121 16 7 1 1 2 3/7
NOG72602 Predicted
mem-brane protein IPR018758 16 5 1 0 0 1/4
NOG109008 N/A IPR018242 18 5 1 0 0 0/5
COG2836 Membrane
protein IPR006121, IPR003834, IPR018758
36 8 1 0 1 1/3
NOG81268 Heavy-metal-associated domain
IPR006121 34 6 1 0 1 1/5
15 16 17 18 19 20 21 22 23 24 25
0 2 4 6 8 10 12 14 16
-300 -200 -100 0 100
Si
te
scor
e
Pe
rc
enta
ge
of si
te
s
Distance to predicted translaonal start site (bp)
COG1937 COG2217 COG1937 COG2217
reference genomes. The method also provides the means to speed up computation by restricting the set of pro-moter sequences to be analyzed in a principled manner.
Our results on synthetic datasets show that the method performs as expected, assigning higher posterior values to sequences containing better-scoring sites (Fig. 1a) and to eggNOG/COGs with a larger number of sequences containing putative sites mapping to them (Fig. 2a). These results also illustrate some interesting properties of the approach. The assumption of positional independ-ency provides a simple yet effective method to integrate the contribution of multiple sites in a promoter sequence. This is an important component for the analysis of bacte-rial regulons, since many bactebacte-rial transcriptional regu-lators exploit cooperative binding between multiple sites to modulate their activity at specific promoters [34–37]. Another element to take into account in metagenom-ics analysis is the presence of multiple instances of a clonal sequence mapping to an eggNOG/COG. These sequences occur frequently in metagenomic datasets and may carry multiple instances of a putative TF-binding site. The explicit modeling of regulated promoters with a mixture distribution results in lower posterior prob-abilities for such sequence sets (Fig. 1b), minimizing their assessment as false positives. Sequence sets car-rying instances of a site with average score, such as the sequences mapping to NOG109008 (Table 1), may still be assigned high posterior probabilities. Given enough sample size, such false positives can be addressed by the introduction of heuristics based on the variance of scores for high-confidence sites in sequences mapping to an eggNOG/COG.
The proposed approach also provides a method to adjust the sensitivity and speed of the analysis by remov-ing sequences with no evidence of regulation. This method is formally integrated within the Bayesian infer-ence framework by the introduction of a score thresh-old (θ) and the corresponding normalization of priors and likelihoods. In combination with taxonomic filter-ing (i.e. preservfilter-ing only sequences mappfilter-ing to the clade of interest), sensitivity adjustment allows users to focus their analysis on those sequences most likely to contrib-ute relevant information on the regulatory system under analysis. Sensitivity adjustment may hence allow detect-ing evidence of regulation in eggNOG/COGs with a rela-tively small percentage of putarela-tively regulated sequences (Fig. 2b). This may be advantageous when assessing regu-lation in large heterogeneous COGs, where only a small subset of the mapping genes are regulated orthologs, but the progressive refinement of orthologous groups in the eggNOG database will soon address such concerns. Moreover, sensitivity adjustment should be used with caution, since it alters the prior for regulation P(R) and
can therefore complicate the interpretation of results (Fig. 2b). There is no well-established method to deter-mine what constitutes an acceptable prior when report-ing posterior probabilities. As a conservative rule of thumb, one may require that the magnitude of the prior (φ′) be of the same order as the complement of the aver-age posterior probability to be reported (1 −φ). None-theless, the adjusted prior should always be clearly stated when reporting adjusted posterior probabilities to facilitate their assessment. As shown in Fig. 3, the Bayesian framework also performs better as a predictor of eggNOG/COG regulation than a more conventional approach based on permutation tests. This is primarily due to the influence of the Bayesian priors on the poste-rior probability computation, which greatly reduces the chances of generating false positives in non-regulated eggNOG/COGs. Furthermore, the ability to infer regu-lation without the need for permuted models decreases run-time and provides consistency across multiple runs.
Analysis of the human gut Firmicutes CsoR meta‑regulon The analysis of the human gut Firmicutes CsoR meta-regulon reported here provides a first glimpse at the genetic organization of this copper homeostasis regulon in its natural setting. The Firmicutes CsoR meta-regu-lon is dominated by two putatively regulated COGs that map to two major components of the canonical CsoR regulon (csoR and copA). These two COGs comprise more than 90 % of the putatively CsoR-regulated pro-moters, suggesting that these two elements are the sole defining features of the CsoR regulon in the Firmicutes species that populate the human gut. The absence of egg-NOG/COG identifiers mapping to the third canonical CsoR regulon member (copZ) is noteworthy, since the
copZ gene codes for a copper chaperone that binds cop-per ions and transfers them to copcop-per ATPases [26, 38]. Members of several putatively regulated eggNOG/COGs harboring a HMA domain (COG2836, NOG218972 and NOG81268; Table 1) appear to be distant orthologs of
B. subtilis CopZ, and some might therefore function as copper chaperones. However, the COG associated to B. subtilis CopZ (COG2608) obtains a very low posterior probability of regulation in our analysis (9.76 · 10−15;
Additional file 7). BLAST analysis with B. subtilis and
Staphylococcus aureus CopZ against complete genomes reveals that only one (Clostridium) of the ten most abundant Clostridiales genera in the human gut micro-biome encodes a CopZ homolog (Additional file 8). Fur-thermore, in reference genomes the Clostridium copZ
convincingly identify CsoR as a transcriptional regulator of copper homeostasis through a canonical CsoR-binding motif in the gut microbiome Firmicutes. Furthermore, they indicate that the CsoR meta-regulon comprises CsoR and a P-type ATPase (CopA), but not a CopZ-type chaperone, and that the contribution of other heavy-metal-associated domain proteins to CsoR-directed cop-per homeostasis is comparatively small [25]. The absence of copZ from bacterial genomes has been noted before [26, 38], and it has been suggested that the short length of this gene may hinder its detection [26]. Our analysis, however, indicates that, even when present, copZ is not regulated by CsoR in the gut microbiome Firmicutes.
Beyond identifying and quantifying the components of a transcriptional regulatory network, our results show that metagenomics analysis of bacterial regulons can also shed light into the wiring of the network and the regu-latory mode of the transcription factor. In the species where it has been experimentally described, the CsoR regulon displays a notable variety of genetic arrange-ments, ranging from single csoR-copA-copZ and copZ-csoR-copA operons in L. monocytogenes and Thermus thermophilus, to independent regulation of csoR and
copZA operons in B. subtilis, S. aureus or Streptomy-ces lividans [23, 24, 27, 28]. Our analysis indicates that
CsoR regulation in human gut Firmicutes follows this broad pattern, with independent regulation of csoR and
copA being the norm and a relatively small fraction of COG1937 and COG2217 instances associated in putative operons. Similarly, experimental reports of CsoR regu-lated promoters have documented to date CsoR binding to individual binding sites located at distances ranging from −20 to −180 bp upstream of the predicted trans-lational start site of regulated genes [17, 23, 24, 27]. In contrast, our analysis reveals that 44 % of the sequences mapping to regulated COG1937 and COG2217 instances possess two high-scoring sites separated by three well-defined spacing classes (26, 36–38 and 56 bp; Table 1; Additional file 6). There are currently three available structures for CsoR [17, 28, 40], showing CsoR to form either homodimers (M. tuberculosis) or tetramers (S. lividans and T. thermophilus), based on a three α-helix bundle. However, in the absence of co-crystals and of a canonical DNA-binding fold, the exact mechanism by which CsoR recognizes DNA remains elusive [25, 28]. It has been proposed that CsoR tetramers bind each dyad of the CsoR-binding motif through extensive exposure of DNA to the α1–α2 face of the bundle [28]. In this model the α3 helices of each tetramer may interact and contrib-ute to enhance DNA binding by stabilizing an octameric conformation of CsoR on DNA [41]. Crucially, the abil-ity of α3 helices to interact could be restricted by copper
binding, triggering de-repression. Such a model is com-patible with the adoption of hexadecameric conforma-tions through extended α3 contacts. In this light, the location of CsoR-binding site relative to the TLS and the spacing distances observed for site pairs in our analysis are reminiscent of promoter architectures that leverage multiple sites to induce DNA bending [34, 35]. This sug-gests that higher-order conformations of DNA-bound CsoR may be exploited by gut microbiome Firmicutes and other species to fine-tune the cellular response to excess copper ions.
Conclusions
In this work we introduce and validate a method for the analysis of transcriptional regulatory networks from metagenomic data. By adopting a Bayesian inference framework, our method provides the means to infer reg-ulatory networks from metagenomic data in a systematic and reproducible way, generating posterior probability values that facilitate the interpretation of results. The availability of robust methods for metagenomic regulon inference paves the way for the comparative analysis of regulatory networks across metagenomes, which has the potential to address fundamental questions about the evolution of bacterial regulatory networks. Valida-tion of the method on the CsoR meta-regulon of gut microbiome Firmicutes provides convincing evidence that CsoR is a functional copper-responsive regulator of copper homeostasis in human gut. By virtue of the taxo-nomic composition of the human gut microbiome, our analysis also constitutes the first description of the CsoR-governed copper homeostasis regulon of a broad taxo-nomic group, the Clostridiales, encompassing several poorly characterized species of increasing clinical inter-est. Notable aspects of this putative regulatory network include the absence of CopZ-type copper chaperones and the likely use of dual CsoR-binding sites to fine-tune gene regulation.
Additional files
Additional file 1. Appendix. Derivation of the soft-max scoring function. Additional file 2. Set of promoters mapping to putatively regulated egg-NOG/COGs after adjusting for sensitivity with θ = 6.65. The table reports the eggNOG/COG identifier, the MetaHIT IGC gene identifier, composed of sample and gene identifiers, the gene strand and its promoter region sequence, and the gene and protein sequences.
Abbreviations
ATPase: adenylpyrophosphatase; BLAST: basic local alignment search tool; COG: clusters of orthologous groups; CsoR: copper-sensitive operon repres-sor; DUF: domain of unknown function; eggNOG: evolutionary genealogy of genes: non-supervised orthologous groups; HAD-like: haloacid dehy-drogenase-like; HMA: heavy metal-associated; ORF: open reading frame; TF: transcription factor; TLS: translation start site; IGC: integrated non-redundant gene catalog; MetaHIT: metagenomics of the human intestinal tract; ROC: receiver-operating characteristic; AUC: area under the curve.
Authors’ contributions
ETH and TP implemented the code for the computational analysis pipeline. TP gathered and standardized the metagenomic datasets. TP and IE designed the computational analysis pipeline. PKO and IE devised the Bayesian inference framework. ETH and IE benchmarked the pipeline, interpreted the results and drafted the manuscript. All authors read and approved the manuscript.
Acknowledgements
The authors wish to thank David Nicholson and Joseph Cornish for their con-tribution to earlier versions of the metagenomic analysis pipeline.
Competing interests
The authors declare that they have no competing interests.
Availability of data and materials
All code and data for this work are made openly available through the Erill Lab git repository on GitHub (https://github.com/ErillLab/CogsNormalizedPosteri-orProbabilityThetas) [42].
Funding
This work was funded by the US National Science Foundation Division of Molecular and Cellular Biosciences award MCB-1158056, by the UMBC Office of Research through a Special Research Assistantship/Initiative Support (SRAIS) award and by the UMBC Office of Undergraduate Research through an Undergraduate Research Award (TP). The funders had no role in study design, data collection and analysis, decision to publish, or preparation of the manuscript.
Received: 26 January 2016 Accepted: 30 June 2016
References
1. Sleator RD, Shortall C, Hill C. Metagenomics. Lett Appl Microbiol. 2008;47:361–6.
2. Venter JC, Remington K, Heidelberg JF, Halpern AL, Rusch D, Eisen JA, Wu D, Paulsen I, Nelson KE, Nelson W, Fouts DE, Levy S, Knap AH, Lomas MW, Nealson K, White O, Peterson J, Hoffman J, Parsons R, Baden-Tillson H, Pfannkoch C, Rogers Y-H, Smith HO. Environmental genome shotgun sequencing of the Sargasso Sea. Science. 2004;304:66–74.
3. Tringe SG, von Mering C, Kobayashi A, Salamov AA, Chen K, Chang HW, Podar M, Short JM, Mathur EJ, Detter JC, Bork P, Hugenholtz P, Rubin EM. Comparative metagenomics of microbial communities. Science. 2005;308:554–7.
4. Ward AC, Bora N. Diversity and biogeography of marine actinobacteria. Curr Opin Microbiol. 2006;9:279–86.
5. Qin J, Li R, Raes J, Arumugam M, Burgdorf KS, Manichanh C, Nielsen T, Pons N, Levenez F, Yamada T, Mende DR, Li J, Xu J, Li S, Li D, Cao J, Wang B, Liang H, Zheng H, Xie Y, Tap J, Lepage P, Bertalan M, Batto JM, Hansen T, Le Paslier D, Linneberg A, Nielsen HB, Pelletier E, Renault P, et al. A human gut microbial gene catalogue established by metagenomic sequencing. Nature. 2010;464:59–65.
6. Hug LA, Beiko RG, Rowe AR, Richardson RE, Edwards EA. Comparative metagenomics of three Dehalococcoides-containing enrichment cultures: the role of the non-dechlorinating community. BMC Genom. 2012;13:327. 7. Segata N, Haake SK, Mannon P, Lemon KP, Waldron L, Gevers D,
Hut-tenhower C, Izard J. Composition of the adult digestive tract bacterial microbiome based on seven mouth surfaces, tonsils, throat and stool samples. Genome Biol. 2012;13:R42.
8. Thomas T, Gilbert J, Meyer F. Metagenomics—a guide from sampling to data analysis. Microb Inf Exp. 2012;2:3.
9. De Filippo C, Ramazzotti M, Fontana P, Cavalieri D. Bioinformatic approaches for functional annotation and pathway inference in metagenomics data. Brief Bioinform. 2012;13:696–710.
10. Warnecke F, Luginbühl P, Ivanova N, Ghassemian M, Richardson TH, Stege JT, Cayouette M, McHardy AC, Djordjevic G, Aboushadi N, Sorek R, Tringe SG, Podar M, Martin HG, Kunin V, Dalevi D, Madejska J, Kirton E, Platt D, Szeto E, Salamov A, Barry K, Mikhailova N, Kyrpides NC, Matson EG, Ottesen EA, Zhang X, Hernández M, Murillo C, Acosta LG, et al. Metagen-omic and functional analysis of hindgut microbiota of a wood-feeding higher termite. Nature. 2007;450:560–5.
11. Ley RE, Hamady M, Lozupone C, Turnbaugh PJ, Ramey RR, Bircher JS, Schlegel ML, Tucker TA, Schrenzel MD, Knight R, Gordon JI. Evolution of mammals and their gut microbes. Science. 2008;320:1647–51. 12. Zheng W, Zhang Z, Liu C, Qiao Y, Zhou D, Qu J, An H, Xiong M, Zhu Z,
Zhao X. Metagenomic sequencing reveals altered metabolic pathways in the oral microbiota of sailors during a long sea voyage. Sci Rep. 2015;5:9131.
13. Tobar-Tosse F, Rodríguez AC, Vélez PE, Zambrano MM, Moreno PA. Exploration of noncoding sequences in metagenomes. PLoS One. 2013;8:e59488.
14. Fernandez L, Mercader JM, Planas-Fèlix M, Torrents D. Adaptation to environmental factors shapes the organization of regulatory regions in microbial communities. BMC Genom. 2014;15:877.
15. Cornish JP, Sanchez-Alberola N, O’Neill PK, O’Keefe R, Gheba J, Erill I. Characterization of the SOS meta-regulon in the human gut microbiome. Bioinformatics. 2014;30:1193–7.
16. Li J, Jia H, Cai X, Zhong H, Feng Q, Sunagawa S, Arumugam M, Kultima JR, Prifti E, Nielsen T, Juncker AS, Manichanh C, Chen B, Zhang W, Levenez F, Wang J, Xu X, Xiao L, Liang S, Zhang D, Zhang Z, Chen W, Zhao H, Al-Aama JY, Edris S, Yang H, Wang J, Hansen T, Nielsen HB, Brunak S, et al. An integrated catalog of reference genes in the human gut microbiome. Nat Biotechnol. 2014;32:834–41.
17. Liu T, Ramesh A, Ma Z, Ward SK, Zhang L, George GN, Talaat AM, Sacchet-tini JC, Giedroc DP. CsoR is a novel Mycobacterium tuberculosis copper-sensing transcriptional regulator. Nat Chem Biol. 2007;3:60–8. Additional file 4. Sequence logo summarizing the multiple sequence
alignment of putatively regulated protein sequences mapping to COG1937. Alignment was performed with CLUSTALW in profile alignment mode, using the structural information in the M. tuberculosis CsoR P9WP49 UniProtKB entry to define gap penalties. The C-H-C motif residues are denoted by red arrows.
Additional file 5. Putative operons mapping two or more putatively regulated eggNOG/COGs. Gene identifiers in the same row constitute putative operons. The table reports IGC gene identifiers, composed of sample and gene identifiers, the putative regulation and the strand on which the gene has been predicted.
Additional file 6. Distribution of distance between high-confidence sites (bp) for promoters with more than one high-confidence site.
Additional file 7. Posterior probability assigned to eggNOG/COG identi-fiers after sensitivity adjustment with θ = 6.65. The table lists the eggNOG/ COG identifier, its eggNOG 4.0 annotation and functional category, the number of mapped promoters before and after sensitivity adjustment and the posterior probability for all eggNOG/COGs with at least 5 promoters mapping to them after sensitivity adjustment.
Additional file 8. Average abundance (%) of the 10 most abundant Clostridiales genera in the 401 MetaHit samples analyzed in this work. The first column indicates the putative presence (+) or absence (−) of a CopZ homolog as determined through independent BLASTP searches using B. subtilis and S. aureus CopZ protein sequences with a cutoff e-value of 10−15. Table compiled from data reported in Li et al. Nature Biotechnology
• We accept pre-submission inquiries
• Our selector tool helps you to find the most relevant journal • We provide round the clock customer support
• Convenient online submission • Thorough peer review
• Inclusion in PubMed and all major indexing services • Maximum visibility for your research
Submit your manuscript at www.biomedcentral.com/submit
Submit your next manuscript to BioMed Central
and we will help you at every step:
18. Powell S, Forslund K, Szklarczyk D, Trachana K, Roth A, Huerta-Cepas J, Gabaldón T, Rattei T, Creevey C, Kuhn M, Jensen LJ, von Mering C, Bork P. eggNOG v4.0: nested orthology inference across 3686 organisms. Nucleic Acids Res. 2014;42(Database issue):D231–9.
19. Novichkov PS, Laikova ON, Novichkova ES, Gelfand, Arkin AP, Dubchak I, Rodionov DA. RegPrecise: a database of curated genomic inferences of transcriptional regulatory interactions in prokaryotes. Nucleic Acids Res. 2010;38(Database issue):D111–8.
20. Kiliç S, White ER, Sagitova DM, Cornish JP, Erill I. CollecTF: a database of experimentally validated transcription factor-binding sites in Bacteria. Nucleic Acids Res. 2014;42(Database issue):D156–60.
21. Buchfink B, Xie C, Huson DH. Fast and sensitive protein alignment using DIAMOND. Nat Methods. 2015;12:59–60.
22. Haverty PM, Hansen U, Weng Z. Computational inference of transcrip-tional regulatory networks from expression profiling and transcription factor binding site identification. Nucleic Acids Res. 2004;32:179–88. 23. Smaldone GT, Helmann JD. CsoR regulates the copper efflux operon
copZA in Bacillus subtilis. Microbiology. 2007;153(Pt 12):4123–8. 24. Baker J, Sengupta M, Jayaswal RK, Morrissey JA. The Staphylococcus aureus
CsoR regulates both chromosomal and plasmid-encoded copper resist-ance mechanisms. Environ Microbiol. 2011;13:2495–507.
25. Rademacher C, Masepohl B. Copper-responsive gene regulation in bacte-ria. Microbiology. 2012;158(Pt 10):2451–64.
26. Solioz M, Abicht HK, Mermod M, Mancini S. Response of gram-positive bacteria to copper stress. J Biol Inorg Chem. 2010;15:3–14.
27. Corbett D, Schuler S, Glenn S, Andrew PW, Cavet JS, Roberts IS. The combined actions of the responsive repressor CsoR and copper-metallochaperone CopZ modulate CopA-mediated copper efflux in the intracellular pathogen Listeria monocytogenes. Mol Microbiol. 2011;81:457–72.
28. Dwarakanath S, Chaplin AK, Hough MA, Rigali S, Vijgenboom E, Worrall JAR. Response to copper stress in Streptomyces lividans extends beyond genes under direct control of a copper-sensitive operon repressor pro-tein (CsoR). J Biol Chem. 2012;287:17833–47.
29. Tan K, Moreno-Hagelsieb G, Collado-Vides J, Stormo GD. A comparative genomics approach to prediction of new members of regulons. Genome Res. 2001;11:566–84.
30. Rodionov DA, Mironov AA, Gelfand MS. Conservation of the biotin regu-lon and the BirA regulatory signal in Eubacteria and Archaea. Genome Res. 2002;12:1507–16.
31. Sanchez-Alberola N, Campoy S, Barbe J, Erill I. Analysis of the SOS response of Vibrio and other bacteria with multiple chromosomes. BMC Genom. 2012;13:58.
32. GrootKormelink T, Koenders E, Hagemeijer Y, Overmars L, Siezen RJ, de Vos WM, Francke C. Comparative genome analysis of central nitrogen metabolism and its control by GlnR in the class Bacilli. BMC Genom. 2012;13:191.
33. Rahmann S, Müller T, Vingron M. On the power of profiles for transcription factor binding site detection. Stat Appl Genet Mol Biol 2003;2:1544–6115. doi:10.2202/1544-6115.1032.
34. Maddocks SE, Oyston PCF. Structure and function of the LysR-type transcriptional regulator (LTTR) family proteins. Microbiology. 2008;154(Pt 12):3609–23.
35. Minchin SD, Busby SJ. Analysis of mechanisms of activation and repres-sion at bacterial promoters. Methods. 2009;47:6–12.
36. Pryor EE Jr, Waligora EA, Xu B, Dellos-Nolan S, Wozniak DJ, Hollis T. The transcription factor AmrZ Utilizes multiple DNA binding modes to recognize activator and repressor sequences of Pseudomonas aeruginosa Virulence Genes. PLoS Pathog. 2012;8:e1002648.
37. Cournac A, Plumbridge J. DNA looping in prokaryotes: experimental and theoretical approaches. J Bacteriol. 2013;195:1109–19.
38. Argüello JM, Raimunda D, Padilla-Benavides T. Mechanisms of copper homeostasis in bacteria. Front Cell Infect Microbiol. 2013;3:73. 39. Liu T, Chen X, Ma Z, Shokes J, Hemmingsen L, Scott RA, Giedroc DP. A
Cu(I)-sensing ArsR family metal sensor protein with a relaxed metal selec-tivity profile. Biochemistry (Mosc). 2008;47:10564–75.
40. Sakamoto K, Agari Y, Agari K, Kuramitsu S, Shinkai A. Structural and func-tional characterization of the transcripfunc-tional repressor CsoR from Thermus thermophilus HB8. Microbiology. 2010;156(Pt 7):1993–2005.
41. Ma Z, Cowart DM, Scott RA, Giedroc DP. Molecular insights into the metal selectivity of the copper(I)-sensing repressor CsoR from Bacillus subtilis. Biochemistry (Mosc). 2009;48:3325–34.