O R I G I N A L A R T I C L E
Open Access
Supply optimization based on society
’
s cost
of electricity and a calibrated demand
model for future renewable energy
transition in Niger
Fitsum Bekele Tilahun
1, Ramchandara Bhandari
1*and Mengesha Mamo
2Abstract
Background:In an attempt to realize the most beneficial and optimal mix of electricity generation in Niger, a society’s cost of electricity (SCOE) as the levelized cost of electricity (LCOE) plus the cost of climate change and air pollution is formulated. The SCOE is used as a basis for setting the performance criteria for supply optimization to balance future electricity demand in Niger. The demand projection is derived from a system dynamics model that anticipates future changes based on its influencing factors of population growth, urbanization progress, and industrial development.
Results:Reference case and what-if scenarios are simulated to see the projected electricity demand and possible renewable energy transition pathways. As a result, for example, the annual electricity of 3214 GWh estimated for 2030 might be balanced with about 200 MW, 104 MW, 85 MW, and 63 MW power from hydropower, grid-tied PV, coal, and diesel for SCOE optimized grid. For the same case, a greenhouse gas (GHG) emission reduction of 11.26– 15.66% could be achieved when compared to the LCOE-based optimized grid. In addition, the most preferred energy option hydropower will be almost exhausted when the projected electricity demand in 2035 reaches slightly more than double its value in 2025. Thus, Niger should start exploiting its solar as well as conventional sources intensively to balance its future energy demand.
Conclusions:In this work, a mixed energy grid is optimized primarily on affordability while considering its sustainability. The implemented holistic approach lessens the need for energy import in the country and provides relief to energy security issues such as electricity price volatility and supply reliability. Additionally, the proposed strategy helps to guide the renewable energy transition pathway in Niger.
Keywords:Electricity demand projection, Supply optimization, Society’s cost of electricity (SCOE), Levelized cost of electricity (LCOE), Renewable energy transition, Niger
Background
The provision of low-cost energy to the rural and peri-urban areas and reliable energy access to the peri-urban and
industrial sector are an integral part of Niger’s
develop-ment plan [1]. Nevertheless, the realization of this plan has been hindered by three related challenges. First, the inadequate understanding of the underlying relation
among energy demand and its influencing factors (popu-lation growth, industrialization, and urban progress) for balancing supply and demand in developing countries
such as Niger [2, 3]. For instance, with Niger’s
popula-tion in 2017 being around 21.48 million [4], the per capita electricity consumption was around 51 kWh, compared to the African average of 780 kWh and West
African average of 186 kWh (Fig. 1) [5]. Although the
past trend of electricity consumption in Niger has been changing slowly, it is expected to increase significantly
© The Author(s). 2019Open AccessThis article is distributed under the terms of the Creative Commons Attribution 4.0 International License (http://creativecommons.org/licenses/by/4.0/), which permits unrestricted use, distribution, and reproduction in any medium, provided you give appropriate credit to the original author(s) and the source, provide a link to the Creative Commons license, and indicate if changes were made.
* Correspondence:ramchandra.bhandari@th-koeln.de
1Institute for Technology and Resources Management in the Tropics and
Subtropics (ITT), TH Köln (University of Applied Science), Betzdorfer Strasse 2, 50679 Cologne, Germany
in the coming years due to a high annual population growth of about 3.3%.
The relationship between economic development and
increased energy demand [3, 6–8] as well as the strong
correlation between urbanization and enhanced energy utilization [3,6,8–11] are clearly observed in the litera-ture. These trends are also accompanied with a relative political stability and large-scale investments in the min-ing and oil sector of a country, which is also evident in Niger. Often, economic development reciprocates into increased energy consumption by the industrial and urban sectors. Thus, the development of a valid model that translates and anticipates quantitatively these re-lated events would help energy policymakers to realize the development goals.
The second challenge that hinders the provision of low-cost and reliable energy is a heavy reliance on imported electricity from Nigeria, which poses serious energy security issues in Niger [12]. According to
Soci-été Nigérienne d’Electricité (NIGELEC, Niger’s
electri-city company), the share of imported energy reached 86.5% in 2017 purchased at about 0.044 $/kWh and sold at an average price of 0.158 $/kWh [13]. As can be seen
from Fig. 2, the imported electricity from Nigeria has
significantly increased over recent years. Under the existing electricity purchase price, there is hardly any room for renewable energy (RE) participation in the fos-sil dominated grid. However, this share of cheap imported energy is expected to decrease significantly in the coming years, due to the energy crisis in Nigeria caused by the inability to meet the energy demands of
its growing population and economy [14, 15]. This has
been a major factor compelling the Nigerian government to launch an electricity market reform resulting in an
in-creased electricity selling price. Moreover, Nigeria’s old
refineries and inefficient single cycle turbines might have contributed to the reduced availability of power export to Niger [15].
Finally, the absence of an energy mix in the power grid based on the availability and cost of generation (includ-ing the cost on the environment), which has led to an inefficient fossil dominated power generation, is another challenge to the provision of low-cost and reliable en-ergy in Niger. Apart from an estimated 2% solar photo-voltaic (PV) installation in the telecom and off-grid sectors, power generation in the country still relies
en-tirely on fossil fuels (coal and diesel) [12,13]. Moreover,
many of NIGELEC’s diesel power plants are close to the
Fig. 1Per capita electricity consumption of Niger in comparison with selected West African countries in 2017
decommissioning phase but continue to operate with high generation costs [13].
Against this backdrop, solar PV and hydropower hold the promise of becoming suitable alternative energy sources in Niger. An attractive medium to large hydro-power potential in the country is estimated at about
312–450 MW [17, 18]. Until now, only a feasible
poten-tial assessment has been carried out for a few sites, such
as Dyodyonga, Gambou, and Kandadji, with an esti-mated hydroelectric power potential of about 38, 122.5,
and 125 MW, respectively [17]. Figure 3depicts the flow
rate of the Niger River in dry and wet seasons measured in Niamey [16]. Some suitable mini-hydropower sites have also been identified along four tributaries of the Niger River, namely Mekrou, Tapoa, Gorouol, and Sirba,
amounting to a combined capacity of 3–8 MW [17,18].
Fig. 3Flow rate of Niger River in 2015 [16]
Niger is also endowed with a high solar PV potential.
As shown in Fig. 4, almost all regions in the country
have a daily average PV potential of over 4.6 kWh/kWp [19]. Thus, if properly designed and operated, power from grid-tied PV systems could provide an efficient method of harvesting the available solar power.
A potential assessment that has been carried out in Niger so far indicates that wind resource is negligible [18]. It also showed that conventional sources of energy such as diesel and coal are abundant in the country [20]. Considering these findings and the aforementioned en-ergy-related issues, a holistic approach for finding an op-timal energy mix based on the availability and cost of generation (including the cost to the environment) would be necessary and insightful. Moreover, this
approach should balance the future energy demand and include a strategy to lessen the need for imported en-ergy. Therefore, the optimal energy mix criteria should be based on the following trade-offs:
The complementary nature of solar and hydropower should be used to compensate for the lower energy output from hydropower during the dry season. The high electricity generation cost from solar PV,
which has not yet reached a level to be competitive with hydropower, and abundant conventional power sources should be balanced.
Power from conventional sources should be used to match the future energy demand but lessen their negative impact on climate change and air pollution. Fig. 5Electricity demand model in the Anylogic using system dynamics
Similarly to the indications given in [24, 25], all future electricity generation schemes should be designed ac-cording to the specific context of the country. Consider-ing how poor most developConsider-ing countries such as Niger are, a policy that ensures a mixed energy grid that is pri-marily based on affordability and has an eye on sustain-ability should be the main aim in designing optimal energy supply systems. Therefore, the specific objectives of the study are
To develop Niger’s future energy demand based on its influencing factors of population growth, industrialization, and urbanization progress. To calibrate the model against historical data. To formulate and optimize a supply model for an
optimal mix of conventional and renewable energy sources based on the LCOE and SCOE.
To simulate future renewable energy transition scenarios in Niger.
Methods
The model employed in this study consists of three main components: electricity demand projection, supply, and optimization model. The following sections give the de-tails of these components.
Electricity demand model
Several studies were conducted for short or/and
long-term electricity demand projection that can be
categorized into six types: regression based [29], autore-gressive integrated moving average (ARIMA) [30], artifi-cial neural networks [31], fuzzy logic [32], support vector [33], and system dynamics models [34]. The sys-tem dynamics approach is able to handle the dynamic evolution of vital energy forecasting variables with feed-back loops among each other [35] and allows the incorp-oration of stochastic behavior [36].
In this work, the inherent relationship between energy demand and economic and social variables is studied using the system dynamics approach. The model antici-pates potential electricity demand changes in Niger based on its influencing factors. The following valid as-sumptions are considered in the system dynamics modeling:
Due to limited electricity consumption data for Niger (less than a couple of decades), the electricity demand projection is carried out for a short period of up to 2035.
In Niger’s context, three influencing factors that may strongly affect electricity consumption are included in the model. The first factor is the normal electricity demand due to the change in total population each year. The second influence comes from the effect of urbanization determined from the ratio of the urban population to the total population every year. Lastly, the industrialization change observed each year also influences electricity demand. Electricity demand due to industrialization can be determined from the ratio of other GDPs and industrial GDP in Niger. Other GDPs are defined in this work as GDPs related to service and agricultural economic activities.
The net change in electricity demand each year from the previous year due to the aforementioned influences can be represented by a linear function [37].
Table 1Overview of parameter values used to determine the efficiency of a PV system
Parameter Value Source
Pp 130 W/m2 [21]
α −0.0047 K−1 [22]
p0 0.0072 [23]
ηAC,c 99% [22]
ηDC,c 99% [22]
ηd 98.5% [22]
ηdi 99% [22]
ηm 98% [22]
Table 2Parameter values used in the supply model and calculation of LCOE for setting the optimization weights [26,27]
Parameter Grid-tied PV Hydropower Coal Diesel
Capital cost, $/kW 2400 2100 1300 1250
Life time, year 20 40 40 20
Capacity factor, % 21 65 70 60
O&M cost, $/kW/year 24 55 45 10
Fuel cost, $/Mbtu – – 5.1 18.23
Heat rate, btu/KWh – – 8937 10,000
Table 3Greenhouse gas (GHG) emission rates for various power-generation technologies considered [28]
Technology GHG emissions rates (kg CO2eq/MWh)
Hydroelectric facility 0.5–152
Natural gas-fired power plant 400–500
Oil-fired power plant 790–900
Coal-fired power plant 900–1200
Table 4Overview of the climate change and air pollution cost used in calculating the SCOE
Cost Natural gas Diesel Coal
COCC, Cents/kWh 0.36 0.49 0.71
Accordingly, each year’s net electricity demand (NED) in Niger can be determined from the rate of change of total electricity demand (ED) as
ED
ð Þ=dt¼NED ð1Þ
The NED is the sum of the product of the previous
year’s electricity demand by the normal demand rate
(NDr) and the newly added electricity demand rate (ADr) due to urbanization and industrialization progress calculated by
NED¼EDðNDrþADrÞ ð2aÞ
ADr¼DTUUFþDTIIF ð2bÞ
where UF and IF are the urbanization and
industrialization factors that affect the net electricity
de-mand due to changes in previous year’s urbanization and
industrialization, respectively. DTU and DTI are the urbanization and industrialization coefficients. UF and IF are represented by a functional relation of urban
population (U) to the total population (P) ratio and
other GDP (OG) to the industrial GDP (IG) ratio as
UF¼ðU=PÞ ð3aÞ
IF¼ðOG=IGÞ ð3bÞ
wherefis a linear function given by
ðxÞ ¼a1þa0;i ð4Þ
where the coefficients in Eq. (4) are determined from the model calibration experiment based on historical data.
On the other hand, the population and urban dynam-ics in each year of Eq. (3a) can be represented as
P
ð Þ=dt¼PB−PD ð5aÞ
U
ð Þ=dt¼UR−IR ð5bÞ
where the total births (PB), total deaths (PD), urbanization rate (UR) and immigration rate (IR) in the current year can be determined as
PB¼PBr ð6aÞ
PD¼PDr ð6bÞ
UR¼UUr ð6cÞ
IR¼UIr ð6fÞ
where Br, Dr, Ur, and Ir are birth rate, death rate, urbanization rate, and immigration rate, respectively.
Similarly, the GDP dynamics can be represented as
IG
ð Þ=dt¼IGDP ð7aÞ
OG
ð Þ=dt¼OGDP ð7bÞ
where
IGDP¼IGrIG ð8aÞ
OGDP¼OGrOG ð8bÞ
where OG and IG are industrial and other GDP growth rates in Niger.
The dynamics given in Eqs. (1–8) are based on two
sub-dynamics computed from the previous year’s change
in model variables. Considering urbanization and
industrialization growth rates as negligible, the net elec-tricity demand observed will only be based on the nor-mal population growth in the country. The nornor-mal
demand rate (NDr) captures these dynamics. As the
urbanization and industrialization growth rates present the change, the net electricity demand will also reflect this change through the UF and IF evolving parameter values. These changes are modeled as a functional value
Table 5Calibrated parameter values of the electricity demand model
Calibrated parameters
DTU DTI NDr a1,1 a1,2 a0,1 a0,2
Value 0.0004 0.0480 4.349E
−4
1.1455 −
0.0027 −1.2352 1.5999
of a linear function that takes on the ratios that quantify
urbanization (U/P) and industrialization (OG/IG).
The above dynamics given in Eqs. (1–8) is coded into
the Anylogic 8.3.2 software resulting in the system
dy-namics model depicted in Fig. 5. Finally, this model is
calibrated against the historical electricity demand data
and will be explained in the “Results and discussions”
section.
The Anylogic computational platform was chosen be-cause it is an object-oriented modeling framework suit-able for system dynamics. Moreover, the Anylogic has a meta-heuristics optimization engine based on the Opt-Quest package from OptTek Systems that allow param-eter variation experiments, calibration of paramparam-eters, optimization, and Monte-Carlo runs to be carried out.
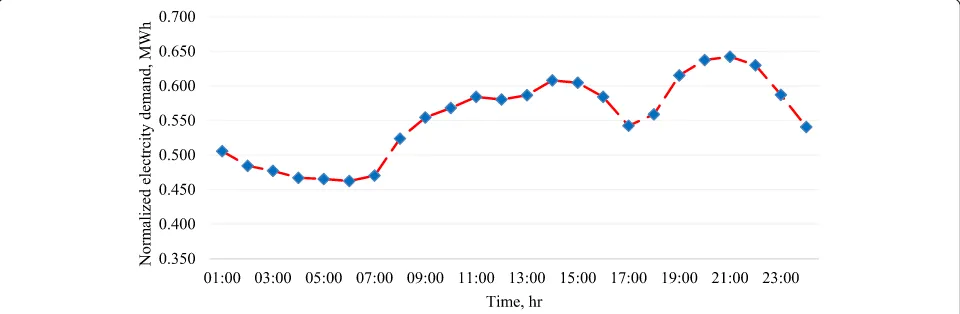
Finally, the hourly electricity demand for a given year can be determined from the product of the normalized hourly load profile and annual electricity demand
esti-mate (from the system dynamics model). Figure6 shows
the normalized hourly load profile obtained from the NIGELEC database.
Electricity supply model
Apart from an estimated 2% PV installation in the tele-com and off-grid sectors, the power generation in Niger entirely relies on fossil fuels (coal and diesel) [12]. The existing grid capacity is about 173 MW contributed from the five companies NIGELEC, SORAZ, SONICHAR, AGGREKO, and SOMINA. Additionally, there are some
fragmented companies supplying power to mining sites. With a share of about half of the total power production, NIGELEC is the main company responsible for the pro-duction, transmission, and distribution of electricity in the country [13]. NIGELEC operates inefficiently and shortly before decommissioning power plants with high operating costs [12], the said inefficient power plants partly contribute to the relatively high electricity selling price (in the range of about 0.16 and 0.22 $/kWh) des-pite a very low electricity import price of around 0.044 $/kWh [13].
In this study, it is assumed that the future electricity supply will be contributed both from RE and conven-tional sources. Grid-tied PV and hydropower represent the RE generation. Hydropower is a cost-efficient electri-city generation technology [38] capable of responding
quickly to demand fluctuation [38,39], and solar PV can
complement its seasonal variation [40, 41]. Even though
some regions in the northern part of Niger have an aver-age wind speed of over 5 m/s at a 10-m height, the remaining major part experiences a relatively low wind
speed of about 4 m/s [12, 18]. Thus, electricity
gener-ation from wind is not taken into account in this study. On the other hand, the conventional electricity supply considered is from coal and diesel and not from natural gas since the latter is assumed to be unavailable in Niger [20]. The following section describes the details of the RE and conventional power supply model.
The grid-tied PV system
In order to obtain the specific energy yield of a grid-tied PV system, the approach indicated in [42] is used as follows:
PPV;s¼ Gt 1000 W=m2 Pp þα Gt
18 W=m2þðTA−20Þ
ð9Þ
where PPV,s denotes the area-specific power of the PV
module [W/m2]; Gt the total radiation on the inclined
surface [W/m2], Pp the peak power of the PV module
[W/m2], and α represents the temperature coefficient
andTAthe ambient temperature [°C].
The efficiency of the inverter used to convert the DC power to AC power in Eq. (9) can be determined from
ηi¼
p
pþp0þkp2 ð10Þ
where ηi is the efficiency of the inverter, p0 denotes
the standby losses, k is the rectifier constant, and p is
the ratio of the power output of the inverter to its rated power output.
Table 6Projected electricity demand in Niger from 2019 to 2050
Year Electricity demand, GWh
Population, million person
GDP, billion USD
2019 1452.417 22.87 9.42
2020 1560.967 23.59 9.89
2021 1677.672 24.34 10.39
2022 1803.147 25.11 10.92
2023 1938.055 25.90 11.48
2024 2083.108 26.72 12.06
2025 2239.073 27.56 12.67
2026 2406.775 28.43 13.32
2027 2587.102 29.32 13.99
2028 2781.009 30.24 14.70
2029 2989.525 31.18 15.45
2030 3213.755 32.16 16.24
2031 3454.889 33.16 17.07
2032 3714.209 34.19 17.94
2033 3993.094 35.25 18.86
2034 4293.026 36.34 19.82
The net power output of a PV system can be calcu-lated by considering the losses in the cables, bypass di-odes, and loss due to dust on the PV modules as
Pn¼PPV;sηiηAC;cηDC;cηdηdiηm ð11Þ
whereηAC,c·ηDC, c·ηd·ηdi·ηmare the AC cable loss,
the DC cable loss, the efficiency in the presence of dust on the module, the efficiency of bypass diodes, and the gross efficiency of the PV module specified by the
manu-facturer, respectively. Table 1 gives an overview of the
coefficients and efficiencies used in the power calcula-tion of the grid-tied PV module.
The PV power calculations based on Eqs. (9–11) were
finally coded into the Anylogic. The PV power output is then simulated for a south-facing orientation with a tilt
angle equal to the station’s latitude where the solar
radi-ation measurement is collected. The rated power cap-acity of the PV systems was initially set for 1 kW peak and extrapolated linearly for further output quantities during optimization. It is important to note that the hourly solar radiation data for Niamey are obtained from
the Centre National d’Énergie Solaire (CNES) for 2015.
Reservoir hydropower and conventional power plants
The hourly available electrical energy Eh from a given
hydropower or conventional power plant can be deter-mined using
Eh≤ðPaþPiÞ Cf Δt ð12Þ
wherePi,Pa,Cf, andΔtdenote the newly added power,
the existing installed power, the capacity factor, and simulation time interval, respectively, which is 1 h in this case. The total power capacity is constrained by the
maximum valuePmas
PaþPi≤Ph;m ð13Þ
(a)
(b)
Fig. 8aRatio of urbanization to total population as well as other GDPs to industrial GDP andbnet electricity demand trend contributed from urbanization, industrialization, and population growth (normal demand)
Table 7Reference and possible scenarios of potential future electricity demand projections
Parameter Reference C1 C2
Ur 0.039 0.047 0.039
Supply optimization
The optimization problem is formulated based on the minimization of the hourly energy mismatch and the large variation of energy supply from the individual power generation technologies as
Ω¼ Z T
0
αðS tð Þt−DaL tð Þ
2
þXi¼n i¼1
βiS tð Þi 2
" !
dt1=2
ð14Þ
where T is the length of the optimization time taken
to be 1 year,S(t)tis the total electricity supply fromn
re-newable and conventional sourcesS(t)i,Dais the average
hourly load derived from the calibrated demand model,
and L(t) is the daily grid power profile normalized to
unity taken from NEGELEC main power meter readings.
The coefficientsα andβs’are the weighting factors that
determine the relative share of various power-generation technologies based on LCOE (SCOE) and electricity
sell-ing priceepand can be derived as
α¼ P ep
LCOEi ð Þ2þ
e2 p
h i1=2 ð15aÞ
βi¼
LCOEi P
LCOEi ð Þ2þ
e2 p
h i1=2 ð15bÞ
where the LCOE in Eq. (15) is the ratio of total life cycle cost to total lifetime energy production which is calculated as [38]:
LCOE¼ I−X
T
t¼1
dtγtαþ XT
t¼1
Ctγtð1−αÞ−SγT
EX T
t¼1 γtxt
ð16Þ
whereγrepresents the time value of money calculated
based on the weighted average cost of capital, r, as [γ=
Fig. 9The effect of urbanization and industrialization growth rate changes on the electricity demand projection
1/(1 +r)]. The coefficientsI,S,α,E,T,dt,Ct, andxt
rep-resent the initial investment, the salvage value of the technology at the end of the project, the corporate tax rate, the energy produced, the lifetime of the project, the depreciation rate, the operating cost, and the system
degradation in year t, respectively. In the LCOE
esti-mates for this work, the productive capacity remains undiminished for the various power-generation tech-nologies. The weighted average cost of capital and cor-porate tax rate are also assumed to be 0.08 and 0.0, respectively. The remaining parameter values used in
the LCOE calculation are listed in Table2[15,26,27].
On the other hand, the SCOE, which includes the costs incurred by the society from environmental and social points of view, can be given using [15]
SCOE¼COCCþCOAP ð17Þ
where COCC and COAP are costs of climate change and air pollution.
Table3 illustrates the CO2emission rates for the
vari-ous power-generating technologies considered in this study [28]. Of all technologies, coal-based power gener-ation contributes largely towards global warming emis-sion and air pollution.
The COCC in Eq. (17) is calculated based on a carbon tax that lays a proportional price on fossil fuels
according to their carbon content. The COAP also varies owing to the presence of different pollutants in fossil
fuels. Due to the absence of valid data for hydropower’s
emission and air pollution cost, the SCOE is calculated for coal and diesel power generation. Additionally, the solar generation is assumed clean and hence no associ-ated emission and air pollution costs should be
consid-ered. Table 4 gives an overview of these costs based on
the indications given in [15,43,44].
Results and discussions
In the first section, Niger’s future electricity demand
es-timate derived from the system dynamic model is dis-cussed. This is followed by a second section that depicts the supply optimization process based on LCOE and
SCOE. A final section briefly discusses the CO2emission
reduction potential from the share of RE.
Electricity demand estimate
Niger’s electricity demand for 2019–2035 is forecasted
using the proposed electricity demand model that antici-pates future changes based on its influencing factors. The trend of the influencing factors, namely GDP, popu-lation, urbanization, and industrialization, is explained below.
The annual average industrial and GDP growth rate in
Niger from 2000–2017 are taken as 9% and 12%,
re-spectively [4]. However, Niger’s economic growth might
increase driven mainly by mining and oil refining activ-ities [1]. As a result, the economic growth rate may vary in the future. This variation is taken into consideration for the projection period from 2019 to 2035. The aver-age birth and mortality rate in the country was about 4.8% and 1% between 2000 and 2017. Although the population growth rate might slightly decrease according Fig. 11Evolution of the optimization process in the Anylogic optimizer
Table 8Settings for parameter variation experiment
LCOE Ref. Min Max Step size
Hydro 0.0474 0.02 0.06 0.003
Solar 0.1663 0.1 0.22 0.009
Diesel 0.2121 0.2 0.31 0.008
to the observed 7.8% decline in total fertility in Africa from 2005 to 2015 [23], this small change is negligible and it is assumed that the birth and death rate values re-main constant for the demand projection period.
Similar to other developing countries, the migration rate from Niger is expected to increase from 0.05% to 0.1% between 2030 and 2050 [45]. The annual average urbanization growth rate amounted to about 3.9% for
2000–2017 [4], and the same rate is assumed for the
electricity demand projection period of 2019–2035.
Before simulating the aforementioned scenarios, the electricity demand model needs to be calibrated and val-idated against the historical trend of electricity con-sumption in Niger. The procedure aims to minimize the mean square error (MSE) between the simulation output
and historical data. Table5gives the calibrated variables
and their associated values during the calibration process of the electricity demand model that are depicted in Fig.6.
Figure 7 compares the calibrated electricity demand
model output with the historical data and the error
be-tween them. As can be seen from Fig. 7, the calibrated
model follows the historical trend of electricity demand over the years from 2000 to 2014. The MSE of calibra-tion that is found at 1.66 kWh also validates the capabil-ity of the model for estimating the future electriccapabil-ity demand under the given values of the influencing factors.
The projected electricity demand between 2019 and
2035 is illustrated in Table 6. The electricity demand
shows an annual average growth rate of 7.5% during this
period. Table 6 also indicates 1.64- and 2.21-fold
in-creases in population and GDP between 2019 and 2035.
Figure 8a shows the relative trend of industrial GDP
and urbanization. The contribution towards the total electricity demand because of population growth (nor-mal demand), urbanization, and industrialization is
illus-trated in Fig. 8b. The ratio of the GDP to the industrial
GDP is increasing at a slow pace. This means that
Niger’s economy is not dominated by manufacturing
and/or processing industries. The small and gradually in-creasing industrial GDP observed is due to the mining sector that has been in place for a long time. It is
pos-sible to see from Fig. 8b that the extent of industrial
GDP influence on the electricity demand is much more than the urbanization effect. This is because the
urbanization progress is slow (Fig.8a). It is also
import-ant to note that the demand given in Fig. 8b is the net
demand for each year based on the change in popula-tion, urbanizapopula-tion, and industrialization.
All of the aforementioned factors affecting electricity demand are not fixed and can change following a policy direction from the government. What follows is a sce-nario of possible anticipated future changes regarding urbanization and industrialization. Two scenarios (C1 and C2) are intended for analyzing their impact on the electricity demand in relation to a reference case pre-sented earlier. The reference and what-if scenarios are
given in Table7.
In Table7, the urbanization growth rate in C1 and the
industrialization in C2 are allowed to vary by 20% from the reference scenario. When considering the electricity
demand trend in Fig.9, it is possible to observe that C2
does not change much compared to the reference sce-nario, but C1 shows a significant change. A stronger ef-fect of urbanization rate changes on the electricity demand than the industrialization has also been indi-cated in the literature [3,6–8].
Supply optimization
The following valid assumptions are taken into con-sideration for the supply optimization:
Fig. 12Sensitivity analysis in supply optimization
Table 9Optimum values of the various power-generating technologies for the reference and the considered scenarios
Scenario Reference C1 C2
Hydropower, MW 161.40 177.43 181.21
Coal power, MW 101.10 129.73 117.54
Diesel power, MW 74.00 74.00 74.04
PV, MW 110.00 112.00 113.05
(a)
(b)
Fig. 13Simulation of a typical day in the wet season that showsaenergy supply andbdemand and supply trend in 2030
(b)
(a)
As discussed in Section 1, Niger’s heavy reliance on imported electricity from Nigeria stretched to about 86.5% in 2017. Since the average electricity purchase price from Nigeria is cheap at about 0.044 $/kWh, it is not feasible to completely remove this imported electricity. Instead, a policy should aim at a gradual decrease of this large share to ensure energy security in the country (due to reasons given in the
introductory part of this paper). Thus for supply optimization, a 40% decrease in the share of imported electricity is considered.
The existing 140 MW from fossil fuels is also included in the supply optimization procedure. The existing and newly introduced power plants constitute an optimal mix of energy supply from conventional and RE sources that will cover the removed imported energy and the added energy demand (due to population, urbanization, and industrialization).
The electricity output from hydropower plants in the dry season is allowed to vary from its rated power output by an average value of 28.5%.
In the optimization procedure, the total hydropower potential is set to be 400 MW [17,18], whereas the coal, diesel, and solar power are assumed unlimited to meet the country’s energy demand until 2035.
The LCOE and SCOE of the various power-gener-ation technologies that are the basis for setting the weighting factor in the objective function of the
optimization problem are given in Fig. 10. As for
the LCOE, the most economical choices for electri-city generation come from hydropower and coal with an LCOE of 0.0474 and 0.0746 $/kWh, re-spectively. On the other hand, the SCOE showed that power generation from coal is associated with
higher cost from pollution and environment
aspects. Fig. 15Dry and wet season complementary nature of solar and hydropower
The supply optimization based on the LCOE is dis-cussed first, and later, this result is compared with the SCOE-based optimization approach.
Figure 11 depicts the states of the objective function
and the optimal variables while the simulation is run-ning. The Anylogic optimizer is configured to run for 500 iterations in search of the optimal solution. It gives
out the “best feasible” and “current” solutions. The
optimizer also keeps a record of the frequency of occur-rences of the best optimal solution out of the maximum
assigned iteration (490 for the case illustrated in Fig.11).
Finally, the optimizer allows for copying of the best opti-mal parameter values to transfer them back to the simu-lation environment for further analysis.
A sensitivity analysis to analyze the effect of variation of the LCOE values on the optimization result based on capacity factor, fuel costs, and projected cost reduction changes is carried out using the experiment setting
depicted in Table8.
The result of the effect of the LCOE variation on the
optimal values is illustrated in Fig. 12. There is only a
2.9% change observed in objective function values as the LCOEs vary from the minimum to the maximum values. This is because the weight values of the objective func-tion do not depend on the individual LCOE but on their relative magnitude as given in Eq. (15). For the same reason, it is also possible to notice that there is a rela-tively high variation in the optimal values for hydro and coal power plants compared to diesel and solar PV.
The LCOE-optimized grid that fulfills the projected demand in 2030 for the reference and the two scenarios
C1 and C2 is depicted in Table9. It is important to note
that for C1 and C2, the reference case is used as the starting value during the optimization process. From
Table9, it is evident that the method employed resulted
in a 60.78% share of renewable energy sources, including hydropower for the reference case. The PV share in the total RE is about 24.63%. It is also possible to see that the contribution from diesel is the lowest accounting for only 16.57% of the total power. In addition, the diesel contribution remains the same in all the cases due to its relatively high LCOE value. Moreover, this trend of assigning preference based on the LCOE explains the relative variation of optimal values for the various power-generating technologies.
The daily trend of the demand and the supply of en-ergy for the reference case on a typical day in the wet
season (August 15 in 2030) is shown in Fig.13. It is
pos-sible to see from Fig.13b that the optimal supply
guar-antees the load constraint placed on the optimization during the whole day.
Similarly, the simulation of the energy output for the various power-generating technologies and a typical dry
season (January 15 in 2030) is depicted in Fig. 14. The
solar output is relatively uniform when compared to its
yield in the wet season demonstrated in Fig.13. As
indi-cated in Fig. 14b, the optimal power configuration
bal-ances the energy demand despite the observed decrease in hydropower in the dry season.
The complementary nature of solar and hydropower is
evident from Fig.15. In dry seasons, the electricity from
hydropower decreases from the wet season value of 104.91 MWh to 94.97 MWh. On the other hand, the solar PV yield increases from its worst day in the wet season from 551.26 MWh to 692.842 MWh for the best day in the dry season.
It is important to note that the actual solar energy supply from the optimized power plant is expected to be
higher than that suggested in Fig.13and Fig.14. Due to
the absence of measured data, the solar PV output is simulated for Niamey, which receives the lowest solar radiation compared to other regions in Niger, as demon-strated in Fig.4.
Finally, the consideration of the SCOE as a basis for setting the optimization weights reveals some interesting
points. The results given in Fig.16show that the
contri-bution from coal and diesel power is negligible in com-parison to hydropower and solar power generation. This means that when all costs, including costs borne by the society and environment, are taken into account, a gen-eration from traditional fuels should be avoided.
How-ever, given the urgent need for the economic
development of Niger, energy affordability should have a priority in designing the optimal mix of energy supply in the grid. As technological advancements make power generation from renewables competitive, the LCOE-based optimal design tends to result in a solution that
resembles the SCOE given in Fig.16.
Another point is that in the years beyond 2030, where the electricity demand is expected to double, the most preferred hydropower will be fully utilized. Thus, Niger should start exploiting its solar as well as conventional sources intensively to balance its long-term energy demand.
Greenhouse gas emissions
The total greenhouse gas (GHG) emission can be calcu-lated by considering the contribution from each energy source to electricity production based on the data given
in Table3as
CO2;T¼
g1EHþg2ESþg3ECþg4Ed
1000 ð17Þ
where CO2,Tis the total annual carbon dioxide
gener-ated (TCO2eq),EH,ES, EC, andEDare the annual energy
yields (MWh) from hydropower, grid-tied PV, and coal
GHG emissions due to the various power generating
technologies, as given in Table 3 (kg CO2eq/MWh).
Thus, for example, the LCOE-based optimized power
supply system in 2030 results in 865,676–1,233,674
TCO2eq emissions. Similarly, the SCOE-based supply
optimization reduces the total GHG emission to the
range 730,083–1,094,811 TCO2eq.
Conclusions
In this work, efforts have been made to address the fu-ture electricity demand and supply in Niger in an inte-grated and holistic approach. The approach used is a system dynamic model to anticipate future electricity de-mand changes as a result of population growth, urbanization progress, and industrial development. Ref-erence case and probable scenarios were simulated to obtain the projected electricity demand and their
associ-ated renewable energy transition pathways for 2019–
2035. Before simulating the aforementioned scenarios, the electricity demand model was calibrated and vali-dated against the historical trend of electricity consump-tion in the country. The calibraconsump-tion process minimized the MSE between the simulation output and historical data. The MSE of calibration, that is found to be 1.66 kWh, validated the capability of the model in esti-mating the future electricity demand under the given and assumed influencing factor values. From the cali-brated model, it was discovered that a relatively small change in industrialization from the reference case has only a negligible short-term impact. On the other hand, a 20% change in urbanization growth rate will result in a 22% increase of the electricity demand in 2030.
Preceding the electricity demand projection, an opti-mal energy supply to balance the demand was suggested and implemented. In an attempt to realize the most beneficial optimal mix of electricity generation, an SCOE is formulated as the LCOE plus the cost of climate change and air pollution. The SCOE is then used as a basis for setting the performance criteria of supply optimization. As a result, a power grid contributed from a share of 44.22% hydro, 23.04% grid-tied PV, 18.83% coal, and 13.92% diesel was identified for 2030 according to their relative SCOE values. When compared with the GHG emission, the SCOE-based optimized grid results
in 11.26–15.66% less emission than the LCOE-based
op-timized grid during the same period. Moreover, the optimization highlights the need to intensively use the conventional and solar potential in Niger in the near fu-ture to sustain the ever-increasing energy demand. The
proposed grid mix also lessens the country’s actual
elec-tricity import dependency that currently poses serious energy security issues such as electricity price volatility and supply reliability. Likewise, the proposed strategy
helps guide the RE transition pathway in the country with the maximum use of solar PV.
This outcome of the study could help formulate in-novative policy pathways for a sustainable energy supply in Niger. There is a growing trend of recognition for de-veloping reliable and adequate electricity supply schemes
that can balance the country’s future demand. However,
a successful realization of the recognition needs an ad-equate understanding of the underlying relationships among the demand and its influencing factors. A notable requirement is the development of a framework that can link demand and supply. The developed framework needs also to consider the role of an optimized electri-city generation mix for the sake of sustainable develop-ment (urbanization and industrialization) and climate change goals. Unfortunately, the optimized mix grid, in-cluding the alternative energy sources, is not yet consid-ered as a viable energy supply scheme in Niger. This work gives evidence that future RE transition pathways are competitive both from an economical and societal point of view.
Abbreviations
CNES:Centre National d’Énergie Solaire; COAP: Cost of air pollution; COCC: Cost of climate change; GHG: Greenhouse gases; LCOE: Levelized cost of electricity; MSE: Mean square error; NIGELEC: Société Nigérienne d’Electricité; PV: Photovoltaics; RE: Renewable energy; SCOE: Society’s cost of electricity
Acknowledgements
For this work, we are thankful to the solar energy center, CNES, and the electricity company, NIGELEC, for providing the model data. Likewise, the support of colleagues at the University of Niamey in Niger during the field visit is acknowledged.
Authors’contributions
All authors contributed for the modeling and development of the manuscript. All authors read and approved the final manuscript.
Funding
This research was funded by the German Federal Ministry of Education and Research (BMBF) via Project Management Agency DLR.
Availability of data and materials
Data can be shared by requesting the corresponding author.
Ethics approval and consent to participate Not applicable
Consent for publication Not applicable
Competing interests
The authors declare that they have no competing interests.
Author details
1
Institute for Technology and Resources Management in the Tropics and Subtropics (ITT), TH Köln (University of Applied Science), Betzdorfer Strasse 2, 50679 Cologne, Germany.2Institute of Technology, Addis Ababa University,
Received: 6 March 2019 Accepted: 19 July 2019
References
1. Economic and Social Development Plan (ESDP) (2017) Niger renaissance,
https://www.nigerrenaissant.org/sites/default/files/pdf/pdes-summary.pdf. Accessed 21 Feb 2019.
2. Trotter PA, McManus MC, Maconachie R (2017) Electricity planning and implementation in sub-Saharan Africa: a systematic review. Renewable and Sustainable Energy Reviews 74:1189–1209.https://doi.org/10.1016/j.rser.201 7.03.001
3. Sadorsky P (2013) Do urbanization and industrialization affect energy intensity in developing countries? Energy Economics 37:52–59.https://doi. org/10.1016/j.eneco.2013.01.009
4. The World Bank (2019) Country data Niger,https://data.worldbank.org/ country/niger. Accessed 21 Feb 2019.
5. United Nations Economic Commission for Africa (UNECA) (2018) Accelerating SDG 7 achievement, policy briefs in support of the first SDG7 review at the UN high-level political forum,https://sustainabledevelopment. un.org/content/documents/17565PB18.pdf. Accessed 06 Nov 2018. 6. Yu S, Zhu K (2012) A hybrid procedure for energy demand forecasting in
China. Energy 37(1):396–404.https://doi.org/10.1016/j.energy.2011.11.015
7. Li K, Lin B (2017) An application of a double bootstrap to investigate the effects of technological progress on total-factor energy consumption performance in China. Energy 128:575–585.https://doi.org/10.1016/j. energy.2017.04.044
8. Shahbaz M, Salah Uddin G, Ur Rehman I, Imran K (2014) Industrialization, electricity consumption and CO2 emissions in Bangladesh. Renewable and Sustainable Energy Reviews 31:575–586.https://doi.org/10.1016/j.rser.2013.12.028
9. Franco S, Mandla VR, Ram Mohan Rao K (2017) Urbanization, energy consumption and emissions in the Indian context a review. Renewable and Sustainable Energy Reviews 71:898–907.https://doi.org/10.1016/j.rser.2016.12.117
10. Bakirtas T, Akpolat AG (2018) The relationship between energy consumption, urbanization, and economic growth in new emerging-market countries. Energy 147:110–121.https://doi.org/10.1016/j.energy.2018.01.011
11. Zhao P, Zhang M (2018) The impact of urbanisation on energy
consumption: A 30-year review in China. Urban Climate 24:940–953.https:// doi.org/10.1016/j.uclim.2017.11.005
12. Energy Charter (2015) The energy sector of Niger: perspectives and opportunities,https://energycharter.org/fileadmin/DocumentsMedia/ Occasional/Niger_Energy_Sector.pdf. Accessed 21 Feb 2019.
13. NIGELEC (Société Nigerienne d’Electricité) (2018) Database of state utility company for electricity in Niger, Niamey, Niger
14. Monyei CG, Adewumi AO, Obolo MO, Sajou B (2018) Nigeria’s energy poverty: Insights and implications for smart policies and framework towards a smart Nigeria electricity network. Renewable and Sustainable Energy Reviews 81:1582–1601.https://doi.org/10.1016/j.rser.2017.05.237
15. Nigerian Economic Summit Group and Heinrich Böll Stiftung (2017) Comparison of costs of electricity generation in Nigeria,https://ng.boell.org/ sites/default/files/true_cost_of_power_technical_report_final.pdf. Accessed 21 Feb 2019.
16. ECOWAS (2019) Energy ministries in Niger database,http://www.assemblee.ne/. Accessed 21 Feb 2019.
17. Poyry Energy and ECOWAS Centre for Renewable Energy and Energy Efficiency (ECREEE) (2017) Niger Country Report- GIS Hydropower Resource Mapping and Climate Change Scenarios for the ECOWAS Region,http:// www.ecowrex.org/system/files/country_report_10_niger.pdf. Accessed 21 Feb 2019.
18. IRENA (2013a) Niger renewables readiness assessment,https://www.irena. org/-/media/Files/IRENA/Agency/Publication/2013/RRA_Niger.pdf, Accessed 21 Feb 2019.
19. Solargis (2019) Solar resource maps of Niger,https://solargis.com/ maps-and-gis-data/download/nigerAccessed 21 Feb 2019. 20. IRENA (2013b) West African power pool: planning and prospects for
renewable energy,https://www.irena.org/documentdownloads/ publications/wapp.pdf. Accessed 21 Feb 2019.
21. Wagner A (2015) Photovoltaik Engineering. Springer Verlag Berlin, Heidelberg
22. Roumpakias E, Zogou O, Stamatelos A (2015) Correlation of actual efficiency of photovoltaic panels with air mass. Renewable Energy 74:70–77.https:// doi.org/10.1016/j.renene.2014.07.051
23. Notton G, Lazarov V, Stoyanov L (2010) Optimal sizing of a grid-connected PV system for various PV module technologies and inclinations, inverter efficiency characteristics and locations. Renewable Energy 35(2):541–554.
https://doi.org/10.1016/j.renene.2009.07.013
24. Topcu I, Ülengin F, Kabak Ö, Isik M, Unver B, Ekici SO (2018) The evaluation of electricity generation resources: the case of Turkey. Energy.https://doi. org/10.1016/j.energy.2018.10.126
25. Kanitkar T, Banerjee R, Jayaraman T (2018) An integrated modeling framework for energy economy and emissions modeling: a case for India. Energy.https://doi. org/10.1016/j.energy.2018.11.025
26. IRENA (2018) Renewable power generation costs in 2017, International Renewable Energy Agency, Abu Dhabi.https://www. irena.org/-/media/Files/IRENA/Agency/Publication/2018/Jan/IRENA_2 017_Power_Costs_2018.pdf. Accessed 06 Nov 2018.
27. International Energy Agency (IEA) (2015) Projected costs of generating electricity, https://www.oecd-nea.org/ndd/pubs/2015/7057-proj-costs-electricity-2015.pdfAccessed 21 Feb 2019.
28. IPCC (2014). Annex II: Metrics & Methodology, Mitigation of Climate Change,
https://www.ipcc.ch/site/assets/uploads/2018/02/ipcc_wg3_ar5_annex-ii.pdf, Accessed 21 Feb 2019.
29. He Y, Zheng Y, Xu Q (2019) Forecasting energy consumption in Anhui province of China through two Box-Cox transformation quantile regression probability density methods. Measurement.https://doi.org/10.1016/j. measurement.2019.01.008
30. Al-Musaylh MS, Deo RC, Adamowski JF, Li Y (2018) Short-term electricity demand forecasting with MARS, SVR and ARIMA models using aggregated demand data in Queensland, Australia. Advanced Engineering Informatics 35:1–16.https://doi.org/10.1016/j.aei.2017.11.002
31. Bedi J, Toshniwal D (2019) Deep learning framework to forecast electricity demand. Applied Energy 238:1312–1326.https://doi.org/10.1016/j. apenergy.2019.01.113
32. Torrini FC, Souza RC, Cyrino Oliveira FL, Moreira Pessanha JF (2016) Long term electricity consumption forecast in Brazil: a fuzzy logic approach. Socio-Economic Planning Sciences 54:18–27.https://doi. org/10.1016/j.seps.2015.12.002
33. Yang A, Li W, Yang X (2018) Short-term electricity load forecasting based on feature selection and Least Squares Support Vector Machines. Knowledge-Based Systems.https://doi.org/10.1016/j.knosys.2018.08.027
34. He Y, Jiao J, Chen Q, Ge S, Chang Y, Xu Y (2017) Urban long term electricity demand forecast method based on system dynamics of the new economic normal: the case of Tianjin. Energy 133:9–22.
https://doi.org/10.1016/j.energy.2017.05.107
35. Morcillo JD, Franco CJ, Angulo F (2018) Simulation of demand growth scenarios in the Colombian electricity market: an integration of system dynamics and dynamic systems. Applied Energy 216:504–520.https://doi. org/10.1016/j.apenergy.2018.02.104
36. Smit S, Musango JK, Brent AC (2019) Understanding electricity legitimacy dynamics in an urban informal settlement in South Africa: a community based system dynamics approach. Energy for Sustainable Development 49: 39–52.https://doi.org/10.1016/j.esd.2019.01.004
37. Khraief N, Shahbaz M, Mallick H, Loganathan N (2018) Estimation of electricity demand function for Algeria: revisit of time series analysis. Renewable and Sustainable Energy Reviews 82:4221–4234.https:// doi.org/10.1016/j.rser.2016.11.106
38. International Energy Agency (IEA) (2011) Renewable energy markets and prospects by technology,https://www.iea.org/publications/freepublications/ publication/Renew_Tech.pdf. Accessed 21 Feb 2019.
39. Gebretsadik Y, Fant C, Strzepek K, Arndt C (2016) Optimized reservoir operation model of regional wind and hydro power integration case study: Zambezi basin and South Africa. Applied Energy 161:574–582.https://doi. org/10.1016/j.apenergy.2015.09.077
40. François B, Borga M, Creutin JD, Hingray B, Raynaud D, Sauterleute JF (2016) Complementarity between solar and hydro power: sensitivity study to climate characteristics in Northern-Italy. Renewable Energy 86:543–553.
https://doi.org/10.1016/j.renene.2015.08.044
41. Schmidt J, Cancella R, Pereira AO (2016) An optimal mix of solar PV, wind and hydro power for a low-carbon electricity supply in Brazil. Renewable Energy 85:137–147.https://doi.org/10.1016/j.renene.2015.06.010
43. World Bank and Ecofys (2018) State and trends of carbon pricing,https:// openknowledge.worldbank.org/bitstream/handle/10986/29687/9781464812 927.pdf?sequence=5&isAllowed=y. Accessed 21 Feb 2019.
44. Machol B, Rizk S (2013) Economic value of U.S. fossil fuel electricity health impacts. Environment International 52:75–80.https://doi.org/10.1016/j. envint.2012.03.003
45. Campbell, M. (2008) The drivers of the levelized cost of electricity for utility-scale photovoltaics, SunPower Corporation,http://large.stanford.edu/ courses/2010/ph240/vasudev1/docs/sunpower.pdf. Accessed 21 Feb 2019.
Publisher’s Note
![Fig. 2 Electricity import to Niger (based on NIGELEC database) [13]](https://thumb-us.123doks.com/thumbv2/123dok_us/323972.1524874/2.595.58.541.87.236/fig-electricity-import-niger-based-nigelec-database.webp)
![Fig. 3 Flow rate of Niger River in 2015 [16]](https://thumb-us.123doks.com/thumbv2/123dok_us/323972.1524874/3.595.58.541.378.726/fig-flow-rate-niger-river.webp)
![Table 3 Greenhouse gas (GHG) emission rates for variouspower-generation technologies considered [28]](https://thumb-us.123doks.com/thumbv2/123dok_us/323972.1524874/5.595.301.540.690.731/table-greenhouse-emission-rates-variouspower-generation-technologies-considered.webp)


