Open Access
Software article
CHSMiner: a GUI tool to identify chromosomal homologous
segments
Zhen Wang
1,2, Guohui Ding
1,2, Zhonghao Yu
3, Lei Liu*
1,4and Yixue Li*
1,3,4Address: 1Key Lab of Systems Biology, Shanghai Institutes for Biological Sciences, Chinese Academy of Sciences, 320 Yueyang Road, Shanghai
200031, PR China, 2Graduate School of the Chinese Academy of Sciences, Shanghai 200031, PR China, 3College of Life Science & Biotechnology,
Shanghai Jiao Tong University, Shanghai 200240, PR China and 4Shanghai Centre for Bioinformation Technology, 100 Qinzhou Road, Shanghai
200235, PR China
Email: Zhen Wang - zwang01@sibs.ac.cn; Guohui Ding - gwding@sibs.ac.cn; Zhonghao Yu - yuzhonghao@gmail.com; Lei Liu* - leiliu@sibs.ac.cn; Yixue Li* - yxli@sibs.ac.cn
* Corresponding authors
Abstract
Background: The identification of chromosomal homologous segments (CHS) within and between genomes is essential for comparative genomics. Various processes including insertion/ deletion and inversion could cause the degeneration of CHSs.
Results: Here we present a Java software CHSMiner that detects CHSs based on shared gene content alone. It implements fast greedy search algorithm and rigorous statistical validation, and its friendly graphical interface allows interactive visualization of the results. We tested the software on both simulated and biological realistic data and compared its performance with similar existing software and data source.
Conclusion: CHSMiner is characterized by its integrated workflow, fast speed and convenient usage. It will be useful for both experimentalists and bioinformaticians interested in the structure and evolution of genomes.
Background
The identification of chromosomal homologous seg-ments (CHSs) within and between genomes (known as paralogons and syntenies, respectively) is essential for comparative genomics. It can not only help evolutionary biologists to study genome evolution, such as genome duplication and rearrangement [1,2], but also help exper-imental biologists to transfer gene function information from one genome to another. Although extensive gene mutation, deletion, and insertion have made them not always obvious from primary sequences, chromosomal homology can still be revealed by a pair of segments shar-ing a group of homologous genes [3]. Most existshar-ing
pro-grams, including ADHoRe [4], FISH [5] and LineUp [6], look for CHSs based on the conservation of both gene content and order (colinearity). While the approach was sensitive enough for moderate divergence, it has been pointed out conserved gene order may be too strict for more ancient divergence [3], as inversion is another dom-inant force for the degeneration of CHSs. For example, the whole genome duplication in early vertebrate evolution can only be inferred by discarding gene order and consid-ering gene content alone [7]. A pioneconsid-ering implementa-tion of this strategy was CloseUp [8], but some limitaimplementa-tions still exist, especially with the rapid increase of genomic data. First, it used Monte Carlo simulation to estimate the
Published: 15 January 2009
Algorithms for Molecular Biology 2009, 4:2 doi:10.1186/1748-7188-4-2
Received: 21 September 2008 Accepted: 15 January 2009 This article is available from: http://www.almob.org/content/4/1/2
© 2009 Wang et al; licensee BioMed Central Ltd.
statistical significance of identified CHSs, which might no longer be suitable for whole genome sequence analysis, as thousands of annotated genes would make it quite time-consuming. Second, previous tools were mainly devel-oped for computational biologists, which restricted their wide use among experimental biologists.
In our recent project to build a paralog/paralogon data-base EPGD [9], we found it was very necessary to develop a new software that could overcome those weaknesses. Here, we publish it as a complete Java package named CHSMiner. Its core algorithm has been used to construct our database successfully and several improvements were added later as well. In short, it can not only fast identify and evaluate CHSs from whole genome comparison, but also provide a convenient graphical interface for end users to visualize the results.
Implementation
Fast greedy search algorithm
CHSMiner defines CHSs based on shared gene content alone in order to fully exploit potential homology (Figure 1). Two major types of algorithms have been developed for the purpose in previous studies. One is based on the idea of bottom-up merging of smaller clusters (e.g. CloseUp [8]), and the other is based on top-down break-ing the genomes (e.g. HomologyTeams [10]). We adopted the first strategy in CHSMiner because it was more widely used in relevant studies such as revealing ancient genome duplications [7]. Its procedure is also easier to under-stand: starting from two homologous genes, each at a dif-ferent location, it looks for two other homologous genes that are each located within a prespecified distance from the former two ones. This process is iterated until no more additional pairs could be found [2,3]. The only important parameter that should be predefined is the maximal gap
size (number of unmatched genes) allowed between two adjacent matched genes (Figure 1). Another advantage of the algorithm is that the greedy search has a fast computa-tional speed because only a linear scan along a chromo-some is needed.
Formal statistical evaluation
Statistical test is necessary to reduce the false positive seg-ments identified by the search algorithm. A null model commonly used for this purpose is based on randomiza-tion of gene order in the original genome [7]. If the CHS identified is impossible to form in the random genome, we can confirm gene associations within the segment. Pre-vious programmes simulate the null model through per-muting the genome repeatedly, but it is a time-consuming procedure. Fortunately, Hoberman et al. [11] have pre-sented a mathematical treatment for max-gap gene clus-ters. On the basis of their conclusion, CHSMiner performs analytical test that can greatly reduce the computational burden. Specifically, we consider a set of m marked genes forms a cluster with maximal g insertions allowed between two adjacent genes. First, if we assume every fam-ily contains only one gene, the exact probability of observ-ing the cluster in a random genome of n genes is [11]
Next, we consider the general case that a family contains more than one gene. We denote F = {f1, f2, ... fm}, where fj
is the number of genes of the same family with gene j in the cluster. Then the probability above can be corrected as:
Finally, we multiply the probabilities that the cluster is observed in both genomes for comparison, each with parameters (n1, F1) and (n2, F2):
Q(n1, m, g, F1)Q(n2, m, g, F2)
The value reflects the probability that a given CHS with maximal gap size g or smaller is observed in two inde-pendently and randomly ordered genomes. When the size of the CHS m is fixed, the smaller the maximal gap size is, the harder it can be observed. Therefore, the value can be treated as the p-value for the CHS. As a lot of CHSs should be assessed in whole genome comparison, we recom-mend an extra multiple test correction (e.g. Bonferroni correction) to the raw p-values in order to control false positive results.
P n m g n m m g g
m n m ( , , )=( − + − −( ) / )( + ) − ⎛ ⎝ ⎜ ⎞ ⎠ ⎟
1 1 2 1 1
Q n m g F P n m g fj
j m
( , , , )= ( , , )
=
∏
1Definition of CHS Figure 1
Java package and GUI for visualization
CHSMiner is characterized by its graphical interface (Fig-ure 2A) and several convenient feat(Fig-ures for end users include:
i. Automatic data download from Ensembl database [12] for well assembled genomes.
ii. Interactive operations and flexible parameter settings.
iii. Visual display of CHSs from an individual one to the whole genome pattern (Figure 2B, C).
iv. Useful graphic functions. The image can be saved as vector graph format for further edit.
The application was entirely written in Java and distrib-uted as an executable jar package. It could run on any plat-form supporting Java Runtime Environment (1.5 or higher). Full source code and documents are also pro-vided at our web site, and users can access them under GNU General Public License v2.0.
Results and discussion
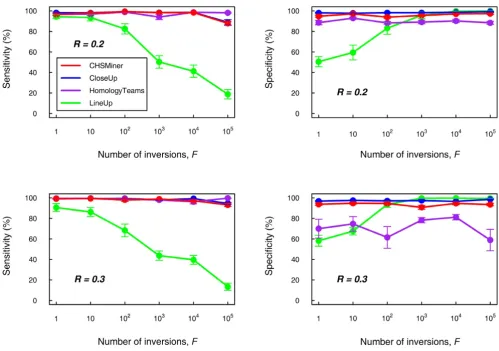
Comparison on simulated dataWe used simulated data to compare CHSMiner with sim-ilar existing software as we can easily observe their per-formance by adjusting the extent of degeneration. We adopted the methods developed by Hampson et al. [8] to simulate two artificial chromosomes that contained a pre-defined CHS (see Methods). The fraction of conserved genes between the CHS was specified as 30%, which was approximate to biological realistic parameters [8]. Another two parameters were changed to adjust the noise against the CHS recognition: (1) background similarity R, and (2) the number of inversions F. Background similarity reflects extensive duplications and transpositions of indi-vidual genes [13]. In this analysis, R = 0.2 and 0.3 were chosen and F was varied between 1 and 105 to rearrange the gene order sufficiently. We compared CHSMiner with three other typical programmes for CHS detection, i.e. LineUp [6], CloseUp [8] and HomologyTeams [10] (Table 1). They were run on the simulated data set with the same parameter settings (see Methods). Both sensitivity and specificity were calculated for the results to evaluate the performance of the four programmes (Figure 3).
It is clear that the sensitivity of the algorithm based on colinearity will become gradually poor with the increase of inversions, whereas the algorithms based on gene con-tent alone are quite robust to the disorders. Homolo-gyTeams has the advantage of finding nonnested regions [14], but its gain of sensitivity is not evident until inver-sions are extremely frequent (>105). In addition, as statis-tical validation is not implemented in HomologyTeams,
its specificity will become quite lower when the back-ground similarity is increased. CHSMiner and CloseUp can always have similar and satisfactory sensitivity and specificity for different R and F, suggesting that the analyt-ical method of CHSMiner works as well as Monte Carlo simulation on empirical data. Nonetheless, CHSMiner is much faster than CloseUp. On a single Pentium processor CloseUp required more than one hour to run the simu-lated data set (1000 permutations for each CHS to get a reliable assessment), whereas CHSMiner took less than one minute. According to our experience, time is an important factor in genome comparison as we usually need to adjust parameters for the program. Thus, our tool greatly improves the efficiency and usability.
Comparison on human-mouse synteny map
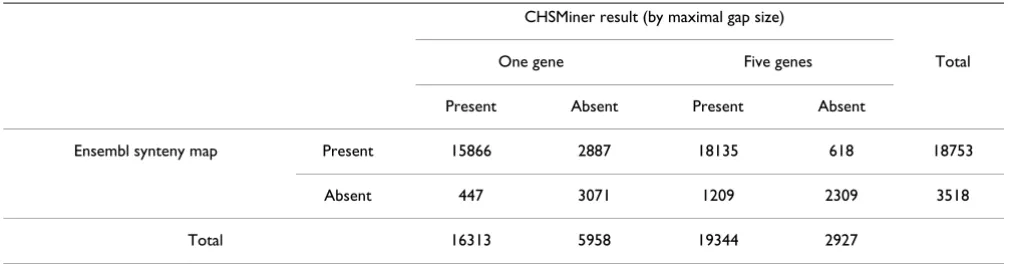
In order to show its performance on real biological data, we used CHSMiner to construct the synteny map for human and mouse. We downloaded homolog informa-tion from Ensembl database [12] and run the program with different maximal gap size. Each synteny detected was evaluated by corrected p-value (Bonferroni method) and only those smaller than 0.05 were preserved. The results were compared with the synteny map provided by Ensembl (release 47), which was generated from primary DNA sequence alignments [15].
We find our result is highly consistent with Ensembl map when the maximal gap size is equal to one gene (Table 2). There are 18753 orthologs present in Ensembl map, where 85% (15866) are found in our result. There are 3518 orthologs absent in Ensembl map, where 87% (3071) are not found in our result either. Furthermore, CHSMiner took only less than one minute to accomplish the analysis. Thus, our software has adequate power in both accuracy and efficiency to carry on large genome comparison.
Graphical display of CHS Figure 2
Conclusion
CHSMiner is designed to identify chromosomal homolo-gous segments based on gene content alone, which ena-bles it to discover highly degenerated homology. Compared with previous tools, it has at least three signif-icant advantages: (1) it has comprised search algorithm, statistical validation and result display in a uniform plat-form; (2) it has improved both accuracy and efficiency; (3) its graphical and interactive interface allows it easy to
use. We hope it will be helpful for biologists who are interested in the structure and evolution of genomes.
Methods
CHS simulationFirst, two artificial chromosomes were created, each con-taining 1000 genes. The background similarity was simu-lated by assigning a gene to be the homolog of some other gene with probability R, regardless of their locations. Then Performance comparison on simulated data
Figure 3
Performance comparison on simulated data. The extent of noise was controlled by the background similarity R and the number of inversions F. For each combination of R and F, 10 samples were simulated. Both sensitivity and specificity were cal-culated for the result of each sample (see Methods). The data point and error bar represent the mean value and the standard error of every percentage.
Table 1: Summary of the four programmes for comparison
Programme CHS definition Search algorithm Statistical evaluation
CHSMiner Gene content Bottom-up Analytical calculation
LineUp Gene colinearity Bottom-up Monte Carlo simulation
CloseUp Gene content Bottom-up Monte Carlo simulation
the middle 20% of the two chromosomes were specified as a known CHS. Within the region, a gene in one chro-mosome would have a corresponding homolog in the other chromosome with probability 0.3. Finally, the inversions were simulated by exchanging two randomly chosen neighbouring gene pairs.
Software comparison
All the four software packages were tested on the simu-lated data set with the same parameter settings, i.e. the gap size should be less than 20 genes and each CHS should have at least 3 matched genes. LineUp was run with inver-sions forbidden. If statistical test was available, each CHS detected was further assessed by corrected p-value (Bonfer-roni method) and only those smaller than 0.05 were pre-served. The sensitivity was calculated as P/TP, where TP
was the number of genes in the predefined CHS (TP = 200) and P was the number detected among them. The specificity was calculated as N/TN, where TN was the number of genes not in the predefined CHS (TN = 800) and N was the number remaining undetected in TN.
Availability and requirements
Project name: CHSMinerProject home page: http://www.biosino.org/papers/ CHSMiner/
Operating system(s): Platform independent
Programming language: Java
Other requirements: JRE 1.5 or higher
License: GNU GPL
Competing interests
The authors declare that they have no competing interests.
Authors' contributions
ZW designed the software, implemented the algorithm and drafted the manuscript. GD conceived of the soft-ware, and participated in its design. ZY participated in the discussion of biological significances. LL and YL revised the manuscript. All authors read and approved the final manuscript.
Acknowledgements
This research was supported by grants from National High-Tech R&D Pro-gram (863): 2006AA02Z334, State key basic research proPro-gram (973): 2006CB910705, 2003CB715901, and Research Program of CAS (KSCX2-YW-R-112).
References
1. Murphy WJ, Larkin DM, Wind A Everts-van der, Bourque G, Tesler G, Auvil L, Beever JE, Chowdhary BP, Galibert F, Gatzke L, et al.:
Dynamics of mammalian chromosome evolution inferred from multispecies comparative maps. Science 2005,
309:613-617.
2. Peer Y Van de: Computational approaches to unveiling ancient genome duplications. Nat Rev Genet 2004, 5:752-763.
3. Simillion C, Vandepoele K, Peer Y Van de: Recent developments in computational approaches for uncovering genomic homology. Bioessays 2004, 26:1225-1235.
4. Vandepoele K, Saeys Y, Simillion C, Raes J, Peer Y Van De: The auto-matic detection of homologous regions (ADHoRe) and its application to microcolinearity between Arabidopsis and rice. Genome Res 2002, 12:1792-1801.
5. Calabrese PP, Chakravarty S, Vision TJ: Fast identification and sta-tistical evaluation of segmental homologies in comparative maps. Bioinformatics 2003, 19(Suppl 1):i74-80.
6. Hampson S, McLysaght A, Gaut B, Baldi P: LineUp: statistical detection of chromosomal homology with application to plant comparative genomics. Genome Res 2003, 13:999-1010. 7. McLysaght A, Hokamp K, Wolfe KH: Extensive genomic
duplica-tion during early chordate evoluduplica-tion. Nat Genet 2002,
31:200-204.
8. Hampson SE, Gaut BS, Baldi P: Statistical detection of chromo-somal homology using shared-gene density alone. Bioinformat-ics 2005, 21:1339-1348.
9. Ding G, Sun Y, Li H, Wang Z, Fan H, Wang C, Yang D, Li Y: EPGD: a comprehensive web resource for integrating and displaying eukaryotic paralog/paralogon information. Nucleic Acids Res 2008, 36:D255-262.
10. He X, Goldwasser MH: Identifying conserved gene clusters in the presence of homology families. J Comput Biol 2005,
12:638-656.
11. Hoberman R, Sankoff D, Durand D: The statistical analysis of spa-tially clustered genes under the maximum gap criterion. J Comput Biol 2005, 12:1083-1102.
Table 2: Number of orthologs covered by Ensembl synteny map and CHSMiner result
CHSMiner result (by maximal gap size)
One gene Five genes Total
Present Absent Present Absent
Ensembl synteny map Present 15866 2887 18135 618 18753
Absent 447 3071 1209 2309 3518
Publish with BioMed Central and every scientist can read your work free of charge "BioMed Central will be the most significant development for disseminating the results of biomedical researc h in our lifetime."
Sir Paul Nurse, Cancer Research UK
Your research papers will be:
available free of charge to the entire biomedical community
peer reviewed and published immediately upon acceptance
cited in PubMed and archived on PubMed Central
yours — you keep the copyright
Submit your manuscript here:
http://www.biomedcentral.com/info/publishing_adv.asp
BioMedcentral
12. Hubbard TJ, Aken BL, Beal K, Ballester B, Caccamo M, Chen Y, Clarke L, Coates G, Cunningham F, Cutts T, et al.: Ensembl 2007. Nucleic Acids Res 2007, 35:D610-617.
13. Gu X, Wang Y, Gu J: Age distribution of human gene families shows significant roles of both large- and small-scale duplica-tions in vertebrate evolution. Nat Genet 2002, 31:205-209. 14. Durand D, Hoberman R: Diagnosing duplications–can it be
done? Trends Genet 2006, 22:156-164.