The Cryosphere, 7, 867–875, 2013 www.the-cryosphere.net/7/867/2013/ doi:10.5194/tc-7-867-2013
© Author(s) 2013. CC Attribution 3.0 License.
EGU Journal Logos (RGB)
Advances in
Geosciences
Open Access
Natural Hazards
and Earth System
Sciences
Open Access
Annales
Geophysicae
Open Access
Nonlinear Processes
in Geophysics
Open Access
Atmospheric
Chemistry
and Physics
Open Access
Atmospheric
Chemistry
and Physics
Open Access
Discussions
Atmospheric
Measurement
Techniques
Open Access
Atmospheric
Measurement
Techniques
Open Access
Discussions
Biogeosciences
Open Access Open Access
Biogeosciences
DiscussionsClimate
of the Past
Open Access Open Access
Climate
of the Past
Discussions
Earth System
Dynamics
Open Access Open Access
Earth System
Dynamics
Discussions
Geoscientific
Instrumentation
Methods and
Data Systems
Open Access
Geoscientific
Instrumentation
Methods and
Data Systems
Open Access
Discussions
Geoscientific
Model Development
Open Access Open Access
Geoscientific
Model Development
Discussions
Hydrology and
Earth System
Sciences
Open Access
Hydrology and
Earth System
Sciences
Open Access
Discussions
Ocean Science
Open Access Open Access
Ocean Science
Discussions
Solid Earth
Open Access Open Access
Solid Earth
Discussions
The Cryosphere
Open Access Open Access
The Cryosphere
Discussions
Natural Hazards
and Earth System
Sciences
Open Access
Discussions
Mass balance, runoff and surges of Bering Glacier, Alaska
W. Tangborn
HyMet Inc., 13629 Burma Rd SW, Vashon Island, WA 98070, USA
Correspondence to: W. Tangborn (hymet01@gmail.com)
Received: 10 October 2012 – Published in The Cryosphere Discuss.: 7 December 2012 Revised: 3 May 2013 – Accepted: 3 May 2013 – Published: 27 May 2013
Abstract. The historical net, ablation and accumulation
daily balances, as well as runoff of Bering Glacier, Alaska are determined for the 1951–2011 period with the PTAA (precipitation-temperature-area-altitude) model, using daily precipitation and temperature observations collected at the Cordova and Yakutat weather stations, together with the area-altitude distribution of the glacier. The model mean annual balance for this 61 yr period is−0.6 m w.e., the accumulation balance is +1.4 and the ablation balance is−2.0 m w.e. Aver-age annual runoff is 2.5 m w.e. Periodic surges of this glacier transport large volumes of ice to lower elevations where the ablation rate is higher, producing more negative balances and increasing runoff. Runoff from Bering Glacier (derived from simulated ablation and precipitation as rain) is highly corre-lated with four of the glacier surges that have occurred since 1951. Ice volume loss for the 1972–2003 period measured with the PTAA model is 2.7 km3w.e. a−1and closely agrees with losses for the same period measured with the geodetic method. It is proposed that the timing and magnitude of daily snow accumulation and runoff, both of which are controlled by the glacier’s area-altitude distribution and are calculated with the PTAA model, can be used to determine the proba-bility that a glacier will surge.
1 Introduction
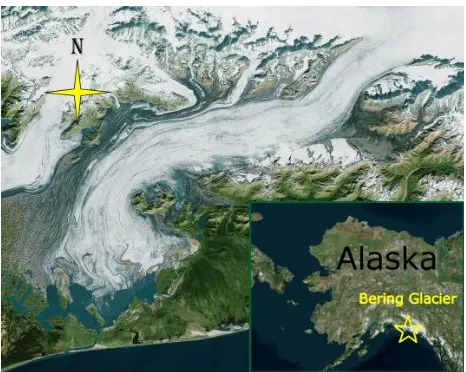
The Bering Glacier/Bagley Icefield in Alaska, the largest glacier/icefield complex in North America, is 180 km in length, ranges from sea level to 2445 m altitude and has a total area of about 4400 km2(Fig. 1). Within the past 100– 200 yr, Bering Glacier began to retreat from its maximum Neoglacial position; however, in the past 100 yr this retreat has been interrupted by at least six surges of substantial am-plitude and duration (Fleisher et al., 2010; Molnia and Post,
1995; Meier and Post, 1969; Burgess et al., 2012). Surges of this glacier influence its mass balance by transporting large masses of ice to lower altitudes, where higher temperatures increase ablation rates (Eisen et al., 2001). During the 1993– 1995 surge, the average ablation balance determined by the PTAA model is−3.3 m w.e., over a meter greater than the 1951–2011 average. Analysis of the link between Bering Glacier surges and englacial (liquid) water storage suggests surges might be predicted by monitoring stream discharge at the terminus (Fleisher et al., 2010; Muskett et al., 2003; Mer-rand and Hallet, 1996; Lingle and Fatland, 2003)
2 The PTAA mass balance model
2.1 Model description
The PTAA (precipitation-temperature-area-altitude) is a rel-atively simple model that requires only daily observations of precipitation and maximum and minimum temperatures col-lected at a standard, usually low-altitude weather station in the region of the glacier, plus the area-altitude distribution of the glacier’s surface. It is similar to a degree-day model only in its weather data requirements; it does not require annual balance measurements for coefficient calibration as does a degree-day model.
Daily meteorological observations are converted to snow and ice ablation and snow accumulation at each area-altitude interval of the glacier by the following procedure:
– Linear regressions are developed between daily values
of seven balance variables for each day of the summer season (approximately 1 June–30 September) (Table 1):
– The daily balance is found by summing the balance for
26 27
Figure 1. Bing satellite image of the Bering Glacier terminus. A portion of
28
the Bagley Ice Field is shown at the top of the image.
29 Fig. 1. Bing satellite image of the Bering Glacier terminus. A
por-tion of the Bagley Ice Field is shown at the top of the image.
j=49(glacier head) (1)
ba(i)=Xba(j )(aa(j )) j=1(terminus),
where ba(i)is daily balance in m w.e., ba(j )is balance for altitude intervaljin m w.e., aa(j )is altitude interval j, in fraction of the total glacier area.
– The daily balance is summed for a year to produce the
annual balance Eq. (2):
Sep 30 (2)
Ba(n)=Xba(i) Oct 1,
where Ba(n)is annual balance for yearnin m w.e. Fifteen coefficients are used in algorithms (equations) to calculate the seven variables (Table 2). Ten linear regressions are run using combinations of the seven balance variables. A regression error is determined for each day of the ablation season (about 1 June–30 September) and averaged for each year. The average error produced by these regressions is min-imized by simultaneously adjusting the coefficients with a simplex, which is a numeric method of solving problems in linear programming (Nelder and Mead, 1965). Minimizing the calibration error also minimizes the error produced by calculating the annual balance from weather observations. It is the combination of these error minimization procedures that is the basis of the PTAA model.
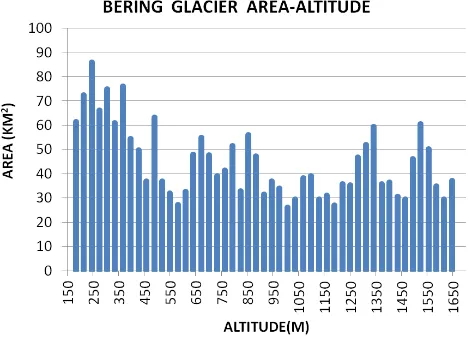
For Bering Glacier, the daily balance is determined using the area-altitude distribution shown in Fig. 2. There are other
Table 1. PTAA model variables.
1. Bc (Snow accumulation) 2. Bs (Ablation)
3. Ba (Balance)
4. SLe (Snowline attitude) 5. Ex (Balance flux)
6. AAR (Accumulation area ratio) 7. ZBA (Zero balance altitude)
Table 2. Mass balance coefficients.
C1,C2,C3converts gauge to glacier precipitation C4ablation mixing factor
C5,C6,C7,C8determines temperature lapse rate C9multiplier for ablation from temperature whenp=0.0 C10multiplier for ablation from temperature whenp >0.0 C11multiplier for ablation due to radiation below snowline C12multiplier for solar radiation
C13multiplier to raise seasonal snowline C14multiplier to raise transient snowline C15multiplier for internal accumulation
AA distributions for Bering Glacier available but this is the only one that is derived from USGS topographic maps and is credible. Also used are the daily temperature and precipi-tation observations at Yakutat and Cordova, Alaska, located approximately 125 km NW and 200 km SE of the glacier ter-minus, and at elevations of 8 and 12 m, respectively.
The PTAA model relies on the climate history that is em-bedded in a glacier’s area-altitude (AA) distribution. The AA distribution is developed by glacier flow and erosion of the underlying bedrock over geologic time, both of which are dependent on long-term-mass balances and on the climate.
The glacier’s surface is therefore a reflection of its bed and holds the key that relates mass balance to the climate. In the calibration process minute alterations are automatically made by the simplex in the input variables of simulated tem-perature and precipitation that are determined by the area and elevation of each AA interval on the glacier’s surface.
2.2 Model calibration
The PTAA model is calibrated by calculating the daily bal-ance for each altitude interval and for each day of the 1951– 2011 period, using 15 coefficients and a simplex optimizing procedure. The simplex automatically and simultaneously calculates optimum values for all 15 coefficients. The annual balance is found by integrating daily balances over one year. The coefficients convert observed precipitation and temper-ature at the two low-altitude weather stations to daily snow accumulation and snow and ice ablation. Physical explana-tions for each coefficient are provided in Tangborn (1999).
W. Tangborn: Mass balance, runoff and surges of Bering Glacier, Alaska 869 3
30 31
Figure 2. Area-altitude distribution of Bering Glacier. There are 49
32
altitude intervals spaced at 30.6 m (100 feet), ranging from 150 to 1650
33
meters in elevation. The total area of this segment is 2193 km2 and
34
includes the most active (surging) area of the glacier. These area
35
distributions do not cover the full range of the glacier area that includes
36
the Bagley Ice Field, but represent the most active (surging) part of the
37
glacier. Latitude 60.302 N Longitude 143.20 W
38 39
1. Introduction
40 41
The Bering Glacier/Bagley Icefield in Alaska, the largest glacier/icefield
42
complex in North America, is 180 kilometers in length, ranges from sea
43
level to 2445 meters altitude and has a total area of about 4400 square
44
kilometers. Within the past 100-200 years, Bering Glacier began to retreat
45
from its maximum Neoglacial position; however, in the past 100 years this
46
retreat has been interrupted by at least six surges of substantial amplitude
47
and duration (Fleisher et al, 2010, Molnia and Post, 1995, Meier and Post,
48
1969). Surges of this glacier influence its mass balance by transporting large
49
masses of ice to lower altitudes where higher temperatures increase ablation
50
Fig. 2. Area-altitude distribution of Bering Glacier. There are 49 altitude intervals spaced at 30.6 m (100 feet), ranging from 150 to 1650 m in elevation. The total area of this segment is 2193 km2and includes the most active (surging) area of the glacier. These area dis-tributions do not cover the full range of the glacier area that includes the Bagley Ice Field. Latitude 60.302◦N Longitude 143.20◦W.
(designated (GS) for Geological Survey). There are 49 in-tervals spaced at 30.48 m (100 feet) with a total area of 2193 km2. The total area defined by Beedle et al. (2008) of the Bering Glacier System (BGS) is 4373 km2or exactly twice the area (within a few km2) of the area in GS, (Beedle et al., 2008). The Bering Glacier System outline includes all ice within the US Board on Geographic Names definition of BGS and excludes nunataks and areas of debris cover).
Each interval of the area-altitude distribution in GS is di-vided by the total area to produce a dimensionless fraction that is used for the model calibration Eq. (3).
The total area of GS is
i=49(1650) (3)
At= X
aai=total area=2193 km2 i=1(terminus),
aafis aai/Atwhere aaf is fraction of total area for intervali, aaiis area of intervaliin km2,Atis area of GS in km2.
The area for each interval in BGS is found by scaling the total area (4373 km2) with GS (which assumes the area dis-tribution pattern in BGS is approximately equal to the distri-bution in GS) Eq. (4).
AAi =aaf(BGS),
where AAiisarea of intervaliin km2; therefore, for BGS:
i=49(1650) (4)
AT =XAAi =total area=4373 km2 i=1(terminus).
The area intervals, AAi,i= 1,49 are then used for deter-mining optimum coefficients to calculate the annual balance. The initial 15 (n) coefficient values are random estimates, based on a physically real range of potential values for each parameter. For example, the coefficient that converts gauge precipitation to glacier precipitation is assigned 16 (n+1) different values that vary from 0.100 to 0.300. The final value after 350 iterations and the calibration completed is 0.2007 (a noteworthy finding is that the coefficients must be calculated to 16 decimal places or the simplex will not close). Similar estimates are made for initial values of the other 14 coeffi-cients. The annual balances shown for each iteration in Fig. 3 are based on the initial coefficient estimates of the 16 coef-ficients. The first 16 balances vary from approximately−1.5 to +2.0 m w.e. corresponding to the initial, pre-set coefficient values. As the calibration proceeds, coefficient values are de-termined automatically by the simplex.
One iteration of the simplex determines for each elevation level the daily and annual balances for the period of record, and calculates the average error that occurs when multiple balance parameters are regressed against each other. The average root-mean-square-error resulting from these regres-sions is minimized by the simplex to obtain optimum coeffi-cient values. The size of the error automatically determines the minute adjustment that is made to each coefficient for the next iteration. After approximately 350 iterations, the cali-bration error usually reaches a minimum (in this case about 45 %), and the mean annual balance is an optimum value (in this case about−0.6 m w.e.). The PTAA model is based on minimizing the regression errors averaged for ten pairs of two related balance variables using the same meteorological observations for all calculations. These regression errors pre-dict the error that is produced when a glacier’s mass balance is calculated from weather observations.
The scatter plot in Fig. 4 shows the mean annual balance versus the corresponding error for each iteration. When the error is a minimum at 45 %, the mean annual balance is
−0.60 m w.e. For most glaciers that have been studied the balance-error distribution shows a more distinct mean bal-ance value. The immense size of the Bering Glacier may tend to reduce the balance-error distinction and make the deter-mined mean annual balance less definite. The curvature of balance versus error envelope in Fig. 4 is low, suggesting a large balance error. Other glaciers in this study have a more well-defined balance-error distribution than Bering Glacier (www.ptaagmb.com).
3 Mass balance results
870 W. Tangborn: Mass balance, runoff and surges of Bering Glacier, Alaska 8
202
Figure 3. Mean annual balance versus iteration number of the
203
optimizing simplex. Balances 1-15 are derived from preset coefficients.
204
Balances 16-400 are calculated automatically from coefficients
205
determined by the simplex optimizing process. When the calibration
206
error reached a minimum, the average annual balance is -0.6 mwe, or
207
-26.4 km3 for the 1951-2011 period.
208 209
The scatter plot in Figure 4 shows the mean annual balance versus the
210
corresponding error for each iteration. When the error is a minimum at 45%,
211
the mean annual balance is -0.60 mwe. For most glaciers that have been
212
studied the balance- error distribution shows a more distinct mean balance
213
value. The immense size of the Bering Glacier may tend to reduce the
214
balance-error distinction and make the determined mean annual balance less
215
definite. The curvature of balance versus error envelope in Figure 4 is low
216
suggesting a large balance error. Other glaciers in this study have a more
217
well-defined balance-error distribution than Bering Glacier
218
(www.ptaagmb.com).
219 220 221
Fig. 3. Mean annual balance versus iteration number of the op-timizing simplex. Balances 1–15 are derived from preset cients. Balances 16–400 are calculated automatically from coeffi-cients determined by the simplex optimizing process. When the cal-ibration error reached a minimum, the average annual balance was −0.6 m w.e., or−26.4 km3for the 1951–2011 period.
9
222 223
Figure 4. Mean annual balance versus calibration error. When the
224
calibration error reached the minimum of about 45%, the average
225
annual balance is -0.6 mwe. Each point represents the mean annual
226
balance based on one year of daily balance determinations.
227 228
3.1 Mass Balance Results
229 230
The immense area of Bering Glacier precludes annual balance
231
measurements by traditional means, i.e. by measuring snow density in snow
232
pits and setting ablation stakes. The alternatives are geodetic volume
233
measurements or a physical model, such as the PTAA model. A degree-day
234
type model is not appropriate for this glacier because manually measured
235
annual balances are not available.
236 237
The annual balance for Bering Glacier for each year of the 1951-2011
238
period is calculated with the PTAA model using two low-elevation weather
239
stations (Figure 5). The average Net annual balance for 61 years is –0.6
240
mwe, the mean Accumulation balance is +1.4 mwe and the Ablation balance
241
is –2.0 mwe (Figure 6).Total thinning averaged over the glacier surface for
242
Fig. 4. Mean annual balance versus calibration error. When the cal-ibration error reached the minimum of about 45 %, the average an-nual balance is−0.6 m w.e. Each point represents the mean annual balance based on one year of daily balance determinations.
not appropriate for this glacier because manually measured annual balances are not available.
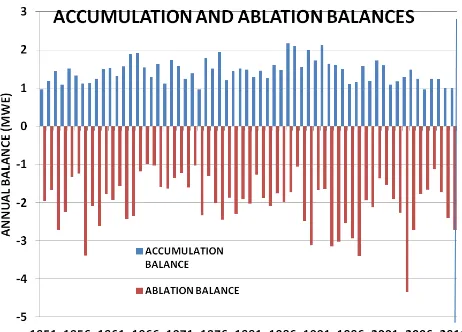
The annual balance for Bering Glacier for each year of the 1951–2011 period is calculated with the PTAA model using two low-elevation weather stations (Fig. 5). The av-erage net annual balance for 61 yr is−0.6 m w.e., the mean accumulation balance is +1.4 m w.e. and the ablation bal-ance is −2.0 m w.e. (Fig. 6). Total thinning averaged over the glacier surface for 61 yr is 39 m of ice or 0.6 m of ice per year (Fig. 7). The net balance is equal to the accumula-tion minus the ablaaccumula-tion balance, or (bn=bw−bs), wherebn isP
baa, andbaais balance at area-altitude fraction aa. An advantage of the PTAA model is that it produces daily
bal-61 years is 39 meters of ice or 0.6 meters of ice per year (Figure 7). The net
243
balance is equal to the Accumulation minus the Ablation balance, or
244
(bn = bw – bs), where bn = ∑ baa , and baa = balance at area-altitude fraction
245
aa.
246 247
248 249
Figure 5. Annual balance of the Bering Glacier for the 1951-2011
250
period. The average annual balance is –0.6 mwe. The minimum balance
251
for the period (-3.1 mwe) occurred in 2004.
252 253
An advantage of the PTAA model is that it produces daily balances for each
254
area-altitude interval and for the total glacier, therefore balance results can
255
be clearly displayed in a format similar to hypothetical daily balances
256
suggested in earlier publications (Meier, 1962, Anonymous, 1969 and Mayo
257
et al, 1972). The terms Accumulation and Ablation balance were introduced
258
in Tangborn and Rana (2000) to reduce the confusion caused by cumulative
259
snowfall in the Himalayas during the monsoon season of June-September
260
being designated Winter Balance. Also, ablation at lower elevations in the
261
Himalayas often occurs during the winter months, therefore Summer
262
Balance is incorrect.
263
Fig. 5. Annual balance of the Bering Glacier for the 1951–2011 period. The average annual balance is−0.6 m w.e. The minimum balance for the period (−3.1 m w.e.) occurred in 2004.
11
264
265
Figure 6. Accumulation and Ablation Balances for the 1951-2011
266
period. The average annual Accumulation balance for this period is +1.4
267
and the average Ablation balance is –2.0 (mwe). Maximum ablation
(-268
4.3 mwe) occurred in 2004.
269 270 271
Fig. 6. Accumulation and ablation balances for the 1951–2011 pe-riod. The average annual accumulation balance for this period is +1.4 and the average ablation balance is−2.0 (m w.e.). Maximum ablation (−4.3 m w.e.) occurred in 2004.
ances for each area-altitude interval and for the total glacier, therefore balance results can be clearly displayed in a for-mat similar to hypothetical daily balances suggested in ear-lier publications (Meier, 1962; Anonymous, 1969 and Mayo et al., 1972). The terms accumulation and ablation balance were introduced in Tangborn and Rana (2000) to reduce the confusion caused by cumulative snowfall in the Himalayas during the monsoon season of June–September being desig-nated “winter balance”. Also, ablation at lower elevations in the Himalayas often occurs during the winter months, there-fore “summer balance” is incorrect.
W. Tangborn: Mass balance, runoff and surges of Bering Glacier, Alaska 871
temperatures at a nearby weather station (or an average of two stations) and the area-altitude distribution of the glacier’s surface. For some glaciers, the weather stations can be as far as 300 km from the glacier but usually the distance is closer to 100 km or less. The area-altitude distribution (hypsome-try) is developed from DEM models or topographic maps. A finely divided area interval produces the most accurate re-sults, e.g. a 10 m interval between areas is preferable to 50 m.
3.1 Validation
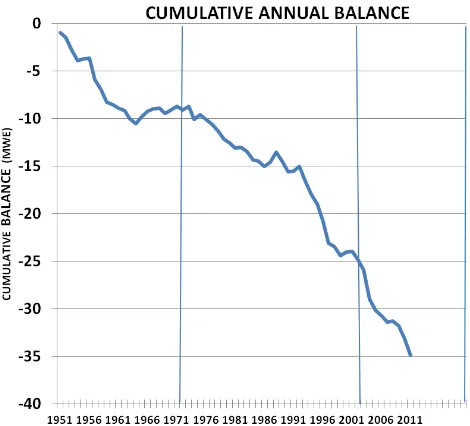
The elevation change and volume loss of Bering Glacier have been estimated by different authors using remote-sensing techniques (Arendt et al., 2002; Beedle et al., 2008; Mus-kett et al., 2009; Berthier et al., 2010; Berthier, 2010). For the period 1972–2003, using the 1972 USGS map as a ref-erence and a glacier area of 4400 km2, the geodetic method (ASTER DEM), volume loss for the entire Bering Glacier system equaled 2.6±0.5 km3w.e. a−1(Berthier, 2010). For the same 31 yr period, the PTAA model cumulative balance change (Fig. 4), using an area of 4373 km2, is−16.8 m w.e. or−0.54 m w.e. a−1or−2.4 km3w.e. a−1, slightly less than the rate of volume loss determined by the geodetic method (Fig. 7).
The PTAA model was first applied to determine an-nual balances of Columbia Glacier in Alaska (Tangborn, 1997), and to South Cascade Glacier where it was compared with manually measured balances for the 1959–1996 period (Tangborn, 1999). It was used to calculate the mass balance and runoff of the debris-covered Langtang Glacier, located in the Himalayan Range in Nepal (Tangborn and Rana, 2000). The PTAA model has also been applied to two other glaciers in Alaska (Gulkana and Wolverine to determine annual bal-ances that are then compared with manual balbal-ances measured by the USGS (Bhatt et al., 2007; Korn, 2010; Zhang, et al., 2007a, b)). Application to the north-facing and south-facing glaciers in the Wrangell Range in Alaska, provides an insight into the cause of ablation variations and suggests a causal link between ablation of Wrangell glaciers and global tem-perature anomalies (Tangborn, 2012).
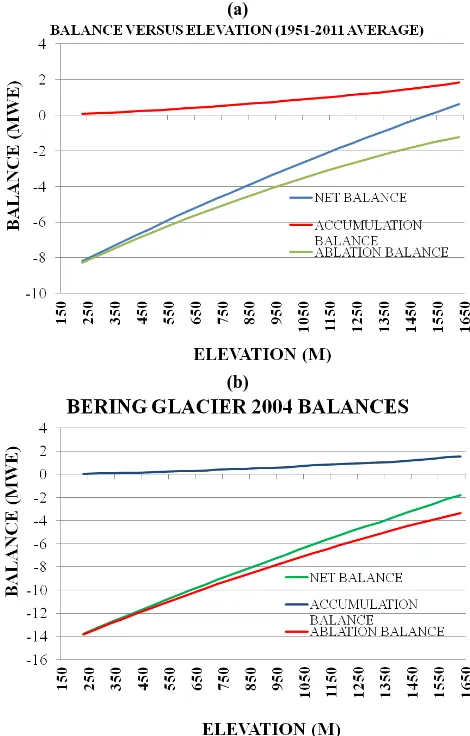
3.2 Balance versus elevation
As are most temperate glaciers, Bering Glacier mass bal-ance is dependent on elevation, varying from less than an average of −8 m w.e. at the terminus to an accumulation balance of over 2 m w.e. at 1600 m. Thus, there is a min-imum of 2 m of ice (4.4 km3) added to the surface of the upper glacier (above the ELA) each year that provides the ice mass to feed a surge if we assume 2 m as a minimum of net accumulation in the entire glacier basin above the mean ELA at 1550 m. This gives a volume accumulation of 4.4 km3 (2 m w.e.×2200 km2), which is the entire glacier area above the mean ELA. Therefore, the balance-altitude
12
272 273
Figure 7
. Cumulative balance of Bering Glacier. Total thinning during274
this 61-year period is 39 meters or 0.6 m of ice per year. The vertical
275
lines at 1972 and 2003 delineate the period for which the volume loss
276
determined by the PTAA and geodetic methods is compared. Volume
277
loss for this 31-year period determined geodetically is 2.6 +/- 0.5 km3 we
278
a-1. The PTAA model loss for the same period is -16.8 mwe
279
(-0.54 mwe a-1 or -2.4 km3 we a-1).
280 281 282
The PTAA model was developed as an alternative to other methods of
283
measuring glacier mass balances. One of its advantages is that the only data
284
requirements are daily observations of precipitation, and maximum and
285
minimum temperatures at a nearby weather station (or an average of two
286
stations) and the area-altitude distribution of the glacier’s surface. For some
287
glaciers the weather stations can be as much as 300 km from the glacier but
288
usually the distance is closer to 100 km or less. The area-altitude distribution
289
(hypsometry) is developed from DEM models or topographic maps. A finely
290
Fig. 7. Cumulative balance of Bering Glacier. Total thinning dur-ing this 61 yr period is 39 m or 0.6 m of ice per year. The verti-cal lines at 1972 and 2003 delineate the period for which the vol-ume loss determined by the PTAA and geodetic methods is com-pared. Volume loss for this 31 yr period determined geodetically is 2.6±0.5 km3w.e. a−1. The PTAA model loss for the same period is−16.8 m w.e. (−0.54 m w.e. a−1or−2.4 km3w.e. a−1).
gradient,b(z), is considered to be a factor for determining the probability that a glacier will surge.
The net, accumulation and ablation balances as a function of elevation are shown in Fig. 8a, averaged for the 1951– 2011 period, and in Fig. 8b for the 2004 balance year. The widespread forest fires in Alaska in 2004 emitted ash and par-ticulates that decreased the albedo of the glacier surface and strongly affected mass balances (Figs. 5 and 6). The contrast betweenb(z)curves in Fig. 8a and b demonstrates how ab-lation and the ELA of Bering Glacier were affected by these wildfires and by higher than normal temperatures during the 2004 summer. Ablation at the terminus increased from an av-erage of 5 m w.e. to 14 m w.e. and the ELA moved up 300 m, from 1550 m average elevation to 1850 m in 2004. The an-nual balance in 2004 (−3.1 m w.e.) is the most negative for the 1951–2011 period of record.
3.3 Real-time glacier balances
872 W. Tangborn: Mass balance, runoff and surges of Bering Glacier, Alaska
(a)
area above the mean ELA. Therefore, the balance-altitude gradient, b(z), is
331
considered to be a factor for determining the probability that a glacier will
332
surge.
333
The Net, Accumulation and Ablation balances as a function of elevation
334
are shown in Figure 8a, averaged for the 1951-2011 period, and in Figure 8b
335
for the 2004 balance year. The widespread forest fires in Alaska in 2004
336
emitted ash and particulates that decreased the albedo of the glacier surface
337
and strongly affected mass balances (Figures 5 and 6). The contrast between
338
b(z) curves in Figures 8a and 8b demonstrates how ablation and the ELA of
339
Bering Glacier were affected by these wildfires and by higher than normal
340
temperatures during the 2004 summer. Ablation at the terminus increased
341
from an average of 5 mwe to 14 mwe and the ELA moved up 300 m, from
342
1550 m average elevation to 1850 m in 2004. The annual balance in 2004
343
(-3.1 mwe) is the most negative for the 1951-2011 period of record.
344 345
346 347
Figure 8a. Net, Accumulation and Ablation balances of Bering Glacier
348
as a function of elevation, averaged for the 1951-2011 period. The ELA
349
(1550 meters) is defined as the point at which the Net balance crosses
350
the zero balance line.
351
(b)
15
352
353 354
Figure 8b.Net, Accumulation and Ablation balances of Bering Glacier
355
as a function of elevation, averaged for 2004. The ELA is 1850 meters,
356
300 meters above average. The balance at the terminus (-14 mwe) is
357
nearly 3 times as negative as on a normal year.
358 359
3.4 Real-time Glacier Balances
360 361
The daily mass balances (Net, Accumulation and Ablation) are calculated
362
continuously throughout the period of record, and can be determined for any
363
day if the meteorological observations are available in real-time. One goal of
364
this project is to continuously monitor all the glaciers in the study
365
(eventually 200) and display the current mass balance of each one, in
real-366
time, if up-to-date weather observations are available, or near real-time if
367
weather observations are delayed. The daily balances for the 2011 balance
368
year shown in Figure 9 demonstrate how real-time mass balances for Bering
369
Glacier will be displayed in future years.
370
For example, on September 30, 2011, the Net Balance is -1.7 mwe, the
371
Accumulation Balance, 1.0 mwe, and the Ablation Balance, -2.7 mwe.
372
Fig. 8. (a) Net, accumulation and ablation balances of Bering Glacier as a function of elevation, averaged for the 1951–2011 pe-riod. The ELA (1550 m) is defined as the point at which the net balance crosses the zero balance line. (b) Net, accumulation and ablation balances of Bering Glacier as a function of elevation, av-eraged for 2004. The ELA is 1850 m, 300 m above average. The balance at the terminus (−14 m w.e.) is nearly 3 times as negative as on a normal year.
how real-time mass balances for Bering Glacier will be dis-played in future years.
For example, on 30 September, 2011, the Net Balance is
−1.7 m w.e., the Accumulation Balance, 1.0 m w.e., and the Ablation Balance,−2.7 m w.e. Simultaneous analysis of the daily balances of a large number of glaciers will be applied to provide an improved understanding of glacier/climate re-lationships.
3.4 Bering surges, snow accumulation and runoff
Englacial (liquid) water storage in a temperate glacier is cal-culated by input and output observations of precipitation and runoff (Tangborn et al., 1972) and is considered a critical
fac-16
Simultaneous analysis of the daily balances of a large number of glaciers 373
will be applied to provide an improved understanding of glacier/climate 374
relationships. 375
376 377
378 379
Figure 9. Daily balances of Bering Glacier during the 2011 balance
380
year. The final net balance for 2011 on September 30 equals -1.7 mwe,
381
the Accumulation Balance is 1.0 and the Ablation balance is -2.7 mwe.
382
Snow accumulation on Bering Glacier begins on approximately August
383
1 each year, thus “winter” balance is a misnomer for this glacier.
384 385
3.5 Bering Surges, Snow Accumulation and Runoff
386 387
Englacial (liquid) water storage in a temperate glacier is calculated by 388
input and output observations of precipitation and runoff (Tangborn, et al, 389
1972) and is considered a critical factor in glacier surges (Kamb, 1987, 390
Merrand and Hallet, 1996, Fatland and Lingle, 1998). During the 1993-95 391
surge of Bering Glacier, downward movement of englacially stored water 392
produced a failure of subglacial till causing rapid basal sliding (Lingle and 393
Fig. 9. Daily balances of Bering Glacier during the 2011 bal-ance year. The final net balbal-ance for 2011 on 30 September equals −1.7 m w.e., the accumulation balance is 1.0 and the ablation bal-ance is−2.7 m w.e. Snow accumulation on Bering Glacier begins on approximately 1 August each year, thus “winter” balance is a misnomer for this glacier.
tor in glacier surges (Kamb, 1987; Merrand and Hallet, 1996; Fatland and Lingle, 1998). During the 1993–1995 surge of Bering Glacier, downward movement of englacially stored water produced a failure of subglacial till, causing rapid basal sliding (Lingle and Fatland, 2003). One year after the surge began in 1993, an outburst of pressurized subglacial water temporarily halted sliding and slowed the ice front advance (Fleisher et al., 2010). Measurements of water discharge at the terminus during surges indicate that high rates of dis-charge are associated with major surge events (Merrand and Hallet, 1996).
Runoff during the summer months for most Alaska glaciers that extend to lower elevations often exceeds 2 m due to high ablation rates. During quiescent phases, the basal hy-draulic system of a glacier has the ability to develop a chan-nelized drainage system that allows rapid flows and prevents hydraulic pressurization of the bed (Rothlisberger, 1972).
W. Tangborn: Mass balance, runoff and surges of Bering Glacier, Alaska 873
When critical mass has accumulated, a surge is triggered by an influx of water (runoff plus release of englacial storage) to the glacier bed and the storage reservoir of ice on the upper glacier is depleted. These two phenomena (snow accumula-tion and runoff) tend to be mutually exclusive; high rates of snowfall and runoff from ablation and precipitation as rain usually do not occur simultaneously. Therefore, the timing of snow accumulation and runoff is critical for a surge to oc-cur. The area-altitude distribution of the glacier surface con-trols both snow accumulation and runoff, therefore is also a determining factor that causes a glacier to surge12. Mass bal-ance has been shown to be an influential factor for surges of glaciers in Svalbard (Dowdeswel et al., 1995).
For Bering Glacier, the mass accumulation of snow at higher elevations is nearly continuous at higher elevations. Snow accumulation, estimated at each elevation level of the glacier, is derived from temperature and precipitation obser-vations at the two weather stations. If the calculated tem-perature (based on the simulated lapse-rate) at the interval elevation is equal or less than 0◦C, precipitation occurs as snow; if it is greater than zero, precipitation occurs as rain. Total annual snow accumulation on the glacier is determined by summing each elevation estimate of snow beginning on 1 October each year. Therefore, the runoff and snow accu-mulation curves shown in Fig. 10 are related by both precip-itation and temperature variations. Runoff during the 1994 surge was measured together with sediment discharge into Vitus Lake (Merrand and Hallet, 1996). A peak discharge of 1800 m3s−1occurred in August, five times the estimated av-erage discharge. A large proportion of the discharge peak is water released from englacial storage although the amount and timing is unknown.
Surges of Bering Glacier can produce an ice displacement as much as 13 km from mid-glacier to the terminus (Post, 1972). Transporting large volumes of ice to a lower and warmer elevation over a short time period (several months) increases the ablation rate and alters the mass balance and runoff of a glacier. Observed surges occurred in 1958–1960, 1966–1967, 1981, 1993–1995 and 2008–2011 (Molnia and Post, 2010). An increase in runoff caused by increased abla-tion during these periods would therefore be expected if there is a large transport of ice to lower elevations during a surge.
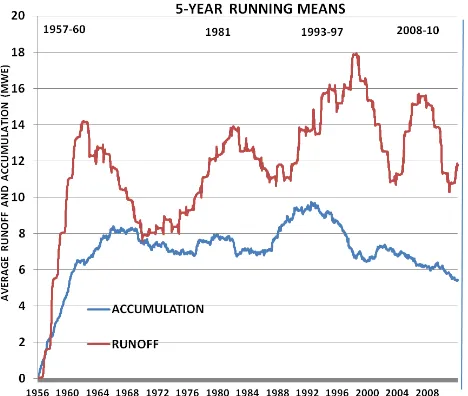
A plot of Bering Glacier cumulative 5 yr running mean of both runoff and snow accumulation, shown in Fig. 10, sug-gests a causal relationship between surges and runoff. A no-table exception is the 1966–1967 surge that did not increase
1A preliminary report. Tangborn, W. V.: Connecting winter
bal-ance and runoff to surges of the Bering Glacier, Alaska, Alaska, A preliminary report, HyMet Inc., Seattle, W.A., http://www.hymet. com, 2002.
2A preliminary report. Tangborn, W. V.: Mass balance, runoff
and internal water storage of the Bering Glacier, Alaska (1950– 1996), A preliminary report, Hymet Inc., Seattle, W. A., http://www. hymet.com, 1999.
19
movement restarted and the surge continued throughout 1995 (Fleisher et al
474
1995). Runoff during the 1993-95 surge was greater than for the other three
475
as indicated in Figure 10, and is likely due to greater release of englacial
476
storage during this surge.
477 478
479 480
Figure 10. Five-year running mean of daily runoff (ablation plus
481
precipitation as rain) and snow accumulation on Bering Glacier, and 482
timing of four of the observed surges since 1951. The 1966-67 surge 483
appears not to have affected runoff. 484
485
1 A preliminary report. Tangborn, W. V.: Connecting winter balance and runoff to surges
486
of the Bering Glacier, Alaska, Alaska, A preliminary report, HyMet Inc., Seattle, W.A., http: 487
//www.hymet.com, 2002.
488
2 A preliminary report. Tangborn, W. V.: Mass balance, runoff and internal water storage
489
of the Bering Glacier, Alaska (1950–1996), A preliminary report, Hymet Inc., Seattle, W. A.,
490
http://www.hymet.com, 1999.
491 492 493 494 495
Fig. 10. Five-year running mean of daily runoff (ablation plus pre-cipitation as rain) and snow accumulation on Bering Glacier, and timing of four of the observed surges since 1951. The 1966–1967 surge appears not to have affected runoff.
runoff, although it was not observed and only indirect infor-mation regarding this surge is available (Fleisher et al., 2010; P. J. Fleisher, personal communication, 2013). The relation-ship between surges and snow accumulation is less clear. However, there is a pronounced increase in snow accumu-lation in the mid-1990s that is a precursor and appears to be one of the main causes of the 1993–1997 surge. Each point on these curves represents cumulative runoff or snow accu-mulation averaged for the previous 5 yr. For example, on 1 October 1981, a total of 14 m w.e. runoff had occurred over the previous 5 yr, or 2.8 m w.e. per year. Also shown is the timing of four of the five observed surges since 1951. Peak runoff occurs near the midpoint of each surge.
Cumulating daily snowfall averaged over the total glacier area in 5 yr running averages demonstrates the variations in glacier mass that have occurred throughout the period of record, 1956–2011. The pattern of the running accumulation balance differs from the runoff pattern. Bering surges are a reflection of these differences, confirming that surges are ini-tiated by a build-up of mass, then proceed by the introduction of bed-lubricating water.
A surge usually ends when there is a rapid release of stored water (j¨okulhlaup) that depletes the water supply for bed lubrication. Basal glide from water lubrication for surg-ing glaciers in Iceland is suggested by a general lack of push-moraine formation in front of an advancing terminus (Bjornsson, 1998). It was first thought that the July 1994 ob-served Bering Glacier j¨okulhlaup was a surge-ending event because ice velocities decreased following the onset of the
j¨okulhlaup. However, rapid ice movement restarted and the
Runoff during the 1993–1995 surge was greater than for the other three as indicated in Fig. 10, and is likely due to greater release of englacial storage during this surge.
4 Discussion
4.1 Terminology
Mass balance terminology used in this report deviates from that proposed by the IACS Working Group of Mass Bal-ance Terminology and Methods (Cogley et al., 2011), and more closely follows the mass balance definitions proposed in Meier (1962), Anonymous (1969), and Mayo et al. (1972). Depicting elevation as dependent on mass balance as sug-gested on Fig. 8 in the IACS report creates a problem for modeling mass balance based on meteorological observa-tions. There are eighteen algorithms used in the PTAA model to generate daily balances (Tangborn, 1999). A PDF of this paper is on www.ptaagmb.com (under How It Works). Four-teen of them incorporate elevation in the equation that de-termines daily balance from weather observations (Eq. 1, 2, 4–9, 12–18). It would not be possible to make these calcu-lations if elevation is treated as the dependent variable. Af-ter the daily and annual balances have been deAf-termined the results can of course then be plotted with elevation as the dependent variable as is suggested in Cogley et al. (2011).
The terms accumulation balance and ablation balance are preferred over winter balance and summer balance that are used in the IACS report. For most Alaskan glaciers, snow accumulation at higher elevations occurs throughout the year and can be especially heavy in August and September (Fig. 9). For many Himalayan Range glaciers, snow accumu-lation is greatest during the summer months of the monsoon season, from June through September. At lower elevations in the Himalayas, ablation often occurs during the winter months (Tangborn and Rana, 2000).
4.2 Verification of the PTAA model
The accuracy of annual balance results produced by the PTAA model is verified by comparing the annual with mea-sured balances recorded for four glaciers, three of them lo-cated near Bering Glacier. Additional comparisons will be shown when measured balance records become available for other glaciers. Comparisons made for PTAA and measured net, accumulation and ablation balances for 50–60 yr peri-ods for the Gulkana, Wolverine, Lemon Creek and Vernagt glaciers can be viewed on www.ptaagmb.com.
4.3 Runoff and observed surges
Average runoff from Bering Glacier is estimated with the PTAA model by the sum of simulated ablation and precip-itation as rain (the release of water from englacial storage is disregarded for a long-term average):
r = a + pr, where r is runoff, a is ablation, pris precipitation as rain, all in units of length averaged over the glacier area. One millimeter of runoff per year averaged over 4440 km2 equals an average discharge rate of 0.15 m3s−1, thus 2.5 m of runoff per year (approximately the long-term average) equals 375 m3s−1. Based on a 60 yr meteorological record, approx-imately 20 % (75 m3s−1) of mean simulated discharge is due to precipitation as rain and 80 % due to ablation.
4.4 Validation
Ice volume loss averaged for the 1972–2003 period, deter-mined by the PTAA model and the geodetic method, av-erages 2.4 km3 and 2.6 km3, respectively, each year. Both methods contribute to the difference, 0.2 km3; consequently the PTAA model error is less than 0.2 km3(1.4 m w.e.). The average PTAA model error for this 31 yr period is therefore less than 1.4 m w.e. For comparison, the root mean square error for predicting annual balances of the Gulkana Glacier, based on balances measured by the USGS, is about 1.5 m w.e. (Fig. 9b on the Gulkana report at www.ptaagmb.com).
5 Conclusions
The daily and annual mass balance of Bering glacier for the 1951–2011 period is calculated with the PTAA model us-ing low-altitude weather observations and the glacier’s area-altitude distribution. Validation of the model balance is made by comparison with the geodetic balance determined for the 1972–2003 period. Based on these results, we conclude that the timing and magnitude of daily snow accumulation and runoff, both of which are controlled by the glacier’s area-altitude distribution and are calculated with the PTAA model, could be used to determine the probability that Bering Glacier will surge.
Acknowledgements. Austin Post’s in-depth knowledge of Bering Glacier and his guidance for the past half-century is gratefully acknowledged. Reviews by Matthew Beedle, Etienne Berthier, Jay Fleisher, Craig Lingle, Robert McNabb, Mauri Pelto and Al Rasmussen all contributed to improving this paper. Funding for this project was provided by HyMet Inc.
Edited by: J. O. Hagen
References
Anonymous: Mass Balance Terms, J. Glaciol., 8, 3–7, 1969. Arendt, A. A., Echelmeyer, K. A., Harrison, W. D., Lingle, C. S.,
and Valentine, V. B.: Rapid wastage of Alaska glaciers and their contribution to rising sea level, Science, 297, 382–386, 2002. Beedle, M. J., Dyurgerov, M., Tangborn, W., Khalsa, S. J. S.,
W. Tangborn: Mass balance, runoff and surges of Bering Glacier, Alaska 875
of Bering Glacier System, Alaska, The Cryosphere, 2, 33–51, doi:10.5194/tc-2-33-2008, 2008.
Berthier, E.: Volume loss from Bering Glacier (Alaska), 1972– 2003: comment on Muskett and others (2009), J. Glaciol., 56, 555–557, 2010.
Berthier, E., Schiefer, E., Clarke, G. K. C., Menounos, B., and R´emy, F.: Contribution of Alaskan glaciers to sea-level rise de-rived from satellite imagery, Nat. Geosci., 3, 92–95, 2010. Bhatt, U. S., Zhang, J., Tangborn, W. V., Lingle, C. S., and Phillips,
L.: Examining Glacier Mass Balances with a Hierarchical Mod-eling Approach, Comp. Sci. Eng., 9, 61–67, 2007.
Bjornsson, H.: Hydrological characteristics of the drainage system beneath a surging glacier, Nature, 395, 771–774, 1998.
Burgess, E. W., Forster, R. R., Larsen, C. F., and Braun, M.: Surge dynamics on Bering Glacier, Alaska, in 2008–2011, The Cryosphere Discuss., 6, 1181–1204, doi:10.5194/tcd-6-1181-2012, 2012.
Cogley, J. G., Hock, R., Rasmussen, L. A., Arendt, A. A., Bauder, A., Braithwaite, R. J., Jansson, P., Kaser, G., M¨oller, M., Nichol-son, L., and Zemp, M.: Glossary of Glacier Mass Balance and Related Terms, IHP-VII Technical Documents in Hydrology No. 86, IACS Contribution No. 2, UNESCO-IHP, Paris, 2011. Dowdeswell, J. A., Hodgkins, R., Nuttall, A.-M., Hagen, J. O., and
Hamilton, G. S.: Mass balance change as a control on the fre-quency and occurrence of glacier surges in Svalbard, Norwegian High Arctic, Geophys. Res. Lett., 22, 2909–2912, 1995. Eisen, O., Harrison, W. D., and Raymond, C. F.: The surges of
Var-iegated Glacier, Alaska, USA, and their connection to climate and mass balance, J. Glaciol., 47, 351–358, 2001.
Fatland, D. R. and Lingle, C. S.: Analysis of the 1993–95 Bering Glacier (Alaska) surge using differential SAR interferometry, J. Glaciol., 44, 532–546, 1998.
Fleisher, P. J., Bailey , P. K., Natel, E. M., Muller, E. H., Cadwell, D. H., and Russell, A.: The 1993–1995 surge and foreland mod-ification, Bering Glacier, Alaska, Geological Society of America Special Paper 442, 2010.
Kamb, B.: Glacier Surge Mechanism Based on Linked Cavity Con-figurationof the Basal Water Conduit System, J. Geophys. Res., 92, 9083–9100, doi:10.1029/JB092iB09p09083, 1987.
Korn, D.: “Modeling the mass balance of the Wolverine Glacier Alaska USA using the PTAA model”, American Geophys-ical Union, Fall Meeting 2010 http://adsabs.harvard.edu/abs/ 2010AGUFM.C21C0560K, 2010.
Lingle, C. S. and Fatland, D. R.: Does englacial water storage drive temperate glacier surges?, Ann. Glaciol., 36, 14–20, 2003. Mayo, L. R., Meier, M. F., and Tangborn, W. V.: A system to
com-bine stratigraphic and annual mass balance systems: A contribu-tion to the IHD, J. Glaciol., 11, 3–14, 1972.
Meier, M. F.: Proposed definitions of mass balance terms, J. Glaciol., 4, 252–261, 1962.
Meier, M. F. and Post, A. S.: What are glacier surges?, Can. J. Earth Sci., 6, 807–817, 1969.
Merrand, Y. and Hallet, B.: Water and sediment discharge from a large surging glacier: Bering Glacier, Alaska, USA, summer 1994, Ann. Glaciol., 22, 233–240, 1996.
Molnia, B. F. and Post, A.: Holocene history of Bering Glacier, Alaska: A prelude to the 1993–1994 surge, Phys. Geogr., 16, 87– 117, 1995.
Molnia, B. F. and Post, A.: Surges of the Bering Glacier. Geo-logical Society of America Special Papers 2010, 462, 291–316, doi:10.1130/2010.2462(15), 2010.
Muskett, R. R., Lingle, C. S., Tangborn, W. V., and Rabus, B. T.: Multi-decadal elevation changes on Bagley Ice Valley and Malaspina Glacier, Alaska, Geophys. Res. Lett., 30, 1857, doi:10.1029/2003GL017707, 2003.
Muskett, R. R., Lingle, C., Sauber, J, Post, A., Tangborn, W., Raubus, B., and Echelmeyer, K.: Airborne and spaceborne DEM and laser altimetry-derived surface elevation and volume changes of the Bering Glacier system, Alaska, USA, and Yukon, Canada, 1972–2006, J. Glaciol., 190, 316–326, 2009.
Nelder, J. A. and Mead, R.: A simplex method for function mini-mization, Comput. J., 7, 308-312, 1965.
Post, A.: Periodic surge origin of folded moraines on Bering Peid-mont Glacier, J. Glaciol., 11, 219–226, 1972.
R¨othlisberger, H.: Water pressure in intra- and subglacial channels, J. Glaciol., 11, 177–203, 1972.
Tangborn, W. V.: Using low-altitude meteorological observations to calculate the mass balance of Alaska’s Columbia Glacier and re-late it to calving and speed. Report of a Workshop, 28 February–2 March 1997, Byrd Polar Research Center, Report No. 15, 1997. Tangborn, W. V.: A Mass Balance Model that Uses Low-altitude
Meteorological Observations and the Area–Altitude Distribution of a Glacier, Geogr. Ann. A, 81, 753–765, 1999.
Tangborn, W. V.: The PTAA Mass Balance Model, Mountain Views, The Newsletter of the Consortium for Integrated Climate Re-search in Western Mountains, Cirmount, Vol 6. No. 2, November, 2012.
Tangborn, W. and Rana, B.: Mass Balance and Runoff of the Partially Debris-Covered Langtang Glacier, Debris-Covered Glaciers, edited by: Nakawa, M., Raymond, C. F., and Fountain, A., IAHS Publication 264, 2000.
Tangborn, W. V., Krimmel, R. M., and Meier, M. F.: A comparison of glacier mass balance by glaciological, hydrological and map-ping methods, South Cascade Glacier, Washington, Snow and Ice-Symposium-Neiges et Glaces (Proceedings of the Moscow Symposium, August 1971 Actes du Colloque de Moscou, aoˆut 1971), IAHS-AISH Publ. No. 104, 1972.
Zhang, J., Bhatt, U. S., Tangborn, W. V., and Lingle, C. S.: Re-sponse of Glaciers in Northwestern North America to Future Climate Change: an Atmosphere/Glacier Hierarchical Modeling Approach, Ann. Glaciol., 46, 283–290, 2007a.