ASTRONOMY & ASTROPHYSICS OCTOBER II2000, PAGE 293 SUPPLEMENT SERIES
Astron. Astrophys. Suppl. Ser.146, 293–322 (2000)
A new sample of giant radio galaxies from the WENSS survey
II. A multi-frequency radio study of a complete sample: Properties of the radio lobes and their
environment
A.P. Schoenmakers1,2,5,?, K.-H. Mack3,4, A.G. de Bruyn5,6, H.J.A. R¨ottgering2, U. Klein4, and H. van der Laan1
1 Astronomical Institute, Utrecht University, P.O. Box 80 000, 3508 TA Utrecht, The Netherlands 2
Sterrewacht Leiden, Leiden University, P.O. Box 9513, 2300 RA Leiden, The Netherlands 3
Istituto di Radioastronomia del CNR, Via P. Gobetti 101, I-40129 Bologna, Italy 4
Radioastronomisches Institut der Universit¨at Bonn, Auf dem H¨ugel 71, D-53121 Bonn, Germany 5
NFRA, P.O. Box 2, 7990 AA Dwingeloo, The Netherlands
6 Kapteyn Astronomical Institute, University of Groningen, P.O. Box 800, 9700 AV Groningen, The Netherlands Received December 15, 1999; accepted August 2, 2000
Abstract. We have formed a complete sample of 26 low
redshift (z <∼ 0.3) giant radio galaxies (GRGs) from the
WENSS survey, selected at flux densities above 1 Jy at 325 MHz. We present 10.5-GHz observations with the 100-m Effelsberg telescope of 18 sources in this sample. These observations, together with similar data of the re-maining eight sources, are combined with data from the WENSS, NVSS and GB6 surveys to study the radio prop-erties of the lobes of these sources at arcminute resolution. We investigate radio source asymmetries, equipartition en-ergy densities in the lobes, the presence of lobe pressure evolution with redshift, the spectral age and the density of the environments of these sources. We find that the arm-length asymmetries of GRGs are slightly larger than those of smaller sized 3CR radio galaxies and that these are dif-ficult to explain as arising from orientation effects only. We also find indications that the lobes of the GRGs, de-spite their large sizes, are still overpressured with respect to their environment. Further, we argue that any evolu-tion of lobe pressure with redshift in these large sources (e.g. Cotter 1998) is due to selection effects. For sources which could be used in a spectral ageing analysis, we find
spectral ages which are large, typically a few times 107yr.
This is comparable to earlier studies of some giant sources and indicates that such large spectral ages are common for this class of radio source. The advance velocities of the ra-dio lobes are typically a few percent of the speed of light, which is higher than those found for smaller, low power
(<1026.5 W Hz−1 at 178 MHz) radio sources, and more
Send offprint requests to: A.P. Schoenmakers, e-mail: [email protected]
?
Present address:NFRA, P.O. Box 2, 7990 AA Dwingeloo, The Netherlands.
comparable to higher power radio sources. This suggests that the GRGs in our sample are the oldest members of the group of relatively high power radio sources whose ra-dio powers have evolved to their currently observed lower values (cf. Kaiser et al. 1997).
Key words: galaxies: active — intergalactic medium — galaxies: jets — radio continuum: galaxies
1. Introduction
Giant radio galaxies (GRGs) are the largest radio sources in the Universe which are associated with active galactic nuclei (AGN). A common definition for GRGs is that they
are radio sources with a linear size above 12 Mpc1. These
enormous sizes make them interesting objects to study. Why are they so large? Is it because they grow much faster than other radio galaxies, or are they extremely old radio sources? Which are the properties of their progenitors? Also, because their size is so extreme, they allow us to study their radio structures in detail and to use them as probes of the gaseous environment of their host galaxies on scales of a few hundred kpc to a few Mpc.
Since their discovery in the early seventies, several in-dividual GRGs have been the subject of detailed radio studies at a variety of wavelengths and resolutions (e.g. 3C 236 by Strom & Willis 1980 and Barthel et al. 1985;
1
NGC 315 by Willis et al. 1981, NGC 6251 by Perley et al. 1984). However, systematic studies of GRGs as a popu-lation have always been hampered by the small number of sources available and by non-uniform selection effects. Since GRGs are large and their radio emission is not very powerful their surface brightness is relatively low. This makes them difficult objects to detect or recognize in most large-scale radio surveys. As a result, a large fraction of the known GRGs have been discovered serendipitously (e.g. Hine 1979; de Bruyn 1989), hence the difficulty in obtaining a uniformly selected sample. The most uniform dataset on GRGs available yet is that of 10.5-GHz obser-vations with the 100-m Effelsberg telescope (Klein et al. 1994; Saripalli et al. 1996; Mack et al. 1997). All sources have been observed in the same way and at similar
sensi-tivities (rms-noise∼1 mJy beam−1), so that the results
can be easily compared to each other.
In Paper I (Schoenmakers et al. 1900a; see also Schoenmakers 1999) we present a new sample of 47 GRGs selected from the 325-MHz WENSS survey (Rengelink et al. 1997). In this paper, we will define a complete subsample of 26 sources with a 325-MHz flux density above 1 Jy. This is the largest complete sample of GRGs, with well understood selection effects (see Paper I), yet compiled. We have used this sample for several follow-up studies, among which a study of their radio properties us-ing multi-frequency radio data. For this purpose, we have obtained new 10.5-GHz radio data of 18 of these sources using observations with the 100-m Effelsberg telescope; the 8 remaining sources have already been observed with this instrument (Klein et al. 1994; Saripalli et al. 1996; Mack et al. 1997). We have used these data to investigate the high-frequency radio morphology, the magnetic field configuration and, combined with data obtained at lower frequencies, the spectral index distribution and spectral ages (e.g. Mack et al. 1998). The analysis and results of this study are presented here. Subsequent papers will deal with the optical properties of the AGN and their relation with the radio structure, and with the evolution of GRGs, both in terms of cosmological evolution as in terms of intrinsic radio source evolution.
In Sect. 2 we present the complete sample of GRGs and discuss some of its characteristics. Section 3 presents the new 10.5-GHz radio data and lower frequency data for the sources in the sample. In Sect. 4 we derive several source asymmetry parameters and investigate the pres-ence of correlations between these. The ages and lobe ad-vance velocities of several GRGs are derived in Sect. 5, and the energy densities and lobe pressures are derived in Sect. 6. In Sect. 7 we discuss the results, focusing on the spectral ages and the environment of the GRGs. Our conclusions are presented in Sect. 8.
Throughout this paper, a spectral indexα is defined
according to the relationSν ∝ναbetween flux densityS
and frequencyν.
2. A complete sample of GRGs
The GRGs presented in Paper I have been selected from the WENSS survey using the criteria that they should
have an angular size above 50 and a distance from the
galactic plane≥12◦.5. We find in Paper I that a WENSS
radio source is most likely included in the sample if
Sint/θmax>∼0.025 Jy/arcmin, whereSint is the integrated
325-MHz flux density, andθmaxthe largest angular size of
the radio source. We have called this the sensitivity limit of our selection.
The total number of sources in the sample of Paper I
is 47, but at low flux density levels (i.e. <∼200 mJy)
sev-eral candidate sources have not yet been identified, and some sources may have been missed because they have not been recognized as single structures. Therefore, we have selected a subsample of 26 sources on the basis of a
flux density at 325 MHz, S325>1 Jy. At such high flux
densities, it is unlikely that a source has escaped detection or recognition as a GRG.
On basis of our sensitivity limit (see above), it is un-likely that a 1-Jy GRG will be recognized at a redshift below 0.014, due to its very low surface brightness in that case. However, the lowest redshift source in our sample is
NGC 315 at z = 0.0167, so no source needed to be
ex-cluded on basis of this limit.
We have omitted two giant FRI-type (Fanaroff & Riley 1974) radio sources from the sample: 3C 31 (e.g. Strom et al. 1983) and HB 13 (e.g. Masson 1979). The consider-ations for doing so were the following. First, the observed size of sources of this class depends strongly on the sur-face brightness sensitivity of the radio observations; only for edge-brightened FRII-type sources, the angular size and source structure is reasonably well defined because of the presence of hotspots and the usually better out-lined radio lobe morphology. The edge-darkened nature of FRI’s makes it unlikely that the 1-Jy sample is complete for FRI-type sources. Second, the properties of the radio lobes of FRI-type sources are known to be different. This is shown, for instance, by the different spectral index
dis-tribution in the radio lobes (e.g. J¨agers 1986; Parma et al.
1999), which may indicate different mechanisms for the acceleration and ageing of the radiating particles.
There are a few remaining sources which are strictly of type FRI, but also show properties commonly found in FRII-type sources, such as hotspots or sharply bound lobe structures. Well known examples of such sources are DA 240, NGC 315 and NGC 6251. Since the measured size of these sources is better constrained, we have left these sources in the sample, although they are excluded from many of the analyses in this paper. They are indicated as type “FRI/II” in Table 1.
Our 1-Jy sample therefore contains all non FRI-type sources with a 325-MHz flux density above 1 Jy, an
angu-lar size above 50, a linear size above 1 Mpc, a declination
A.P. Schoenmakers et al.: Multi-frequency radio observations of GRGs 295 Table 1. List of the 26 sources which form the “1-Jy sample” of
GRGs. Column 1 gives the name of the source in IAU-notation, with coordinates in B 1950.0; Col. 2 gives an alternative, more common name, if available; Col. 3 indicates whether it is one of the newly discovered GRGs (“N”) or one of the formerly known, or “old” GRGs (“O”); Col. 4 gives the redshift of the source; Col. 5 gives the radio morphological type. A “B” indi-cates it is a broad-line radio galaxy, i.e. the Hydrogen Balmer lines have broad components; a “Q” indicates a quasar-like spectrum (broad lines, blue continuum). Column 6 gives the projected linear size in Mpc. For references concerning the properties of the old GRGs we refer to Paper I
(1) (2) (3) (4) (5) (6)
IAU name Alt. name z Type D
FR [ Mpc ]
B 0050+402 O 0.1488 II 1.5
B 0055+300 NGC 315 O 0.0167 I/II 1.7 B 0109+492 3C 35 O 0.0670 II 1.1 B 0136+396 4C 39.04 O 0.2107 II 1.6 B 0157+405 4C 40.09 O 0.0827 I/II 1.9
B 0211+326 N 0.2605 II 1.6
B 0309+411 O 0.1340 II-B 1.8
B 0648+733 N 0.1145 II 1.9
B 0658+490 N 0.0650 I/II 1.9
B 0745+560 DA 240 O 0.0356 I/II 2.0
B 0813+758 N 0.2324 II-B 2.3
B 0945+734 4C 73.08 O 0.0581 II 1.5 B 1003+351 3C 236 O 0.0989 II 5.7 B 1209+745 4CT 74.17 O 0.107 II 1.2
B 1213+422 N 0.2426 II-B 1.6
B 1309+412 O 0.1103 II 1.0
B 1312+698 DA 340 O 0.106 II 1.3
B 1358+305 O 0.206 II 2.6
B 1426+295 N 0.0870 II 1.9
B 1450+333 N 0.249 II 1.7
B 1543+845 N 0.201 II 2.1
B 1626+518 O 0.0547 II 1.6
B 1637+826 NGC 6251 O 0.023 I/II 3.0
B 1918+516 N 0.284a II 2.3
B 2043+749 4C 74.26 O 0.104 II-Q 1.6
B 2147+816 N 0.1457 II 3.7
Notes:
a−Redshift still uncertain (see text and Paper I).
and a redshift above 0.014, in total 26 sources. Of these, 16 are GRGs which were previously known and 10 are newly discovered GRGs (see Paper I). The list of sources and some of their properties are presented in Table 1. The source B 1918+516 has an uncertain redshift determina-tion due to the faintness of its optical host galaxy and the difficulty we had in actually identifying it; an independent confirmation is needed.
3. Radio data and radio spectra of the 1-Jy sample
In this section we present new 10.5-GHz radio data of 18 of the 26 sources in the 1-Jy sample of GRGs. We have measured total and lobe flux densities of all sources at sev-eral frequencies between 325 MHz and 10.5 GHz. Further, we present the radio spectra of the sources and their radio lobes.
3.1. The 10.5-GHz observations
Eight sources in our sample were already observed at 10.5 GHz with the 100-m Effelsberg telescope (Klein et al. 1994; Saripalli et al. 1996; Mack et al. 1997). We have observed the 18 remaining sources with the same
instru-ment and achieving a similar sensitivity ofσrms≈1 mJy
beam−1.
The observations have been carried out in multiple ob-serving sessions between December 1995 and April 1998, using the 4-horn receiver operating at a central frequency of 10.45 GHz and employing a bandwidth of 300 MHz. The
beam size at this frequency is 6900(FWHM). For a detailed
description of the basic observational technique and data reduction procedure we refer to the paper by Gregorini et al. (1992). The calibration of the flux density scale has been achieved by mapping 3C 286 and 3C 295, with the flux density scale adopted from Baars et al. (1977). Field sizes and map centers are compiled in Table 2. Mapping was performed by scanning the telescope in azimuth with
a speed of 400/min, with a scan separation of 2000 in
el-evation and using all four horns. Difference maps have been computed from all horns to efficiently suppress at-mospheric disturbances of the signal. Following the usual restoration technique of the differential maps (Emerson et al. 1979) the maps were transformed into a right as-cension – declination system. All maps, with the excep-tion of B 0309+411, have been CLEANed to remove side-lobes, applying the algorithm described by Klein & Mack (1995). During the observations of B 0309+411, snow was collected on the dish of the telescope. Since this has af-fected the beam-shape, cleaning was not performed on this source. Also, the snow led to problems with calibrating the data. Therefore the flux density of B 0309+411 is esti-mated to be only correct to 20%. The individual coverages (Table 2) of each source have been averaged to give the
final Stokes’I,QandU maps. Contour plots of the radio
maps have been presented in Appendix A.
3.2. Other radio data
3.2.1. 325-MHz data
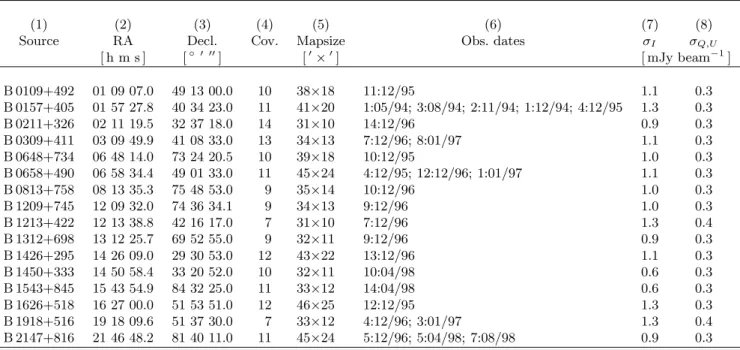
Table 2. Observing log of the 10.5-GHz observations. Column 1 gives the name of the source. Columns 2 and 3 give the B1950.0 coordinates of the center of the map. Column 4 gives the number of coverages used in the final maps (i.e. after removing those which suffered from bad atmospheric conditions). The number of coverages used in theI,Qand U maps are the same. Column 5 gives the size of the area covered. Column 6 gives the observing dates and the number of coverages on that date in the format “number of coverages:month/year”. Columns 7 and 8 give therms-noise in the total power maps and in theQ, U maps
(1) (2) (3) (4) (5) (6) (7) (8)
Source RA Decl. Cov. Mapsize Obs. dates σI σQ,U
[ h m s ] [◦ 0 00] [0×0] [ mJy beam−1]
B 0109+492 01 09 07.0 49 13 00.0 10 38×18 11:12/95 1.1 0.3
B 0157+405 01 57 27.8 40 34 23.0 11 41×20 1:05/94; 3:08/94; 2:11/94; 1:12/94; 4:12/95 1.3 0.3
B 0211+326 02 11 19.5 32 37 18.0 14 31×10 14:12/96 0.9 0.3
B 0309+411 03 09 49.9 41 08 33.0 13 34×13 7:12/96; 8:01/97 1.1 0.3
B 0648+734 06 48 14.0 73 24 20.5 10 39×18 10:12/95 1.0 0.3
B 0658+490 06 58 34.4 49 01 33.0 11 45×24 4:12/95; 12:12/96; 1:01/97 1.1 0.3
B 0813+758 08 13 35.3 75 48 53.0 9 35×14 10:12/96 1.0 0.3
B 1209+745 12 09 32.0 74 36 34.1 9 34×13 9:12/96 1.0 0.3
B 1213+422 12 13 38.8 42 16 17.0 7 31×10 7:12/96 1.3 0.4
B 1312+698 13 12 25.7 69 52 55.0 9 32×11 9:12/96 0.9 0.3
B 1426+295 14 26 09.0 29 30 53.0 12 43×22 13:12/96 1.1 0.3
B 1450+333 14 50 58.4 33 20 52.0 10 32×11 10:04/98 0.6 0.3
B 1543+845 15 43 54.9 84 32 25.0 11 33×12 14:04/98 0.6 0.3
B 1626+518 16 27 00.0 51 53 51.0 12 46×25 12:12/95 1.3 0.3
B 1918+516 19 18 09.6 51 37 30.0 7 33×12 4:12/96; 3:01/97 1.3 0.4
B 2147+816 21 46 48.2 81 40 11.0 11 45×24 5:12/96; 5:04/98; 7:08/98 0.9 0.3
for WENSS (see Rengelink et al. 1997 for a description)
results in a highly uniform coverage of the (u, v)-plane,
with baselines as short as ∼ 40λ. WENSS is therefore
potentially well suited to obtain accurate flux densities of
extended structures. However, since the (u, v)-plane is not
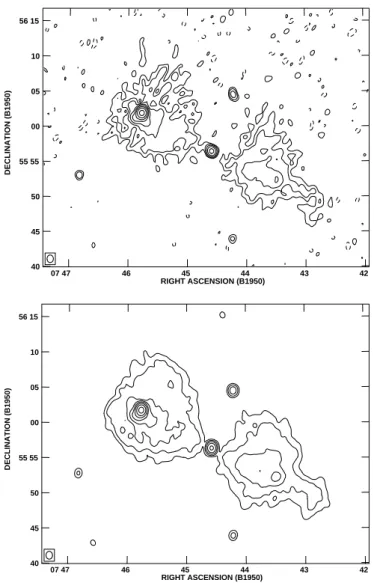
as well sampled as with continuous observations, in case of complicated and very extended source structures WENSS cannot map all source components reliably. This is par-ticularly notable in sources such as DA 240 or NGC 6251. To illustrate this problem we present in Fig. 1 a map of the source DA 240 as it appears in the WENSS and as it is published by Mack et al. (1997) from a complete 12-hr WSRT synthesis observation. In the latter case, not only the noise level is much lower, but also the fainter extended radio structures are much better reproduced. Since Mack et al. have published maps resulting from full synthesis WSRT observations for the four spatially largest objects in our sample (NGC 315, DA 240, 3C 236, NGC 6251), which will suffer most from this effect, we have measured the flux densities using their maps.
3.2.2. 1.4-GHz data
All sources have also been observed at 1.4 GHz in the NVSS survey (Condon et al. 1998). The observations for the NVSS survey were done in a “snap-shot” mode, us-ing the VLA in its D-configuration with baselines down
to ∼170λonly. Both these aspects seriously degrade the
sensitivity for structures above 100−150 in angular size.
We therefore only present 1.4-GHz flux densities from the
NVSS survey for sources smaller than 100.
3.2.3. 4.85-GHz data
Five GRGs in our sample (NGC 315, DA 240, 3C 236, NGC 6251 and B 1358+295) have been observed at 4.75 GHz with the 100-m Effelsberg telescope (Parma et al. 1996; Mack et al. 1997). The beam size for these
observations is ∼ 2.05 (FWHM). For sources without
5-GHz Effelsberg data we have used the 4.85-GHz Greenbank survey (GB6; Gregory et al. 1996) to measure flux densities. This survey has mapped the northern sky
up to a declination of +75◦, using a beam size of 3.02×3.07
(FWHM). For sources above +75◦ declination, we have
no 5-GHz flux densities. The flux densities in the source catalogue of the GB6 survey were obtained by fitting Gaussians to the observed sources, which, since all GRGs in our sample are larger than the beam size of the GB6 survey, gives unreliable results in our case. Therefore,
we have retrieved the original digital fits-format
im-ages, using the SkyView database, and measured the
A.P. Schoenmakers et al.: Multi-frequency radio observations of GRGs 297
DECLINATION (B1950)
RIGHT ASCENSION (B1950)
07 47 46 45 44 43 42
56 15
10
05
00
55 55
50
45
40
DECLINATION (B1950)
RIGHT ASCENSION (B1950)
07 47 46 45 44 43 42
56 15
10
05
00
55 55
50
45
40
Fig. 1. Two contour plots of the giant radio source DA 240 at a frequency of 325 MHz. The upper plot is from the WENSS sur-vey. Contours are drawn at 15×(−1,1,2,4,8,16,32,64,128) mJy beam−1. The lower plot is from a 325-MHz WSRT obser-vation by Mack et al. (1997). Contours are at the same levels as in the top plot
the source, carefully omitting any significant sources in this area. Discrete sources which overlap with the radio structure of the GRGs have been identified in the higher resolution NVSS and 10.5-GHz Effelsberg radio maps. Their contribution to the measured 4.85-GHz flux density has been subtracted by estimating their 4.85-GHz flux density using a power-law interpolation of their 1.4 and 10.5-GHz flux densities.
3.3. Radio spectra
We have measured the total integrated flux densities,
Sint, at 325 MHz, 4.8 GHz and 10.5 GHz. We have also
measured the flux densities of the lobes separately at
325 MHz, 1.4 MHz (for sources below 100in angular size),
4.8 GHz (for sources above 100 in angular size and
dec-lination below +75◦) and 10.5 GHz. Only in the case of
B 0309+411 we have not measured the lobe flux densities at 10.5 GHz due to the strongly dominating radio core at that frequency. The flux densities have been tabulated in Table 3.
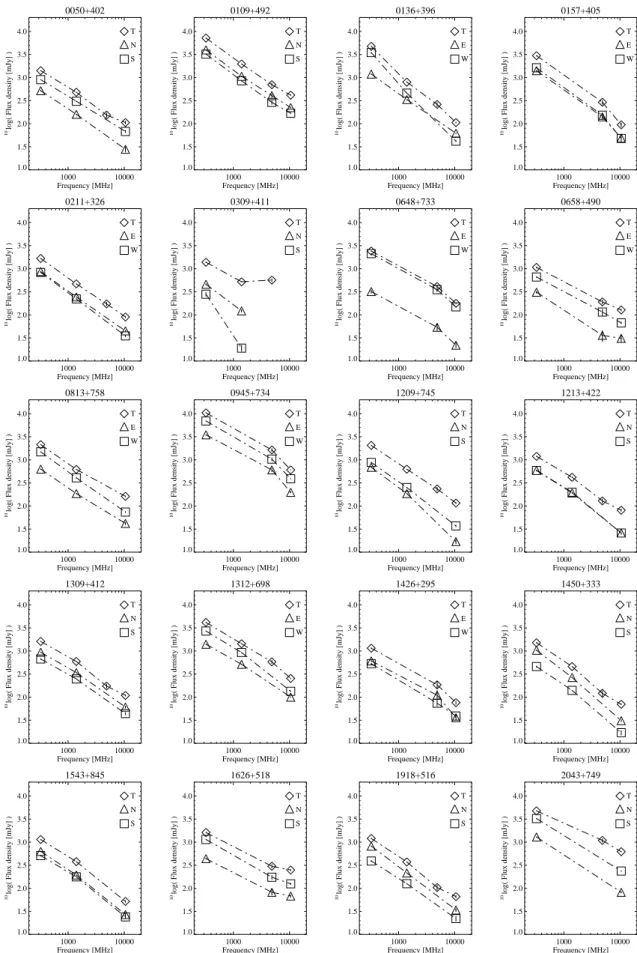
The radio spectra of the sources with more than two flux density measurements are plotted in Fig. 2, based on the flux densities from Table 3. We have used sep-arate signs for the total integrated flux densities and those of the two lobes. Not all sources have been plot-ted here; similar radio spectra of the sources B 0055+300 (NGC 315), B 1003+351 (3C 236), B 0745+560 (DA 240) and B 1637+826 (NGC 6251) can be found in Mack et al. (1997); for the source B 1358+305 we refer to the paper by Parma et al. (1996). The source B 2147+815 has not been plotted since we only have data at two frequencies for this source (see Table 3).
For several sources the spectrum of the total integrated emission clearly steepens towards higher frequencies (e.g. B 0157+405, B 0648+733, B 0945+734 and B 1312+698). This is usually a sign of spectral ageing of the radiating particles in the source. In other cases the spectrum ap-pears to flatten (e.g. B 0309+411, B 1626+518). Since all these sources have bright radio cores at 10.5 GHz, this must be the result of the radio core having a flat, or inverted, spectrum.
4. Radio source asymmetries
In this section we measure the asymmetries in armlength, flux density, spectral index, etc. We compare the val-ues and correlations we find for the GRGs with results obtained for samples of smaller-sized sources.
4.1. Morphological asymmetries
Asymmetries in the morphology of a radio source are com-mon and may reflect asymmetries in their environment. McCarthy et al. (1991), for instance, find that in a sam-ple of powerful 3CR radio sources there is a correlation between the side of the source with the shortest arm and the side of the source with the highest optical emission-line flux. If a larger intensity of the line emission is due to a higher amount of gas, then the advance of the radio lobe on that side of the source may have been slowed down. On the other hand, the filling factor of this gas may be too low to play an important role in the dynamical evo-lution of the radio lobe (e.g. Begelmann & Cioffi 1989).
Also, at large distances (i.e. >∼ 100 kpc) from the host
0050+402 1000 10000 Frequency [MHz] 1.0 1.5 2.0 2.5 3.0 3.5 4.0 10
log( Flux density [mJy] )
T N S 0109+492 1000 10000 Frequency [MHz] 1.0 1.5 2.0 2.5 3.0 3.5 4.0 10
log( Flux density [mJy] )
T N S 0136+396 1000 10000 Frequency [MHz] 1.0 1.5 2.0 2.5 3.0 3.5 4.0 10
log( Flux density [mJy] )
T E W 0157+405 1000 10000 Frequency [MHz] 1.0 1.5 2.0 2.5 3.0 3.5 4.0 10
log( Flux density [mJy] )
T E W 0211+326 1000 10000 Frequency [MHz] 1.0 1.5 2.0 2.5 3.0 3.5 4.0 10
log( Flux density [mJy] )
T E W 0309+411 1000 10000 Frequency [MHz] 1.0 1.5 2.0 2.5 3.0 3.5 4.0 10
log( Flux density [mJy] )
T N S 0648+733 1000 10000 Frequency [MHz] 1.0 1.5 2.0 2.5 3.0 3.5 4.0 10
log( Flux density [mJy] )
T E W 0658+490 1000 10000 Frequency [MHz] 1.0 1.5 2.0 2.5 3.0 3.5 4.0 10
log( Flux density [mJy] )
T E W 0813+758 1000 10000 Frequency [MHz] 1.0 1.5 2.0 2.5 3.0 3.5 4.0 10
log( Flux density [mJy] )
T E W 0945+734 1000 10000 Frequency [MHz] 1.0 1.5 2.0 2.5 3.0 3.5 4.0 10
log( Flux density [mJy] )
T E W 1209+745 1000 10000 Frequency [MHz] 1.0 1.5 2.0 2.5 3.0 3.5 4.0 10
log( Flux density [mJy] )
T N S 1213+422 1000 10000 Frequency [MHz] 1.0 1.5 2.0 2.5 3.0 3.5 4.0 10
log( Flux density [mJy] )
T N S 1309+412 1000 10000 Frequency [MHz] 1.0 1.5 2.0 2.5 3.0 3.5 4.0 10
log( Flux density [mJy] )
T N S 1312+698 1000 10000 Frequency [MHz] 1.0 1.5 2.0 2.5 3.0 3.5 4.0 10
log( Flux density [mJy] )
T E W 1426+295 1000 10000 Frequency [MHz] 1.0 1.5 2.0 2.5 3.0 3.5 4.0 10
log( Flux density [mJy] )
T E W 1450+333 1000 10000 Frequency [MHz] 1.0 1.5 2.0 2.5 3.0 3.5 4.0 10
log( Flux density [mJy] )
T N S 1543+845 1000 10000 Frequency [MHz] 1.0 1.5 2.0 2.5 3.0 3.5 4.0 10
log( Flux density [mJy] )
T N S 1626+518 1000 10000 Frequency [MHz] 1.0 1.5 2.0 2.5 3.0 3.5 4.0 10
log( Flux density [mJy] )
T N S 1918+516 1000 10000 Frequency [MHz] 1.0 1.5 2.0 2.5 3.0 3.5 4.0 10
log( Flux density [mJy] )
T N S 2043+749 1000 10000 Frequency [MHz] 1.0 1.5 2.0 2.5 3.0 3.5 4.0 10
log( Flux density [mJy] )
T
N
S
A .P . S ch o en mak e rs et al.: Mu lt i-freq u e n c y rad io ob serv at ion s of GR Gs 299 Ta b le 3 . F lux de ns it ie s o f the G R G s a n d the ir co mp o n e n ts . C o lumn 1 g iv e s the na me o f the so u rce . C o lu mn 2 indi ca te s w hi ch si d e o f the so urce is na me d A an d B in thi s ta bl e (“ N ” sta nds fo r no rth, e tc. ). C o lu mns 3 to 5 g iv e the in te g ra te d flux de ns it y , S , a t 3 2 5 M H z o f the w h o le so u rce a nd o f e a ch o f the tw o si de s o f the so urce . C o lumns 6 thro u g h 8 g iv e the flux de ns it ie s at 1.4 G H z for sou rces w it h a n a n g u lar size b e lo w 1 0 0 . C o lumns 9 thro u g h 1 1 g iv e the flux de ns it ie s a t 4 .8 5 G Hz fo r so urce s wit h d e clin at ion b elo w + 7 5 ◦ . F or sou rces larger th a n 1 0 0 , a ls o the flux de ns it ie s o f the lo b e s h a v e b e e n me a sure d . C o lumns 1 2 thro ug h 1 4 g iv e the flux de ns it ie s a t 1 0 .5 G Hz
(1) (2) (3) (4) (5) (6) (7) (8) (9) (10) (11) (12) (13) (14)
325 MHz 1.4 GHz 4.8 GHz 10.5 GHz
Source A,B Sint SA SB Sint SA SB Sint SA SB Sint SA SB
[ Jy ] [ Jy ] [ Jy ] [ mJy ] [ mJy ] [ mJy ] [ mJy ] [ mJy ] [ mJy ] [ mJy ] [ mJy ] [ mJy ]
B 0050+402 N,S 1.41±0.04 0.52±0.02 0.90±0.02 480±10 160± 4 307± 7 154± 19 106± 8 28± 4 68± 5 B 0055+300a E,W 9.71±0.18 2.53±0.06 3.55±0.10 2460± 70 296±40 569± 50 2056±50 271±50 646±80 B 0109+492 N,S 7.19±0.15 3.98±0.08 3.22±0.06 1965±40 1067±21 851±19 702± 67 407±40 290± 30 415±11 224± 6 169± 5 B 0136+396 E,W 4.75±0.10 1.19±0.03 3.48±0.07 798±16 334± 7 460±10 262± 30 106± 4 62± 2 42± 2 B 0157+405 E,W 2.98±0.08 1.41±0.04 1.63±0.04 292± 35 141±17 153± 18 95±11 49± 8 48± 8 B 0211+326 E,W 1.67±0.04 0.87±0.02 0.83±0.02 469±10 245± 5 222± 5 173± 18 90± 4 45± 2 35± 2 B 0309+411b N,S 1.38±0.04 0.46±0.02 0.28±0.03 520±11 122± 9 19± 3 567± 50 550±110
B 0648+733 E,W 2.41±0.06 0.32±0.03 2.12±0.05 411± 40 54± 9 351± 33 178± 7 22± 3 149± 4 B 0658+490c E,W 1.07±0.04 0.31±0.02 0.66±0.02 191± 22 36±10 115± 19 128± 8 31± 5 67± 4
B 0745+560a E,W 17.05±0.35 10.21±0.21 6.07±0.13 1780± 50 1187±23 457± 20 1041±47 625±20 165±15
B 0813+758 E,W 2.14±0.05 0.63±0.02 1.49±0.03 621±13 186± 5 408± 9 162± 6 42± 3 74± 3 B 0945+734 E,W 10.43±0.21 3.48±0.08 6.96±0.14 1641±150 607±57 1037± 95 605±15 198± 7 389±10 B 1003+351a E,W 13.13±0.26 2.18±0.08 2.99±0.06 2200± 45 213±20 401± 20 1208±28 177±10 166±10
B 1209+745 N,S 2.06±0.05 0.69±0.02 0.88±0.02 627±13 186± 4 252± 7 235± 25 116± 5 17± 2 37± 2 B 1213+422 N,S 1.19±0.03 0.59±0.02 0.59±0.02 419± 9 192± 4 199± 4 129± 15 81± 5 26± 2 26± 2 B 1309+412 N,S 1.61±0.04 0.94±0.02 0.67±0.02 594±12 341± 7 248± 5 174± 20 109± 5 61± 4 44± 3 B 1312+698 E,W 4.16±0.09 1.40±0.03 2.70±0.06 1436±29 515±11 928±19 583± 55 254± 7 100± 3 134± 4 B 1358+305d N,S 1.84±0.04 1.32±0.03 0.52±0.02 451±10 318± 7 136± 4 122± 4 95± 4 28± 4 52± 2 34± 2 19± 2
B 1426+295e E,W 1.15±0.04 0.61±0.02 0.53±0.02 185± 36 110±31 74± 11 76± 7 36± 4 39± 4
B 1450+333 N,S 1.51±0.04 1.04±0.03 0.46±0.02 460±10 267± 6 140± 3 121± 18 70± 3 31± 2 17± 2 B 1543+845 N,S 1.14±0.03 0.63±0.02 0.51±0.02 378± 9 194± 4 177± 4 52± 3 27± 2 24± 2 B 1626+518f N,S 1.62±0.03 0.44±0.02 1.14±0.03 300± 31 82±12 174± 19 249±11 68± 5 125± 6
B 1637+826g E,W 11.55±0.23 2.70±0.09 4.01±0.10 1558±40 85±20 216±15
B 1918+516 N,S 1.20±0.03 0.82±0.02 0.39±0.02 372± 8 215± 5 126± 3 104± 14 66± 5 34± 3 22± 3 B 2043+749h N,S 4.76±0.10 1.29±0.03 3.24±0.07 1091±105 621±14 82± 4 236± 6
B 2147+816 N,S 1.06±0.05 0.46±0.02 0.56±0.02 111± 7 47± 4 52± 4
the lobes becomes extremely difficult for larger sources. If line emitting gas or clouds are dynamically unimportant for large sources, then the armlength asymmetries of ra-dio galaxies may reflect asymmetries in the distribution of
the hot (∼107K) diffuse IGM around the host galaxy. In
principle, GRGs thus allow us to investigate the unifor-mity of the IGM on scales up to a few Mpc, which is well outside of the reach of current X-ray instruments, apart from a few very luminous clusters.
However, armlength asymmetries can also be a result of orientation effects (e.g. Best et al. 1995; Scheuer 1995), since the forward edges of the two lobes have different light travel times to the observer. Best et al. (1995) explain the differences in the armlength asymmetries between ra-dio galaxies and quasars in a sample of 3CR sources with orientation differences only, although high expansion
ve-locities of the lobes, up to 0.4c, are then required. Since
Best et al. find no significant correlation between the pa-rameters describing the arm-length asymmetry and the emission-line asymmetry, they suggest that environmen-tal effects are not necessarily the main cause of the ob-served asymmetries in 3CR sources, in agreement with Begelmann & Cioffi (1989).
To investigate if the linear size of the radio source has any influence on the observed asymmetries, we have mea-sured the armlengths of the lobes of all FRII-type sources in the 1-Jy sample. We have calculated the
armlength-ratio,Q, by dividing the length of the longest arm by that
of the shortest arm. This yields the fractional separation
difference,x, which is defined asx=QQ−+11 (e.g. Best et al.
1995). The advantage of usingx, instead of Q, is that its
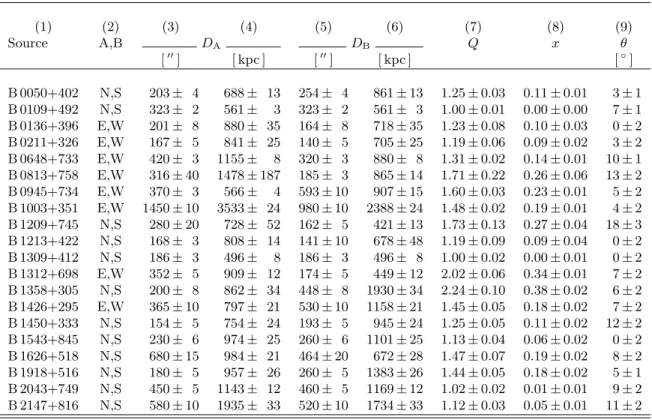
range is limited between 0 and 1. In Table 4 we present
the armlengths,Q,x, and the references to the data used
to measure these parameters.
In Fig. 3a we have plotted a histogram of the fractional separation difference of the GRGs. We have omitted the source B 2043+745 from our GRG sample since it is iden-tified with a quasar and may thus have an extreme orien-tation; note, however, that this source is very symmetrical
(x= 0.01±0.01) and that including it would raise the first
bin only by∼0.05.
As comparison we have plotted the armlength
asym-metry distribution of z <0.3 (i.e. similar redshift range)
FRII-type 3CR radio galaxies with 50< D <1000 kpc,
for which we have taken the data from Best et al. (1995). We have removed sources smaller than 50 kpc since their asymmetries, if environmental, more reflect the gas distri-bution inside or close to the host galaxy whereas we are interested in the large-scale environment. There are 27 sources in the 3CR subsample, as compared to 19 FRII-type GRGs.
This comparison is only meaningful if 3CR sources are in similar gaseous environments as GRGs, and will develop into GRGs provided that their nuclear activity lasts for a long enough time. As yet, there is little detailed knowl-edge on the difference in the environments of 3CR and
GRG sources, and on the evolution of radio sources from small to large ones (e.g. Schoenmakers 1999). Radio source evolution models (e.g. Kaiser et al. 1997; Blundell et al. 1999) predict that GRGs must have been much more ra-dio luminous when they were of smaller size, which is not inconsistent with them being 3CR galaxies at an earlier evolutionary stage (see also Schoenmakers 1999). We will therefore assume that the environments are largely similar
for the>50 kpc 3CR sources and the GRGs.
Although the difference in armlength asymmetry be-tween 3CR radio galaxies and GRGs is small and proba-bly not significant, the GRGs tend to be biased towards higher armlength asymmetries (Fig. 3a). A Kolmogorov-Smirnoff (K-S) test shows that the two distributions are different at the 95% confidence level. Note, however, the relatively large (Poissoneous) errors in Fig. 3a, due to the small number of sources in the samples.
We have also measured the bending angle, defined as the angle between the lines connecting the core with the endpoints of the two lobes. The results are presented in Table 4. The distribution of bending angles is plotted in
Fig. 3b, together with the values for the z < 0.3 3CR
galaxies from Best et al. (1995). The distributions are quite similar; a K-S test shows that they do not differ sig-nificantly at the 90% confidence level. Further discussion of these asymmetries will be presented in Sect. 7.3.
4.2. Flux density and spectral index asymmetries
We have measured the flux density asymmetry, R, of the
radio lobes and the spectral index difference, ∆α, between
the two lobes. We have defined these parameters such that they increase monotonically with increasing asymmetry,
i.e. R is the 325-MHz flux density of the brightest lobe
divided by that of the weakest lobe and ∆αis the
spec-tral index of the lobe with the flattest spectrum minus the spectral index of the lobe with the steepest spectrum, mea-sured between 325 MHz and 10.5 GHz. We have searched for correlations between these parameters and the
arm-length asymmetry parameterxusing Spearman rank
cor-relation tests. To avoid spuriously significant corcor-relations as a result of single outliers in the parameter space under investigation, we have omitted, for each of the two pa-rameters being tested, the source with the highest value of that parameter. The results of the correlation tests are presented in Cols. 1–3 of Table 5.
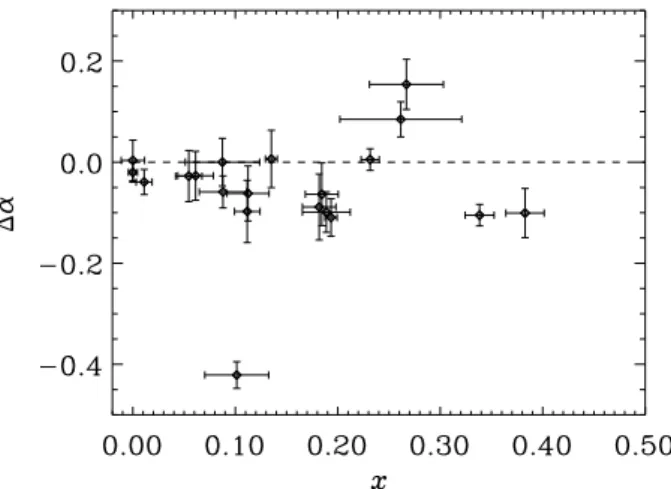
We find that the only significant correlation is that
betweenxand ∆α, i.e. when a radio source is more
asym-metric in armlength, then also the spectral index differ-ence between the lobes is systematically larger. We find that in 15 out of 20 sources the radio lobe with the short-est arm preferentially has a steeper spectrum, although the difference in spectral index between the two sides is
<
∼0.1 for almost all sources (see Fig. 4).
The lobe flux density asymmetry,R, is not significantly
A.P. Schoenmakers et al.: Multi-frequency radio observations of GRGs 301 Table 4. Morphological parameters of the radio lobes. Column 1 gives the name of the source. Column 2 indicates which side of the source is namedAandBin this table (“N” stands for north, etc.). Columns 3 to 6 give the angular size and the physical size of the lobes. Column 7 gives the asymmetry parameter,Q, defined as ratio of the length of the longest lobe to that of the shortest. Column 8 gives the fractional separation parameter,x, defined asx= (Q−1)/(Q+ 1). Column 9 gives the bending angle,θ, of the radio source, defined as the angle between the radio axes of the two lobes
(1) (2) (3) (4) (5) (6) (7) (8) (9)
Source A,B DA DB Q x θ
[00] [ kpc ] [00] [ kpc ] [◦]
B 0050+402 N,S 203± 4 688± 13 254± 4 861±13 1.25±0.03 0.11±0.01 3±1 B 0109+492 N,S 323± 2 561± 3 323± 2 561± 3 1.00±0.01 0.00±0.00 7±1 B 0136+396 E,W 201± 8 880± 35 164± 8 718±35 1.23±0.08 0.10±0.03 0±2 B 0211+326 E,W 167± 5 841± 25 140± 5 705±25 1.19±0.06 0.09±0.02 3±2 B 0648+733 E,W 420± 3 1155± 8 320± 3 880± 8 1.31±0.02 0.14±0.01 10±1 B 0813+758 E,W 316±40 1478±187 185± 3 865±14 1.71±0.22 0.26±0.06 13±2 B 0945+734 E,W 370± 3 566± 4 593±10 907±15 1.60±0.03 0.23±0.01 5±2 B 1003+351 E,W 1450±10 3533± 24 980±10 2388±24 1.48±0.02 0.19±0.01 4±2 B 1209+745 N,S 280±20 728± 52 162± 5 421±13 1.73±0.13 0.27±0.04 18±3 B 1213+422 N,S 168± 3 808± 14 141±10 678±48 1.19±0.09 0.09±0.04 0±2 B 1309+412 N,S 186± 3 496± 8 186± 3 496± 8 1.00±0.02 0.00±0.01 0±2 B 1312+698 E,W 352± 5 909± 12 174± 5 449±12 2.02±0.06 0.34±0.01 7±2 B 1358+305 N,S 200± 8 862± 34 448± 8 1930±34 2.24±0.10 0.38±0.02 6±2 B 1426+295 E,W 365±10 797± 21 530±10 1158±21 1.45±0.05 0.18±0.02 7±2 B 1450+333 N,S 154± 5 754± 24 193± 5 945±24 1.25±0.05 0.11±0.02 12±2 B 1543+845 N,S 230± 6 974± 25 260± 6 1101±25 1.13±0.04 0.06±0.02 0±2 B 1626+518 N,S 680±15 984± 21 464±20 672±28 1.47±0.07 0.19±0.02 8±2 B 1918+516 N,S 180± 5 957± 26 260± 5 1383±26 1.44±0.05 0.18±0.02 5±1 B 2043+749 N,S 450± 5 1143± 12 460± 5 1169±12 1.02±0.02 0.01±0.01 9±2 B 2147+816 N,S 580±10 1935± 33 520±10 1734±33 1.12±0.03 0.05±0.01 11±2
out of 20 sources (i.e. 65%) the most luminous radio lobe has the shortest armlength. This is a similar percentage as found in the sample of 3CR sources studied by McCarthy et al. (1991, but see Best et al. 1995) which suggests that this trend does not occur by chance, only.
Since the luminosity of a radio lobe is the lobe volume integrated emissivity, it is perhaps preferable to compare
R and ∆αwith the asymmetry in the estimated volume
of the radio lobes. Also, if the asymmetries are caused by large-scale environmental inhomogeneities, this will prob-ably affect the dynamical evolution of the lobe as a whole, and not only its forward advance. Therefore, we have
in-vestigated the correlation ofRand ∆αwithQV, the ratio
of the volume of the largest lobe to that of the smallest. See Sect. 6.1 for the method used to estimate the lobe volumes.
The results are presented in the last three columns of Table 5. Although the correlation analysis gives significant
results for both ∆α and R with QV, indicating a
corre-lated increase in asymmetry for these parameters, these results are not very meaningful. We find that in only 12 out of 20 sources the lobe which is smallest in estimated volume has the steepest spectrum. Also, in only 11 out of 20 sources we find that the largest lobe is the brightest. This indicates that the relative volume of a radio lobe has
Table 5. Spearman rank correlation tests between the asym-metry parameters of the GRGs. See the text for details on the definition of the parameters. Columns 1 and 4 give the pa-rameters being tested. Columns 2 and 5 give the correlation coefficients, rs. Columns 3 and 6 give the significance, s, of the correlation. The probability of the correlation occurring by chance is 1−s
(1) (2) (3) (4) (5) (6)
rs s rs s
∆α−x 0.657 0.997 ∆α−QV 0.704 0.999
R−x 0.257 0.664 R−QV 0.582 0.986
∆α−R 0.333 0.809
less influence on its relative spectral index than the arm-length of the lobe. We will discuss this in more detail in Sect. 7.3.
5. The advance velocities and ages of the radio lobes
Fig. 3. Plots of the distribution of the fractional separation difference, x (top), and the bending angle, θ (bottom), of the FRII-type GRGs (hatched area) and of z < 0.3 and
50 < D < 1000 kpc powerful 3CR sources from Best et al.
(1995; area under dashed line). The error bars assume a pois-son distribution of the number of sources in a bin
that the radio spectrum in the radio lobes of FRII-type sources steepens along the line connecting the hotspots with the core. This can be explained as a result of ageing of the radiating particles after they have been accelerated in the hotspots (e.g. Alexander & Leahy 1987). By fitting spectral ageing models, the spectral index as a function of distance from the hotspot then yields the age as a function of hotspot. From the velocity of the hotspot and the size of the source an estimate of the spectral age of the radio source is obtained. Using ram-pressure equilibrium at the head of the jet, we can then also estimate the density in the ambient medium of the radio lobes.
5.1. Spectral index profiles
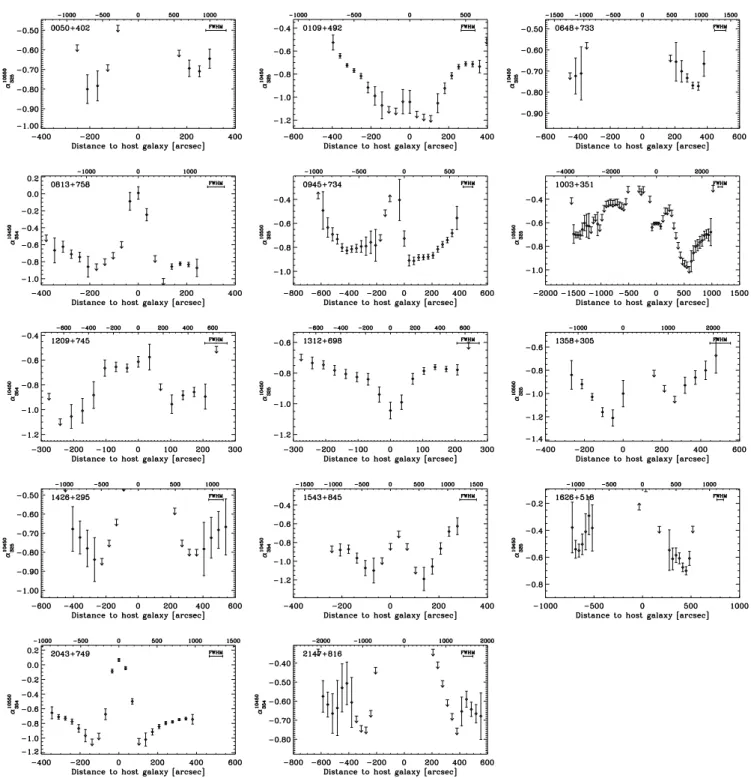
We have used the WENSS or 325-MHz WSRT maps of Mack et al. (1997), and the 10.5-GHz Effelsberg data to
produce profiles of the spectral index,α10500
325 , of the GRGs
along their radio axes. We have selected the 15 FRII-type
sources with an angular size above 70, only. This ensures
that the radio lobes are covered by several independent beams. We have omitted the source B 1918+516 since it is confused with two unresolved sources in our low
Fig. 4. The difference in spectral index between the longest and the shortest lobe against the armlength asymmetry parameter
xof the GRGs. The source with the largest side-to-side differ-ence in spectral index (∆α≈ −0.4) is B 0136+396
frequency maps (see Paper I). We have convolved the maps at 325/354 MHz to the resolution of the 10.5-GHz
Effelsberg maps (6900×6900FWHM). In case that the
dec-lination of a source is below +51◦, we have convolved both
the 325/354-MHz and the 10.5-GHz maps to a common
resolution of 6900×(54·cosecδ)00 (FWHM). Additionally,
for sources with an angular size ≤ 100 and for which
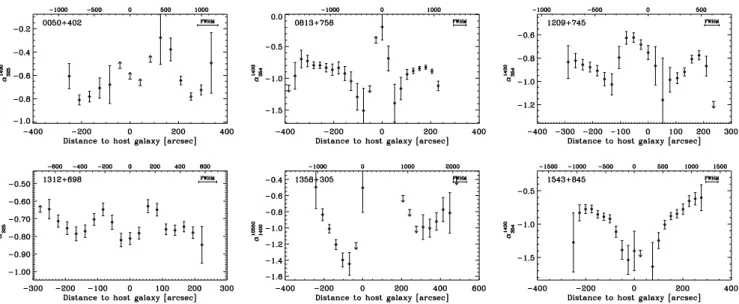
reliable 1.4-GHz NVSS maps are therefore available, we have also made profiles of the spectral indices between 325/354 MHz and 1.4 GHz (B 0050+402, B 0813+758, B 1312+698, B 1543+845), or between 1.4 GHz and 10.5 GHz (B 1358+305; B 0050+402 was omitted here because only few reliable datapoints could be found). For this, the NVSS maps have been convolved to the resolution of either the WENSS or the Effelsberg observations.
We have superposed rectangular boxes on the radio source, with the long side oriented perpendicular to the
radio axis and with a width along the radio axes of 0.5
times the FWHM beam size of the convolved map. The whole array of such boxes has been centered on the ra-dio core position. Possible confusing sources have been blanked from the radio maps. In each box, we have inte-grated the flux density at each frequency and calculated the spectral index of the box from this. If the flux density
inside a box was not significant (i.e. <3σI) we used a 3σI
A.P. Schoenmakers et al.: Multi-frequency radio observations of GRGs 303
signal-to-noise have been presented as limits in the spec-tral index profiles, so background effects should not be serious in these areas. Large intensity gradients occur mostly at the outer edges of the sources, near the hotspots. Therefore, the outermost point on each side of a source is usually not reliable.
The profiles of the spectral index between
325/354 MHz and 10.5 GHz are presented in Fig. 5, those between 325/354 MHz and 1.4 GHz in Fig. 6. We find that only a few of the GRGs show a significant steepening of their radio spectra towards the core (e.g. B 2043+749). In other sources, such as B 2147+816, such a behaviour is not observed. In some cases a likely explanation is that a flat-spectrum radio jet contributes to the extended lobe emission. The source B 1209+745 is known to have a prominent one-sided jet pointing towards the north (e.g. van Breugel & Willis 1981), which explains the flat-spec-trum “plateau” north of the radio core position in Fig. 5. The same may be true for B 1312+698, which shows jet-like features in an (unpublished) 1.4-GHz WSRT radio map. However, for other sources such a scenario is less probable since no jet-like features appear in any of our radio maps. Among the possible causes for the apparent absence of ageing in these sources can be mixing of the lobe material due to backflows in the lobes, non-uniform magnetic fields and changes in the energy distribution of the accelerated particles during the sources lifetime.
5.2. The advance velocities of the radio lobes
We have fitted advance velocities and ages of the radio lobes to the spectral index profiles using the method described in Schoenmakers et al. (1998). In short, this method works as follows: First, we recognize that Inverse
Compton scattering of the Microwave Background
(MWB) radiation is an important energy loss mecha-nism of the radiating particles in the lobes of GRGs. Its influence on the energy losses can be described by
imposing an additional magnetic field, BMWB, whose
energy density equals that of the MWB radiation field,
i.e. BMWB = 3.24 (1 +z)2 µG, where z is the redshift
of the source. In Fig. 7 we have plotted the ratio of the equivalent magnetic field strength of the MWB
radiation, BMWB, and the equipartition magnetic field
strengths in the radio lobes, Beq, averaged for both
lobes, against both redshift and linear size of the GRGs (see also Ishwara-Chandra & Saikia 1999). See Sect. 6 for the calculation of the equipartition magnetic field
strength. We find that in all GRGsBeq<∼BMWB, which
indicates that the IC-scattering process dominates the energy losses of the radio lobes. If we neglect energy losses resulting from the expansion of the lobes, then the radiating particles loose energy only due to synchrotron radiation and IC scattering of MWB photons. In this case, the radiative lifetime of particles is maximized
when the internal magnetic field strength of the lobe
Bint =BMWB/
√
3 (e.g. van der Laan & Perola 1969). In other words, for a given time since the last acceleration of the radiating particles, this magnetic field strength gives the least amount of spectral steepening due to radiation and IC scattering. Using this value for the internal magnetic field strength therefore provides an upper limit to the spectral age of a radio source.
We have derived the velocities and ages of the radio lobes using both the equipartition magnetic field strength (see Table 7) and the magnetic field strength which gives
the maximum age (BMWB/
√
3). We have calculated the velocities and ages for two ageing models: The Jaffe-Perola (JP) and the Continuous Injection (CI) models (see Schoenmakers et al. 1998, and references therein, for de-tails). These are the extreme cases in the sense that the JP model gives the largest change in spectral index for a given age, whereas the CI model gives the smallest change. We find that in many cases our data are not good enough to decide which model is better applicable. It can be ex-pected, however, that this is the JP model unless reaccel-eration of the particles in the lobes is important. Last, we assume that the advance velocity of the radio lobes, the injection spectral index of the radiating particles and the magnetic field strength in the lobes have been constant during the life-time of the radio source, and that the mag-netic field strength is uniform throughout the lobe.
The velocity we find with our method is the separation velocity between the head of the lobe and the material flowing back in the lobe. This backflow may be important in very powerful radio sources (e.g. Liu et al. 1992; Scheuer 1995), but whether this is also the case in GRGs is not clear. Some of our sources have radio lobes which do not cover the whole area between the hotspot and the radio core. Although this may be caused by the increased effect of spectral ageing at a large distance from the hotspot, it may also indicate that backflows are not important in these radio lobes. Although the issue is far from clear, we will assume for the remainder of this discussion that backflows are unimportant in the lobes of the GRGs.
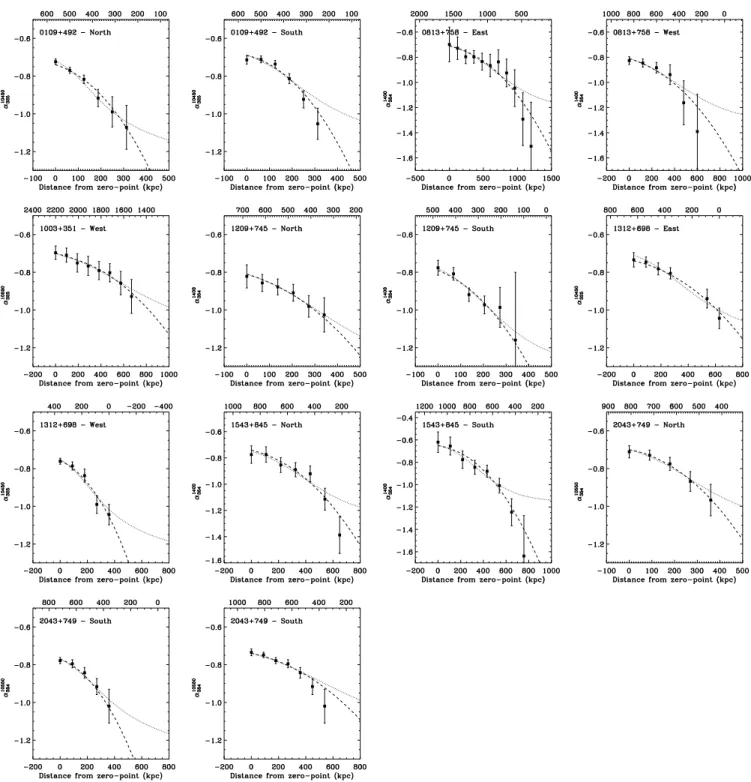
Many of our sources either do not show the expected ageing signature, i.e. a steepening of the spectrum towards the radio core, or have too few (less than five) or too poorly determined datapoints to provide a meaningful constraint for the fitting process (see Figs. 5 and 6). Only seven sources have spectral index profiles that we could use to fit the velocities and ages. These are B 0109+492, B 0813+758 (between 354 and 1400 MHz), B 1003+351 (western lobe only), B 1209+745 (between 354 and 1400 MHz), B 1312+698, B 1543+845 and B 2043+749. The results for these are presented in Table 6, and the model fits in Fig. 8. The plots in Fig. 8 have been made
for the case that Bint = BMWB/
√
3. In the table we
present for each lobe the best fit velocity,v, and injection
spectral index,αinj, and the reducedχ2of the fit. In case
Fig. 5. Profiles of the spectral index distribution along the major axes of the radio sources, between 325 (or 354) MHz and 10.5 GHz. The zero point on thex-axis is the position of the radio core. The numbers along the upper axis denote the distance from the radio core in units of kpc. Negative values are on that side of the source which is mentioned first in column two of Table 7
index profile of the southern lobe using either five or seven spectral index points. The results are significantly different and we therefore present them for both these
cases. The values of the reduced χ2 presented in Table
6 are almost all smaller than unity. We believe that this
is largely due to our conservative error estimates in the spectral indices.
We find that the advance velocities of the heads of the
lobes of the GRG are in the range of 0.01c−0.1c, with an
A.P. Schoenmakers et al.: Multi-frequency radio observations of GRGs 305
Fig. 6. Profiles of the spectral index distribution along the major axes of the sources smaller than 100, between 325 (or 354) MHz and 1.4 GHz (except for B 1358+305, which is between 1.4 and 10.5 GHz). The axes have been annotated similarly as in Fig. 5
Fig. 7. The ratio of the equivalent magnetic field strength of the microwave background radiation, BMWB, to the averaged equipartition magnetic field strengths,Beq, in the lobes of the GRGs against redshift (left) and projected linear size (right) of the radio source. The dashed line in the right plot indicates the expected behaviour ofBMWB/Beqfor increasing linear size of a source with constant radio power and redshift (Beq∝V−2/7 ∝D−6/7, whereV andD are the volume and linear size of the radio source, respectively). This line only illustrates that the apparent correlation in this diagram is due to selection effects
be fitted using our method clearly question the validity of our method and the results. If some of the mechanisms that prevent the presence of a clear ageing signature in all these sources are also at work in the seven sources that we were able to find the age for, then the velocities that we have obtained are only upper limits to the true velocities. They indicate a general trend, though, that the advance
velocities of the lobes of GRGs are below 0.1c.
5.3. The spectral ages of GRGs
The method to find the velocities of the lobes which we employed in Sect. 5.2 also yields the spectral age of the
radio source. Using the lobe advance velocities in Table 6 and the known armlengths of the lobes (Table 4), we have calculated the lobe ages. We have calculated the ages for each of the two spectral ageing models and for both the equipartition magnetic field strength and the one that
should maximize the age of the lobe,BMWB/
√ 3.
Table 6. Results of the spectral aging analysis. The top part of the table presents the results for an internal magnetic field strength equal toBMWB/
√
3, which should give the maximum age; the bottom part is for an internal field strength equal to the average equipartition field strength in the two lobes. Column 1 gives the name of the source and the component. Column 2 gives the number of spectral index points used in the fitting. Columns 3 to 5 give the velocity,v, in units ofc, the injection spectral index,αinjand the reducedχ2of the fit using the CI model. Columns 6 to 8 give the same for the JP model. Columns 9 and 10 give the age of the lobes resulting from the fitted velocities and the size of the lobes, for each of the two models
(1) (2) (3) (4) (5) (6) (7) (8) (9) (10)
Source vCI αinj,CI χ2red vJP αinj,JP χ2red tCI tJP
[c] [c] [ 107 yr ]
B 0109+492 N 6 0.014±0.001 −0.72±0.01 0.38 0.040±0.001 −0.74±0.01 0.46 13.1±0.9 4.6±0.1 S 5 0.014±0.001 −0.69±0.01 0.68 0.029±0.001 −0.69±0.01 0.86 13.1±0.9 6.2±0.2 B 0813+758 E 11 0.046±0.001 −0.71±0.03 0.49 0.094±0.001 −0.71±0.03 0.34 10.5±1.3 5.1±0.7 W 6 0.032±0.001 −0.81±0.04 0.55 0.061±0.001 −0.81±0.04 0.43 8.8±0.3 4.6±0.1 B 1003+351 W 8 0.059±0.002 −0.70±0.02 0.09 0.119±0.002 −0.70±0.02 0.06 13.1±0.4 6.5±0.1 B 1209+745 N 6 0.017±0.001 −0.81±0.03 0.07 0.033±0.001 −0.81±0.03 0.09 14.0±1.3 7.2±0.6 S 6 0.011±0.001 −0.78±0.03 0.34 0.024±0.001 −0.79±0.03 0.47 12.5±1.2 5.7±0.3 B 1312+698 E 6 0.037±0.002 −0.71±0.02 0.42 0.103±0.002 −0.74±0.02 0.17 8.0±0.4 2.9±0.1 W 5 0.024±0.002 −0.75±0.02 0.96 0.056±0.002 −0.76±0.02 0.57 6.1±0.5 2.6±0.1 B 1543+845 N 7 0.025±0.001 −0.75±0.04 1.17 0.051±0.001 −0.74±0.04 0.58 12.7±0.7 6.2±0.2 S 8 0.021±0.001 −0.65±0.04 0.96 0.045±0.001 −0.65±0.03 0.34 17.2±1.3 8.0±0.3 B 2043+749 N 5 0.029±0.001 −0.70±0.02 0.27 0.057±0.001 −0.70±0.02 0.07 8.6±0.3 4.3±0.1 S 5 0.030±0.002 −0.77±0.02 0.52 0.060±0.002 −0.77±0.02 0.42 8.5±0.5 4.3±0.2 S 7 0.059±0.002 −0.74±0.01 0.83 0.112±0.002 −0.74±0.01 0.55 4.3±0.2 2.3±0.1 B 0109+492 N 6 0.016±0.001 −0.72±0.01 0.39 0.045±0.001 −0.73±0.01 0.51 11.4±0.7 4.1±0.1 S 5 0.016±0.001 −0.70±0.02 0.73 0.033±0.001 −0.70±0.01 0.24 11.4±0.7 5.5±0.2 B 0813+758 E 11 0.054±0.002 −0.71±0.03 0.48 0.110±0.002 −0.71±0.03 0.34 8.9±1.2 4.4±0.5 W 6 0.037±0.001 −0.81±0.03 0.55 0.071±0.001 −0.81±0.04 0.44 7.7±0.4 4.0±0.2 B 1003+351 W 8 0.091±0.002 −0.69±0.02 0.13 0.173±0.002 −0.70±0.02 0.06 8.5±0.2 4.5±0.1 B 1209+745 N 6 0.019±0.001 −0.81±0.03 0.08 0.038±0.001 −0.81±0.03 0.09 12.5±1.1 6.2±0.5 S 6 0.013±0.001 −0.78±0.03 0.37 0.028±0.001 −0.79±0.02 0.48 10.6±0.9 4.9±0.2 B 1312+698 E 6 0.038±0.002 −0.71±0.02 0.41 0.105±0.002 −0.74±0.02 0.25 7.8±0.4 2.8±0.1 W 5 0.025±0.002 −0.75±0.02 0.97 0.055±0.002 −0.75±0.02 0.63 5.8±0.5 2.7±0.1 B 1543+845 N 7 0.027±0.001 −0.75±0.03 1.17 0.055±0.001 −0.74±0.03 0.58 11.8±0.7 5.8±0.2 S 8 0.022±0.001 −0.65±0.04 0.96 0.049±0.001 −0.65±0.03 0.34 16.4±1.3 7.3±0.3 B 2043+749 N 5 0.034±0.001 −0.70±0.02 0.34 0.067±0.001 −0.70±0.02 0.15 7.3±0.2 3.7±0.1 S 5 0.036±0.002 −0.76±0.02 0.63 0.071±0.002 −0.76±0.02 0.51 7.1±0.4 3.6±0.2 S 7 0.047±0.002 −0.71±0.01 0.77 0.093±0.002 −0.71±0.01 0.64 5.4±0.3 2.7±0.2
have fitted using both five and seven spectral index points, the best agreement between the ages of the two lobes is found for the fit which uses five spectral points only.
The spectral ages we find all lie in the range be-tween 30 and 150 Myr, depending on the spectral age-ing model and, to a lesser degree, on the used value of the internal magnetic fieldstrength. Also, they are com-parable to those found for other Giant radio sources, us-ing similar techniques, e.g. 40 Myr for B 0136+396 (Hine 1979) and B 0821+695 (Lacy et al. 1993), 180 Myr in
B 0319−454 (Saripalli et al. 1994), 140 Myr in B 0313+683
(Schoenmakers et al. 1998). We find an average age of 80 Myr.
6. The energy densities and pressures of the radio lobes
A.P. Schoenmakers et al.: Multi-frequency radio observations of GRGs 307
Fig. 8. The results of the spectral ageing analyses. The plotted points are the spectral index points used for the fit in each lobe of the seven sources and the lines are the best fits for the two ageing models. The dotted line represents the CI model and the dashed line the JP model. The numbers along lower axes denote the distance in kpc from the point where we assume that the age is zero. The numbers along the top axis indicate the distance from the host galaxy in kpc. The results plotted here are those using an internal magnetic field strength ofBMWB/
√
3, which should yield the maximum age. For the source B 1003+351 only the western lobe could be used for fitting. For the southern lobe of B 2043+749 we present two fits, one using seven and one using five spectral index points, since these give quite different results (see Table 6)
size (e.g. Kaiser & Alexander 1997), so that the lobes of large radio sources should be closer to pressure equilib-rium with their environment. Since GRGs are the largest
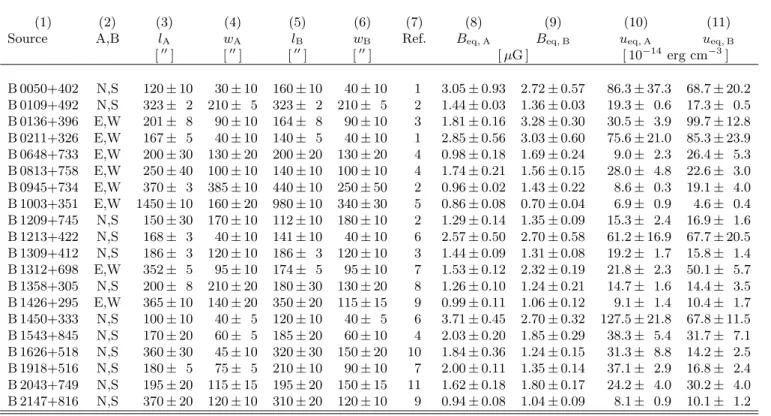
Table 7. The equipartition magnetic field strengths and energy densities of the two lobes of the FRII-type sources in the 1-Jy sample. We have omitted the source 0309+411 since it is strongly core dominated which did not allow an accurate measurement. Column 1 gives the name of the source. Column 2 gives the sidedness indicator of the lobes “A” and “B”, where “N” stands for north, “E” for east, etc. Columns 3 to 6 give the lengths,l, and widths,w, of the lobes (note, thatlonly gives the part of the lobe from which radio emission has been detected). Column 7 gives the reference for the observations we used to determineland
w. Columns 8 and 9 give the equipartition magnetic field strength and Cols. 10 and 11 give the equipartition energy densities
(1) (2) (3) (4) (5) (6) (7) (8) (9) (10) (11)
Source A,B lA wA lB wB Ref. Beq,A Beq,B ueq,A ueq,B
[00] [00] [00] [00] [µG ] [ 10−14 erg cm−3] B 0050+402 N,S 120±10 30±10 160±10 40±10 1 3.05±0.93 2.72±0.57 86.3±37.3 68.7±20.2 B 0109+492 N,S 323± 2 210± 5 323± 2 210± 5 2 1.44±0.03 1.36±0.03 19.3± 0.6 17.3± 0.5 B 0136+396 E,W 201± 8 90±10 164± 8 90±10 3 1.81±0.16 3.28±0.30 30.5± 3.9 99.7±12.8 B 0211+326 E,W 167± 5 40±10 140± 5 40±10 1 2.85±0.56 3.03±0.60 75.6±21.0 85.3±23.9 B 0648+733 E,W 200±30 130±20 200±20 130±20 4 0.98±0.18 1.69±0.24 9.0± 2.3 26.4± 5.3 B 0813+758 E,W 250±40 100±10 140±10 100±10 4 1.74±0.21 1.56±0.15 28.0± 4.8 22.6± 3.0 B 0945+734 E,W 370± 3 385±10 440±10 250±50 2 0.96±0.02 1.43±0.22 8.6± 0.3 19.1± 4.0 B 1003+351 E,W 1450±10 160±20 980±10 340±30 5 0.86±0.08 0.70±0.04 6.9± 0.9 4.6± 0.4 B 1209+745 N,S 150±30 170±10 112±10 180±10 2 1.29±0.14 1.35±0.09 15.3± 2.4 16.9± 1.6 B 1213+422 N,S 168± 3 40±10 141±10 40±10 6 2.57±0.50 2.70±0.58 61.2±16.9 67.7±20.5 B 1309+412 N,S 186± 3 120±10 186± 3 120±10 3 1.44±0.09 1.31±0.08 19.2± 1.7 15.8± 1.4 B 1312+698 E,W 352± 5 95±10 174± 5 95±10 7 1.53±0.12 2.32±0.19 21.8± 2.3 50.1± 5.7 B 1358+305 N,S 200± 8 210±20 180±30 130±20 8 1.26±0.10 1.24±0.21 14.7± 1.6 14.4± 3.5 B 1426+295 E,W 365±10 140±20 350±20 115±15 9 0.99±0.11 1.06±0.12 9.1± 1.4 10.4± 1.7 B 1450+333 N,S 100±10 40± 5 120±10 40± 5 6 3.71±0.45 2.70±0.32 127.5±21.8 67.8±11.5 B 1543+845 N,S 170±20 60± 5 185±20 60±10 4 2.03±0.20 1.85±0.29 38.3± 5.4 31.7± 7.1 B 1626+518 N,S 360±30 45±10 320±30 150±20 10 1.84±0.36 1.24±0.15 31.3± 8.8 14.2± 2.5 B 1918+516 N,S 180± 5 75± 5 210±10 90±10 7 2.00±0.11 1.35±0.14 37.1± 2.9 16.8± 2.4 B 2043+749 N,S 195±20 115±15 195±20 150±15 11 1.62±0.18 1.80±0.17 24.2± 4.0 30.2± 4.0 B 2147+816 N,S 370±20 120±10 310±20 120±10 9 0.94±0.08 1.04±0.09 8.1± 0.9 10.1± 1.2 References: (1) 1.4-GHz WSRT data (Paper I); (2) J¨agers 1986; (3) Vigotti et al. 1989; (4) Lara et al. (in preparation); (5) Mack et al. 1997; (6) FIRST survey; (7) 1.4-GHz WSRT data (unpublished); (8) Parma et al. 1996; (9) NVSS survey; (10) R¨ottgering et al. 1996; (11) Riley & Warner 1990.
GRGs in our sample and we relate this to the properties of their environment, the IGM.
6.1. Energy densities of the radio lobes
We have calculated the equipartition energy densities and magnetic field strengths in the lobes of the FRII-type GRGs in our sample. We have used a method similar to that outlined by Miley (1980). To determine the luminos-ity of each lobe, we have used the integrated 325-MHz flux densities (see Table 3). The spectral index of each lobe has been calculated between 325 MHz and 10.5 GHz. In case of significant steepening of the radio spectrum at frequen-cies below 10.5 GHz this value will be too low, but the influence of this on the result is only marginal (see Miley 1980).
The volumes of the radio lobes have been estimated assuming a cylindrical morphology. The width has been taken as the deconvolved average full width of the lobe,
measured between the 3σ contours on a radio contour
map. The length of the lobe, whenever a clear gap ex-ists between the core and the tail of the radio lobe (see, e.g., B 0648+733, B 2147+816), has been taken as the dis-tance between the innermost and outermost edge of the lobe at 325 MHz. The radio axes have been assumed to be in the plane of the sky; although this is certainly not the case for the majority of sources, the correction factors are not large compared to the uncertainties introduced by assuming cylindrical morphologies. These used lobe di-mensions are quoted in Table 7. Further assumptions are a filling factor of the radiating particles of unity and an equal distribution of energy between electrons/positrons and heavy particles such as protons. The low and high-frequency cut-offs in the radio spectra have been set at 10 MHz and 100 GHz, respectively.
In Table 7 we present the equipartition magnetic field strengths and energy densities of the lobes of the FRII-type sources in our sample. We find that the magnetic
field strengths are low, typically a fewµG. Consequently,
A.P. Schoenmakers et al.: Multi-frequency radio observations of GRGs 309
Fig. 9. Profiles of the equipartition energy density distribution along the major axes of several of the radio sources. The zeropoint is the position of the radio core. The numbers along the upper axis denote the distance from the core in units of kpc. Negative values are on that side of the source which is mentioned first in column two of Table 7
the magnetic field strengths (u ∝ B2), are low. This is
as expected since the GRGs are extremely large and not exceptionally powerful.
6.2. Pressure gradients in the lobes
The equipartition energy densities in Table 7 are the lobe volume averaged energy densities. Within the lobes, how-ever, large variations may be present. To investigate this, we have made profiles of the equipartition energy
den-sity for the FRII-type sources above 70 in size. We have
used the same method as we have used to find the spec-tral index profiles in Sect. 5.1, i.e. by superposing on the source an array of boxes of width half the FWHM beam-size. In each box we have determined the average decon-volved width of the lobe by measuring the distance
be-tween the 3σouter contours, and we have integrated the
325/354-MHz flux density. The spectral index of each box was calculated between 325/354 MHz and 10.5 GHz. In the case of B 0813+758 and B 1209+745 we used the 1.4-GHz NVSS map as the high-frequency map in order to employ the higher resolution available. In all cases the radio maps were first convolved to the lowest resolution map used. Only in boxes where the integrated flux
den-sity at both frequencies exceeded 3σ, the spectral index
was calculated and the equipartition energy density deter-mined. In case of the sources B 0050+402 and B 0648+733, the deconvolved lobe widths were below zero, and we have therefore omitted these sources from further analysis. The reason for this is not entirely clear to us.