Does Paying Politicians More Promote Economic Diversity in
Legislatures?
NICHOLAS CARNES
Duke University
ERIC R. HANSEN
University of North Carolina at Chapel Hill
I
f politicians in the United States were paid better, would more middle- and working-class people become politicians? Reformers often argue that the low salaries paid in state and local governments make holding office economically infeasible for lower-income citizens and contribute to the enduring numerical under-representation of the working class in our political institutions. Of course, raising politicians’ salaries could also make political office more attractive to affluent professionals, increasing competition for office and ultimately discouraging lower-income citizens from running and winning. In this article, we test these hypotheses using data on the salaries and economic backgrounds of state legislators. Contrary to the notion that paying politicians more promotes economic diversity, we find that the descriptive representation of the working class is the same or worse in states that pay legislators higher salaries. These findings have important implications for research on descriptive representation, political compensation, and political inequality.P
olitical observers often argue that the low salaries paid in state and local governments make holding office economically infeasible for lower-income citizens. Journalists worry that “working-class people . . . do not have the means or the time to run for office and serve” (Fausset 2014, 1). Activists argue that “[a]s long as state legislatures are part-time and poorly funded, it is an uphill battle for an ordinary person to serve and pay the bills at the same time” (Confidential2014, 1). And reformers assert that “[i]t is past time for an honest debate about [raising] legisla-tive pay . . . to make it possible for a broad cross section of people to serve” (Fitzsimon 2010, 1). Running a campaign and holding a political office take time and money. If politicians were paid better, the argument goes, more middle- and working-class people could af-ford to be politicians (see also Blumberg2014).Would raising politicians’ salaries actually encourage more people of modest means to seek and hold polit-ical office? Although observers routinely argue that it would, there is surprisingly little empirical evidence on this point. Scholarly research onpoliticians’ salaries
has recently focused more on outcomes like legislative productivity (e.g., Ferraz and Finan2009); to date, no published study has examined how the salaries paid to politicians in the United States affect whether more and less affluent Americans seek and hold public office. Likewise, the emerging literature onthe numerical or descriptive representation of social classeshas started to investigate why so few middle- and working-class
Nicholas Carnes is Assistant Professor of Public Policy and Po-litical Science, Sanford School of Public Policy, Duke University ([email protected]).
Eric R. Hansen is Ph.D. candidate, Department of Political Sci-ence, University of North Carolina at Chapel Hill([email protected]. edu).
The authors are grateful for financial support from the Sanford School of Public Policy at Duke and for advice and feedback from Andrea Campbell, Steve Rogers, Chris Clark, Chris Faricy, Brice Acree, Kelsey Shoub, Andrew Tyner, the faculty and students at the University of North Carolina American Politics Research Group, and three anonymous reviewers. A previous version of this article was presented at the 2015 Annual Meeting of the Midwest Political Science Association.
people hold political office in the United States, but that work has focused primarily on voters, parties, and in-terest groups (e.g., Carnes2013; Sadin2012; Sojourner 2013), not on institutional rules like legislative salaries. There are certainly reasons to suspect that offer-ing politicians in the United States higher salaries would encourage more lower-income and working-class Americans to hold political office, but there are also good reasons to be skeptical. Raising politicians’ salaries could make holding office more feasible for the less fortunate, but it could also make political of-fice more attractive to affluent professionals, increas-ing competition for office and ultimately discourag-ing lower-income citizens from runndiscourag-ing and winndiscourag-ing. In other advanced democracies, political institutions that pay more tend to attract more white-collar profes-sionals (e.g., Gagliarducci and Nannicini2013). Giving politicians in the United States a pay raise might make holding office more affordable for the working class, but it might also make public office more attractive to white-collar Americans.
In this article, we use data on state legislatures in the United States to measure the relationship between politicians’ salaries and the social class makeup of polit-ical institutions. Drawing on aggregate-level data from the National Conference of State Legislatures (NCSL) and data from the 2012 National Candidate Study— a one-of-a-kind individual-level survey of the 10,000 state legislative candidates who ran for office that year—we explore the links between legislative salaries and the occupational makeup of state-level candidates and politicians. Our findings have important implica-tions for scholars and activists interested in politicians’ salaries, the social class makeup of government, and reforms to address political inequality.
POLITICIANS’ SALARIES AND ECONOMIC
DIVERSITY
government, the meaning of fair compensation, and a host of other weighty normative issues. It also evokes more straightforward empirical questions. Would pay-ing politicians more give us leaders who are less cor-rupt? More responsive to their constituents? More likely to run again? More diverse?
The answers are often “yes.” A growing body of em-pirical research suggests that politicians’ salaries are associated with a wide range of important outcomes. When politicians in the United States are paid more, they are less likely to pursue outside employment while serving in office (Maddox2004), they introduce more legislation and miss fewer votes (Hoffman and Lyons 2015), they are more in-step with their constituents ide-ologically (Besley2004), they are more likely to run for re-election (Diermeier, Keane, and Merlo2005), they favor citizen interests over business interests (Bowen and Mo2016), and they face more competition from qualified challengers (Hoffman and Lyons2015). There is also some evidence that more Democrats are elected when politicians are paid more (Fiorina1994) and that party leaders are more involved in candidate recruit-ment (Sanbonmatsu2006). How much we pay our po-litical leaders seems to affect the kind of government we get in return.
Does it also affect the economic or social class backgrounds of our political decision makers, as re-formers often claim? The idea seems worth explor-ing. Politicians in the United States tend to be vastly better off than the people they represent; they are wealthier, more educated, and more likely to come from white-collar jobs (Beckett and Sunderland1957; Domhoff1967; Hyneman 1940; Key 1956; Matthews 1954a;1954b; Mills1956; Orth1904; Sadin2012; Squire 1992; Zeller1954). If millionaires were a political party, that party would make up just three percent of the country, but it would have a majority in the House of Representatives, a filibuster-proof supermajority in the Senate, a 5-4 majority on the Supreme Court, and a man in the White House. If working-class Americans— people employed in manual-labor and service-industry jobs—were a political party, that party would have made up more than half of the country since the start of the 20th century, but legislators from that party (those who last worked in blue-collar jobs before getting into politics) would never have held more than two percent of the seats in Congress.
These economic and social class gaps appear to have important consequences for public policy. One emerg-ing line of research has found that lawmakers from different classes tend to bring different perspectives to the political process. Just as the shortage of women in office affects policy outcomes on issues related to gender (e.g., Berkman and O’Connor1993; Swers2002; Thomas1991), the shortage of working-class people— who tend to be more progressive on economic issues— appears to bias policy on issues like the minimum wage, taxes, and welfare spending towards the more conservative positions typically favored by affluent Americans (e.g., Carnes2013; Grose2013; Griffin and Anewalt-Remsburg2013). Building on these findings, another nascent literature has begun to ask why there
are so few working-class Americans in political office in the first place (Sadin2012; Sojourner2013; see also Campbell and Cowley2014). If paying politicians more does in fact promote economic diversity in our political institutions, it would have important implications for research on descriptive representation—and for Amer-ican democracy more generally.
As it stands, we simply don’t know. Research on the factors that discourage lower-income and working-class Americans from holding political office is still relatively new, and most of the work that has been done to date has focused not on institutional factors like legislator salaries, but on factors like the qualifica-tions of the working class (Carnes2013), the views of voters (Sadin2012), and the strength of labor unions (Carnes2016; Sojourner2013). A handful of political compensation studies have examined the links between legislative salaries and the number of college graduates or attorneys in office (Besley2004; Diermeier, Keane, and Merlo 2005; Hoffman and Lyons 2015; Kotako-rpi and Poutvaara2011),1but no compensation study
to date has asked about the political representation of the working class. Although reformers often argue that pay raises for politicians would encourage lower-income and working-class Americans to run for and hold public office, to the best of our knowledge, no previous study ever has directly tested this claim.
There are certainly signs that the argument has promise. What little research there is on the descrip-tive representation of lower-income or working-class people suggests the shortage of workers in office is
not the result of either a deficit of qualifications on the part of workers or some sort of antiworker bias on the part of voters (e.g., Sadin 2012). Institutional rules like salaries could be a part of the explanation; scholars have long known that the structure of political institutions can affect the descriptive representation of other social groups like women or racial and ethnic minorities (e.g., Canon 1999; Trounstine and Valdini 2008; see also Rosenson2006).
Then again, there are also signs that paying politi-cians more might not increase the representation of the less fortunate. Across different levels of government, larger jurisdictions like states or counties—which usu-ally pay politicians higher salaries—tend to havefewer
working-class politicians (Carnes 2013). And in gen-eral, legislative professionalization appears to make it difficult for underrepresented groups to break into office (e.g., Casellas2011; Squire1992). If we wish to
understand the links between politician compensation and the social class makeup of government, we will need to look more carefully at that relationship.
How Salaries Could Matter
We will also need to think more carefully about it. When reformers discuss political compensation, they seldom spell out exactly how they believe it will af-fect the descriptive representation of different social classes.
One important distinction that is often obscured in popular discussions is the difference between how salaries affectwho runs,who wins, andwho runs again. The numerical or descriptive representation of any so-cial group is determined by the number of people from that group who run for office, the number of those who win election, and the number who subsequently choose to run again, either for the same office or for another level or branch of government (e.g., Lawless and Fox2005;2010). When reformers talk about the links between legislative salaries and the descriptive representation of the working class, however, they sel-dom specify exactly which part of the larger office-holder “pipeline” is affected by the salaries offered to politicians.
Moreover, reform proposals often focus on how pay raises for politicians might affect lower-income or working-class Americans without also considering how increasing legislative salaries would affect the incen-tives of more affluent citizens. Even if raising legislative salaries makes holding office more attractive to the less fortunate, if it also makes holding office more attrac-tive to affluent professionals, higher pay could actually stimulate more heated competition for elected office and ultimately make it harder for working-class Amer-icans to break into politics. The relationship between politicians’ salaries and working-class representation simply may not be as straightforward as reformers of-ten suggest.
To the contrary, it is easy to imagine a variety of mechanisms by which legislative salaries could increase
ordecrease the numerical representation of the work-ing class among candidates, officeholders, and office-holders who run again.
The most common argument among reformers is that higher pay wouldincreasethe number of working-class people whorun, or perhaps the number who run for re-election. One version of this argument holds that when pay is low, people with low incomes, less flexi-ble work schedules, and less savings or wealth simply can’t afford to pay their bills while holding office—the utility associated with being a politician is unbearably negative, so they choose not to run in the first place. (This idea is consistent with someeconomic threshold
models of candidate entry, e.g., Maddox2004.) Another version (which reformers mention less often but which is consistent with some theoretical work on candidate entry, e.g., Mattozzi and Merlo2008) holds that rais-ing politicians’ salaries would initially make holdrais-ing office more appealing to people making low incomes
(who could increase their earnings by several orders of magnitude by serving in office) than to people making high incomes. In either case, the potential mechanism is essentially the same: raising politicians’ salaries could increase the benefits workers associate with holding office (more than it increases the utility boost profes-sionals receive), and thereby increase the number of lower-income Americans who run for office or for re-election.
Then again, there are also reasons to think that paying more might reduce the percentage of work-ers who choose to run or run again. For one, paying politicians more could make holding office more at-tractive to white-collar professionals by reducing the opportunity cost associated with holding office; recent theoretical models of candidate quality have argued that paying politicians more will simply give affluent professionals more material incentives to forego high-paying jobs in the private sector (e.g., Besley 2004; Besley and Coate1997; see also Osborne and Slivinski 1996). Raising salaries could also increase the status or prestige associated with holding office, which could in turn increase the number of professionals who run (by making public office more attractive to people who already work in prestigious jobs) and/or decrease the number of workers who run (by making people who work in less prestigious jobs feel less well-suited for a job in politics). Paying politicians more could also alter the behavior of the party and interest group leaders who often recruit candidates; when politicians are paid better, these gatekeepers may be more likely to look to highly paid occupations for potential recruits (e.g., Sanbonmatsu2006), which could increase the number of professionals who run and/or decrease the number of workers who run. And if more professionals ultimately run when pay is higher, the heightened competition could itself discourage working-class candidates from running. In theory, there are a host of mechanisms by which pay raises for politicians could ultimately shrink the share of workers who run for office or for re-election.
There are also reasons to think that paying more couldreducethe percentage of workers whowin(over and above any effect it has on workers’ representa-tion in the candidate pool). If public office pays more, voters might expect politicians to more closely resem-ble people who earn high pay in other areas of life. Although there is no prior research on this topic, it is at least conceivable that raising politicians’ salaries more could actually reduce the odds that voters will elect the working-class candidates who run. (And we know of no reason to think the opposite, that is, that higher pay might make voters more likely to elect workers.)
the share of professionals who run and reducing the share of workers).
And, of course, there are also reasons why we might expect salaries not to have any effect on the social class makeup of who runs, who wins, or who runs again. Obviously, there are many factors besides the rate of pay for politicians that could discourage working class Americans from holding office. Workers might have a harder time raising campaign donations, have less interest in politics, or lack necessary skills like public speaking. Or perhaps the salary paid to politicians isn’t the problem, but rather the salary (or lack thereof) paid tocandidates: for many lower-income Americans, taking time off work to run a campaign may simply be impossible regardless of the salary they would earn if elected. The numerical representation of the work-ing class might have nothwork-ing to do with the salaries we offer politicians; there are many other factors that could be discouraging workers from running, winning, or running for re-election.
So which is it? Are reformers right that the shortage of working-class politicians is partly the result of the low salaries offered in most political offices? Or would paying more drive the share of workers in our political institutions even lower? Or simply have no effect on the economic diversity of our government?
EVIDENCE FROM STATE LEGISLATURES
One way to begin improving our answers to these im-portant questions is to study state legislatures. States are ideal for several reasons. State politicians are more numerous than federal officials—for every member of Congress, there are roughly 13 state legislators. And states tend to vary more than federal institutions. Com-pared to members of Congress, state legislators are far more diverse in terms of the salaries they earn, the contexts in which they campaign and govern, and the social classes they come from.
Moreover, states governments make important de-cisions. States write and administer economic policies ranging from minimum wage and income tax rates to cash assistance levels for needy families. In 2008, state government expenditures totaled more than $1.2 tril-lion (more than 8 percent of GDP).2And at the state
level, the social class makeup of government seems to affect policy as much as it does at the federal level (Carnes2013, chap. 5).
As a test of the idea that paying politicians more increases the numerical representation of the working class, we analyzed data on the salaries offered to state legislators and the number of candidates and office-holders in each state legislature who worked primarily inworking-class jobs, that is, manual labor jobs (like factory worker), service-industry positions (like
restau-2Available online fromhttp://www.census.gov/govs/estimate/ (ac-cessed August 16, 2010). This estimate reflects direct expenditures excluding intergovernmental transfers to local governments.
rant server), clerical jobs (like receptionist), or union jobs (like field organizer).3
Collecting data on state legislative salaries was rela-tively straightforward. Scholars interested inlegislative professionalismhave amassed a great deal of accurate, over-time data on the average salaries paid to legisla-tors in all 50 states (e.g., Squire 1992;2007). Legisla-tive compensation varies dramatically. At the low end, New Hampshire pays most of its legislators $200 per two-year term, while New Mexico pays no salary at all (though New Mexican legislators do receive a roughly $150 per diem while meeting in Santa Fe). At the high end, legislators in California, Michigan, and New York all earn over $75,000 annually.
Collecting data on the economic or social class back-grounds of politicians is more challenging. Surveys of candidates and officeholders at the state level are rare, and many of those that have been conducted have not asked about legislators’ occupational backgrounds. Al-though many states list legislators’ occupations on the web, the practice is relatively new—below the national level, systematic biographical information about office-holders is often hard to come by. Biographical data oncandidatesis even harder to get. Many candidates for state office run small campaigns, have limited web presences, are never covered extensively by the media, and quickly remove campaign materials from the web after election time.
For this analysis, we relied on two sources of data on state legislators’ and candidates’ occupations: an aggregate-level dataset on state legislators (that is, those who won elections and went on to hold of-fice) and an individual-level dataset on candidates for state legislature (successful or not). The aggregate-level dataset consisted of information about the oc-cupational makeup of legislators in all 50 states. In 1979, the Insurance Information Institute of America compiled data on the main occupations held by every state legislator nationwide and published the results in state-level aggregates. In 1993, 1995, and 2007, the Na-tional Conference of State Legislatures followed suit. We used a dataset that combined all four waves of data (see also Carnes 2013, chap. 5) to determine whether working-class people are, in fact, more likely to serve
in the state legislature in times and places where doing so pays more.
To determine whether working-class people are more likely to run, win, and run again when hold-ing office pays more, we also analyzed a unique na-tional survey of state legislative candidates, the 2012 National Candidate Study (or NCS). In August 2012, Broockman et al. (2012) surveyed the 10,131 people running for state legislature nationwide at that time. The study achieved a 19 percent response rate—1,907 state legislative candidates submitted responses—and the survey appeared to capture the views of a repre-sentative sample of candidates (response rates were well-balanced on several important observable char-acteristics, like the party of the candidate, whether the candidate went on to win or lose the election, the candidate’s vote margin, and the candidate’s re-gion; see Broockman and Skovron2013). Moreover, the response rate did not seem to be higher among the affluent (a common concern in survey research): the survey’s respondents included 52 workers (3% of respondents), a sample about as large as we would expect based on other exhaustive studies of the social class backgrounds of state legislators (see appendix Table A1for additional supporting information) and large enough to make at least simple inferences about candidates from the working class.4With this dataset,
we can see not just whether working-class people are more likely towinoffice in places that pay politicians more, but whether workers are more likely torunfor offices that pay better orrun againafter being elected. The National Candidate Study also included ques-tions that tapped some of the potential mediating fac-tors that could be driving any relationships we observe between salaries and the share of workers who run or win, like how concerned each candidate was about losing income while holding office. Together, these datasets allowed us to test the link between legisla-tive salaries and the overall descriplegisla-tive representation of the working class (e.g., whether workers held of-fice), the behaviors of workers (whether they made up greater shares of candidates who ran, won, or ran again), and some of the attitudes that might mediate those relationships (e.g., whether workers worried less about lost income in states that paid more).
POLITICAL COMPENSATION AND
ECONOMIC DIVERSITY
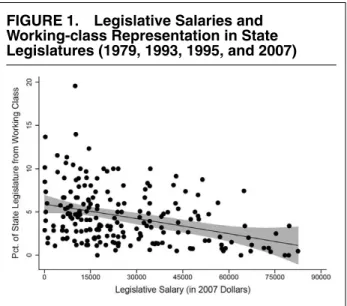
Figure 1uses the aggregate-level data from 1979, 1993, 1995, and 2007 to plot the basic relationship between how well a state pays its legislators (adjusted to 2007 dollar values) and the percentage of lawmakers in that state from working-class jobs. The pattern in the data
4Of course, 52 is not a huge number, and obviously an ideal study would have more working-class candidates. However, we know of no better data on the occupational backgrounds of a national sample of state legislative candidates; if we wish to leave no stone unturned in this analysis, we cannot ignore the Broockman et al. survey. (More-over, as we show below, our findings using this survey parallel what we find using aggregate-level data from the National Conference of State Legislatures, which increases our confidence in both datasets.)
FIGURE 1. Legislative Salaries and Working-class Representation in State Legislatures (1979, 1993, 1995, and 2007)
Source: Insurance Institute of America (1979), National Con-ference of State Legislatures (1993, 1995, 2007), and authors’ data collection.
is unmistakable; in states that pay legislators higher salaries, working-class citizens make upsmallershares of the state legislature, not larger ones.
In sharp contrast to the idea that pay raises make public office more accessible to the working class, the political representation of workers is worst in states that pay legislators salaries over $75,000—about 2 per-cent on average—and best in states that pay legis-lators next to nothing—about 7 percent on average. Of course, 7 percent is still far lower than the share of working-class people in the general public, which stands at around 52 percent. (Salaries clearly aren’t the only factors keeping working-class Americans out of office.) In terms of the hypotheses in question, how-ever, the findings reported inFigure 1offered no sup-port for the idea that working-class citizens hold office in larger numbers when state legislative salaries are relatively higher (in which case we would expect a pos-itive association inFigure 1) or when salaries exceed some economic threshold (in which case we would ex-pect a spike somewhere). To the contrary, these data on state legislatures are squarely in line with the argu-ment that paying politicians more makes holding office more attractive to professionals, not more attainable for workers.5
Of course, states that offer higher and lower salaries to legislators might also differ in other ways. States that pay more tend to have more professionalized legisla-tures, larger populations, and more big cities. They also tend to elect more liberal members.6 Even when we
5Excluding the visible outlier inFigure 1(Maine 1979) from the analysis did not alter these or any subsequent results.
6To see if better-paid legislators are more conservative on average, we calculated the average ideal point among lawmakers in each state in 2007 using data from Shor and McCarty (2011). Higher salaries were weakly correlated with more liberal state legislatures (r =
TABLE 1. Legislative Salaries and Working-Class Representation
Model 1 Model 2
Professionalization
Salary (in $10,000s) −0.41∗ −0.57∗ (0.14) (0.16)
Session Length (in days) 0.00 0.00
(0.01) (0.01) Staff Size (in individuals) −0.15∗ −0.06
(0.07) (0.08)
Political context
South (indicator) 0.78
(0.72) Unionization rate (percentage) 0.14∗ (0.04)
Term limits (indicator) 0.33
(0.87)
Income inequality −0.21
(% of income to top 1%) (0.12)
Percent Black (percentage) −0.08∗
(0.03)
Percent urban (percentage) −0.03
(0.02)
Poverty rate (percentage) −0.05
(0.08)
GOP vote share (percentage 0.00
of two-party vote) (0.02)
Income (avg. per capita −0.03
personal income) (0.05)
Intercept 6.57∗ 8.76∗
(0.57) (2.85)
Year fixed effects Yes Yes
N 200 200
R2 0.23 0.37
Source: Insurance Institute of America (1979), National Confer-ence of State Legislatures (2012), and authors’ data collection.
Notes: Cells report estimates from regression models relating the percentage of state lawmakers from the working-class in each state in 1979, 1993, 1995, and 2007 to the variables listed here.∗p<0.05, two tailed.
took these kinds of differences into account, however, we still observed the same basic relationship evident in Figure 1. Table 1 below reports the results of two least squares regression models. In both, we regressed the percentage of legislators from the working class in each state in the pooled aggregate-level dataset (n =
200; 50 states×4 years) on the official salary paid to state lawmakers (again, adjusted to 2007 dollars). In the first model, we also added fixed effects for each year (models that use state and year random effects with bootstrapped standard errors produced similar results; see Appendix Table A2). We also controlled for two additional measures of how professionalized the state legislature was. Scholars who study legisla-tive professionalism typically measure the concept with data on legislative salaries, the number of staff mem-bers employed by the average state legislator, and the average length of a legislative session in that state.7To
7Specifically,Staff Sizeis the average number of full-time, perma-nent staff employed by the legislature, divided by the number of
account for the possibility that states that pay legis-lators more also demand more from them—and that these demands, not the salary itself—drive down the representation of the working class, we added controls for staff size and session length to the first model in Table 1.
Viewed this way, our results were essentially the same. According to the first model in Table 1, states that paid legislators $75,000 tended to have about three percentage points fewer working-class state legislators than states that paid next to nothing. Of course, legisla-tive compensation and other measures of profession-alization go hand in hand—the correlation between legislative salaries and session length was 0.56, the cor-relation between salaries and staff size was 0.65, and the correlation between session length and staff size was 0.38. Even with these controls in the model, however, we still observed a significant negative association be-tween salaries and working-class representation. This isn’t to say that the smaller and nonsignificant coef-ficients on staff size and session length are evidence that these aspects of professionalism are unimportant, of course; to the contrary, the point estimates for staff size and session length may well be attenuated due to the strong correlation between the three professional-ization variables. Model 1 does not rule out the possi-bility that staff size and session length affect working-class representation; it simply illustrates that legisla-tive salaries are not mere proxies for other aspects of legislative professionalization, that is, that the associa-tion between salaries and working-class officeholding documented inFigure 1is not simply being driven by a lurking correlation between salaries and other as-pects of professionalization. States that pay more have fewer working-class politicians—and it doesn’t seem to be simply because they have more professionalized legislatures.
The same was true when we added additional con-trols that captured other aspects of the political envi-ronment. In the second model in Table 1, we added four simple political context measures: (1) an indicator for Southern states, (2) a measure of the unionization rate (Hirsch and Macpherson 2003), which has been found to predict working-class representation in state legislatures, (3) an indicator for states that had term limits for state legislators, and (4) the partisan makeup of the state (the Republican percentage of the two-party vote in the last presidential election). We also controlled for three measures of the state economy: (1) a measure of economic inequality (the percentage of income earned by the top one percent of earners; Frank 2009); (2) average per capita personal income (from the Census Bureau and adjusted for inflation), and (3) the poverty rate (from the Census Bureau). And we added two additional demographic variables: the percentage of state residents who were Black and the percentage who lived in urban areas (from the Census Bureau). If the salary paid to legislators in a
state was simply a proxy for some other feature of the political landscape, adding these controls should have dampened our results.
If anything, however, these controls sharpened our original findings. Consistent with prior research (e.g., Carnes2016; Sojourner2013), we found a positive as-sociation between unionization and the political rep-resentation of the working class, perhaps reflecting the role of unions in encouraging working-class people to run or supporting their campaigns. We also found a negative association between economic inequality and working-class representation, perhaps suggesting that in states where workers are more economically disad-vantaged overall, they have a harder time running for office or winning elections. And we did not find as-sociations between working-class representation and legislative session length or staff size (a finding that seemed to support the idea that working-class repre-sentation is not a response to the size of the reward or burden associated with winning office).
Even with these controls in the model, moreover, we continued to observe a negative association between state legislative salary and working-class representa-tion (in fact, the associarepresenta-tion was slightly larger and more precise in the second model in Table 1). The same was true when we carried out a series of addi-tional robustness checks (available on request), includ-ing estimatinclud-ing the models for each of the four years separately, using an alternative measure of legislative salaries (Bowen and Greene2014), and controlling for the legal procedures each state used to raise legislative pay. Although we did not have sufficiently fine-grained data to estimate panel or time series models (since we had only four years in our sample), we checked that
changes in legislative pay between our first and last waves were not associated withchanges in working-class representation during that time period (see Figure A1 in the Appendix). They weren’t. We also estimated models that analyzed not the salary offered to state legislators, but the relative boost in salary a worker might receive (by subtracting the average per capita in-come in each state from the salary paid to state legisla-tors; seeTable A3in the Appendix). And although the data inFigure 1did not appear to exhibit a quadratic relationship, we tested a quadratic model and found no evidence of a curvilinear relationship—it did not seem to be the case that increasing legislative salaries from $0 at first makes holding officefeasiblefor lower-income and working-class people (seeTable A4in the Appendix). We also estimated models that controlled for the distance to the state capital (following Silber-mann2015; seeTable A5), the partisan composition of the legislature (seeTable A6), the sophistication of the state party organizations (seeTable A7), the competi-tiveness of the two parties in the state (seeTable A8), the size of the state budget (seeTable A9), and the cost of campaigns in each state (seeTable A10). Regardless of how we analyzed the data, we consistently found that states that offer higher salaries to their legislators have
fewerworking-class politicians, not more.
Who is taking their place? The answer seems to be
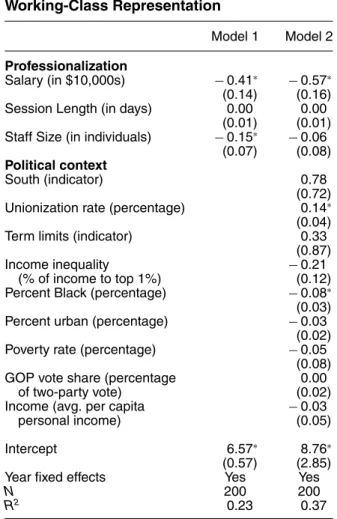
career politicians. InFigure 2, we use the aggregate data
fromFigure 1to plot the occupational makeup of state legislatures against legislative salaries, this time focus-ing on several other occupational categories in the data: lawyers, business owners, service professionals (like teachers and social workers), and career politicians. Most occupations were either about as common in state legislatures that paid more (like law), or less common (like business and service professions). The striking exception across all of the occupational categories in the dataset wascareer politicians, legislators who were classified as working primarily in politics (and not any other outside job). In states that pay state legislators more, state legislators are more likely to be people who work exclusively in politics. Paying politicians more doesn’t seem to make holding office more accessible to the working class—it seems to make holding office more of a career.
Of course, it’s possible that in states that pay higher salaries, working-class citizens are more likely to run for office, win, but then eventuallybecomecareer politi-cians. Does offering more compensation to politicians encourage more lower-income and working-class peo-ple to run, then start them on the path towards long careers in office?
WHO RUNS, WHO WINS, AND WHO RUNS
AGAIN
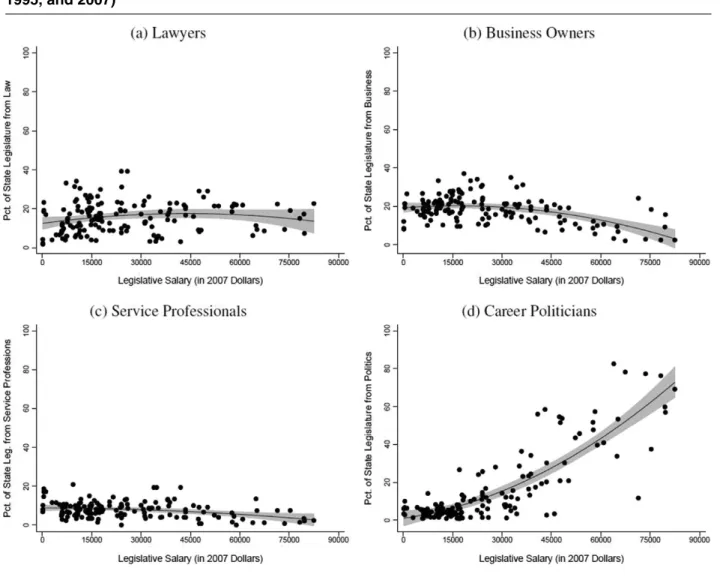
More fine-grained individual-level data on state leg-islative candidates in 2012 suggests that the answer is no. The 2012 Broockman et al. National Candidate Study asked respondents a highly detailed question about their occupational backgrounds: “What is your primary occupation? (If holding a political office is cur-rently your primary occupation, what was your primary occupation before you got into politics?)” With this information, we can see whether politicians from the working class—even those who have given up working-class jobs in favor of careers in politics—are more likely to hold office in states that pay higher salaries.
The National Candidate Study also included items that asked whether each candidate was an incumbent, items that asked whether each candidate had ever held any other elected office, and data on whether each candidate ultimately won the 2012 election. With this information, we were able to ask whether working-class Americans are more likely to run in states that pay more, win in state that pay more, and run again.
FIGURE 2. Legislative Salaries and the Occupational Makeup of State Legislatures (1979, 1993, 1995, and 2007)
Source: Insurance Institute of America (1979), National Conference of State Legislatures (1993, 1995, 2007), and authors’ data collection.
controls for other aspects of the political environment.) In states that pay politicians more, working-class peo-ple (even those who have gone on to make a career out of politics) don’t appear to be more likely to run, to win, or to run again.
HOW CANDIDATES THINK ABOUT
SALARIES
In our aggregate-level data, states that pay more have fewer blue-collar workers in their legislatures. In our individual-level data, states that pay more have about as many blue-collar candidates. Our individual-level estimates are noisier, of course. (Our aggregate-level data are based on information about every legislator in every state, whereas when we average our individual-level data, we only have information about 19 per-cent of state legislative candidates.) Regardless, both datasets cast doubt on the idea that paying politicians
more would encourage more working-class Ameri-cans to hold office. At best, paying more isn’t as-sociated with any change in economic diversity. At worst, it’s associated with decreases in working-class representation.
What might be going on in the minds of potential candidates? Does raising salaries really affect how peo-ple think about holding office? Reformers who sup-port higher pay for politicians often argue that raising salaries would make holding office more affordable for working-class Americans. Research under the heading ofcandidate quality, on the other hand, has long main-tained that paying politicians more will make politi-cal service more attractive to highly paid profession-als (Besley2004; Besley and Coate1997; Caselli and Morelli2004; Osborne and Slivinski1996).
FIGURE 3. When Legislatures Pay More, Do Workers Run, Win, or Run Again?
Source: 2012 National Candidate Study (Broockman et al.2012).
financial opportunity cost associated with holding of-fice. The survey included an item that asked respon-dents, “Many people who think about running for office choose not to because of the many personal challenges entailed in seeking public service. When you first ran for elected political office, did you feel seriously con-cerned about any of the following?” One option was “Losing out on income while serving in office.” An-other was “Losing the job I had at the time [I first decided to run].”
Figure 4plots the percentages of working-class (left two panels) and white-collar (right two panels) respon-dents in each state who reported that they worried about losing income and losing their jobs the first time they ran for office. In states that paid more, working-class candidates reported similar levels of anxiety about losing their jobs and incomes. White-collar candidates, however, reported significantly lower levels of anxiety about losing their incomes and slightly higher levels of concern about losing their jobs. Consistent with the idea that paying more can offset the opportunity cost of holding office for highly paid professionals, in states that compensate politicians more generously,
white-collar professionals are less worried about losing their incomes. (Again, we reached the same conclu-sion when we estimated regresconclu-sion models—available on request—with controls for other aspects of the po-litical environment.) Professionals seem to recognize that running for office may mean giving up their day jobs, but they seem significantly less worried about lost income in states that pay more.
FIGURE 4. When Politics Pays More, Do Workers and Professionals Worry Less About Money?
Source: 2012 National Candidate Study (Broockman et al.2012).
pay more, our analysis of the concerns candidates ex-pressed suggested that paying politicians more doesn’t do much to reduce the barriers to seeking office for workers—and may make running more attractive to professionals.
SHOULD POLITICIANS GET A PAY RAISE?
In a recent story on a proposed salary hike for Arizona legislators, Blumberg (2014, 1) reports an interview with Morgan Cullen, a policy analyst for the National Conference of State Legislatures:
In states with low salaries, like Arizona, Cullen says many lawmakers are retirees or independently wealthy business owners who can afford to run. “You want those indepen-dently wealthy people, you want the retirees, but you also want people in their income-earning years as well so that you are representing the population as a whole.”
Reformers often argue that the low salaries paid in many of our political institutions ensure that only the wealthy can afford to run for office and that offer-ing higher salaries would attract more middle- and working-class Americans.
According to our data, paying politicians more doesn’t seem to promote economic diversity.
Of course, our study has several important limita-tions that are worth reiterating. We only study one level and branch of American political institutions, state leg-islatures. We only examine the time periods for which we have appropriate data. We are only able to test one of the many mechanisms that might link politi-cian compensation and working-class representation. And although we do our best to control for poten-tial confounding variables, our analyses are based on observational data, with all the lurking problems that entails. Going forward, the empirical burden of proof would seem to be on those who maintain that paying politicians more would increase the representation of the working class—our study is the only one on this topic, and it doesn’t find what reformers expect—but a great deal more work could still be done on this issue.
From the standpoint of research on politician salaries, the most important limitation of this study is that it only focuses on one political outcome—the numerical representation of different social classes— out of the many that might be linked to compensation rates. Politicians’ salaries are associated with whether they hold outside jobs, how productive they are in our legislatures, how in-step they are with their con-stituents, and whether they run for re-election. These are all important features of our political process that we have to consider and balance when answering ques-tions about whether politicians should get a pay raise. For scholars interested in politicians’ salaries, this study provides a new piece of evidence about how salaries matter, but obviously salaries matter in many other ways.
A second important limitation from the standpoint of research on politicians’ salaries is that this analy-sis is limited to the United States. Much of the re-cent research on officeholder compensation has been conducted using cross-national data. It is important to keep in mind that results from the United States states may not generalize to other countries or regions (for instance, the relationship between political compensa-tion and working-class representacompensa-tion may be different in countries that have workers’ parties) and that follow-up work using cross-national samples is still needed before we can make generalizations about salaries and working-class representation outside of the United States.
For scholars interested in why so few working-class people hold political office in the United States, this study seems to rule out another potential culprit. Work-ers probably aren’t to blame for being unqualified, vot-ers probably aren’t to blame for being biased against workers—and governments probably aren’t to blame for paying politicians too little. It also suggests that
resources may not be the only driver of class-based differences in officeholding. It’s possible that working-class people are less likely to run for office because they simply have a harder time affording it, but it’s also possible that they’re less likely to run because they aren’t interested in holding office or because they
aren’t recruited. (This hunch is squarely in line with the finding in Table 1 that more workers hold office in states with higher unionization rates and with prior research on unions and working-class representation.) Resources could still matter, of course—for instance, the loss of a salary whilecampaigningmight be a far bigger impediment for working-class people than the salary offered while holding office. For scholars inter-ested in explaining why the United States is run by a white-collar government, this study’s findings sug-gest that there is far more to the story than politi-cians’ salaries—and maybe more than just resources alone.
Last, for reformers, the lesson of this study is straight-forward. Activists and political observers should stop saying that raising legislative salaries would make hold-ing office more accessible for middle- and workhold-ing- working-class Americans or that it would reduce working-class-based political inequalities. It probably wouldn’t.
APPENDIX: SUPPORTING INFORMATION
Table A1 notes:To check that the data in the 2012 National
Candidate Study were suitable for this analysis, we com-pared data on the percentage of working-class candidates among the candidates (third column) and winners (second column) in the NCS to the percentage of officeholders from the working class in the 2007 National Conference of State Legislatures data (first column). Although the samples were from different years, the percentage of workers in the 2007 NSCL dataset was positively correlated with the percentage of workers who won office in the 2012 NCS (as we report in bold at the bottom of the table), which suggests that the
FIGURE A1. Change in Legislative Salaries and Working-Class Representation in State Legislatures, 1979–2012
TABLE A1. Social Class Balance in the 2007 NCSL Dataset and the 2012 NCS Survey
% of % Workers % Workers
Workers Among Among
in Office Winners Candidates
NCSL NCS NCS
Sample 2007 2012 2012
AK 10.00 0.00 3.70
AL 1.40
AR 3.00 0.00 0.00
AZ 1.08 0.00 7.69
CA 0.00 0.00 2.63
CO 3.06 0.00 4.65
CT 1.10 0.00 4.65
DE 8.11 0.00 0.00
FL 4.39 0.00 0.00
GA 3.00 0.00 0.00
HI 1.31 0.00 3.03
IA 3.39 2.86 2.86
ID 1.96 0.00 0.00
IL 1.20 0.00 0.00
IN 4.70 0.00 2.50
KS 5.51 0.00 0.00
KY 4.40 0.00 0.00
LA 4.31
MA 0.50
MD 3.79
ME 5.91 3.33 6.67
MI 3.39 1.32 2.63
MN 2.50 0.00 4.00
MO 2.22 1.33 5.33
MS 4.71
MT 2.00 2.90 5.80
NC 1.67 0.00 0.00
ND 3.60 0.00 5.00
NE 4.10 0.00 0.00
NH 2.89 1.52 1.52
NJ 5.00 0.00
NM 4.45 3.23 3.23
NV 4.79 3.57 3.57
NY 0.00 0.00 0.00
OH 0.80 0.00 6.45
OK 1.43 5.88 5.88
OR 3.40 0.00 2.63
PA 0.40 0.00 0.00
RI 8.06 4.76 4.76
SC 1.18 0.00 0.00
SD 1.90 0.00 0.00
TN 1.50 0.00 0.00
TX 2.80 0.00 0.00
UT 2.90 0.00 5.66
VA 2.10
VT 5.10 2.94 4.41
WA 1.40 1.15 2.30
WI 0.80 1.64 8.20
WV 5.92 0.00 0.00
WY 3.30 0.00 0.00
Corr w
first col. 1.00 0.20 −0.03
survey elicited responses from a representative sample of workers.
Importantly, however, the percentage of workers who held office in 2007 was not correlated with the percentage of working-class candidates in the National Candidate Study (third column), which increases our confidence that the re-sponse rate among workers was not endogenous to the out-come of interest (i.e., that workers were not more likely to respond to the survey in states where workers held office in larger numbers).
Table A5 notes:We obtained replication data for
TABLE A2. Legislative Salaries and Working-Class Representation (with state controls)
Model Model Model Model
1 2 3 4
Professionalization
Salary (in $10,000s) −0.41∗ −0.57∗ −0.39∗ −0.45∗ (0.14) (0.16) (0.17) (0.15) Session length (in
days)
0.00 0.00 0.01 0.01 (0.01) (0.01) (0.01) (0.01) Staff size (in
individuals)
−0.15∗ −0.06 −0.18∗ −0.08 (0.07) (0.08) (0.07) (0.08)
Political context
South (indicator) 0.78 0.85
(0.72) (1.01)
Unionization rate 0.14∗ 0.13∗
(percentage) (0.04) (0.06)
Term limits (indicator)
0.33 −0.32
(0.87) (0.93)
Income inequality −0.21 −0.20
(% of income to top 1%)
(0.12) (0.15)
Percent black (percentage)
−0.08∗ −0.09∗
(0.03) (0.04)
Percent urban (percentage)
−0.03 −0.02
(0.02) (0.03)
Poverty rate (percentage)
−0.05 −0.00
(0.08) (0.07)
GOP vote share 0.00 0.04
(percentage (0.02) (0.04)
of two-party vote)
Income (avg. −0.03 −0.04
per capita (0.05) (0.04)
personal income)
Intercept 6.57∗ 8.76∗ 5.70∗ 5.96 (0.57) (2.85) (0.36) (4.45) Year controls fixed fixed rand. rand.
effects effects eff. eff. State controls none none rand. rand.
eff. eff.
N 200 200 200 200
R2 0.23 0.37 0.16 0.36
Source: Insurance Institute of America (1979), National Confer-ence of State Legislatures (2012), and authors’ data collection.
Notes: Cells report estimates from regression models relating the percentage of state lawmakers from the working class in each state in 1979, 1993, 1995, and 2007 to the variables listed here.∗p<0.05, two tailed.
TABLE A3. Relative Boost in Salary and Working-Class Representation
Model 1 Model 2
Professionalization
Legislative salary minus avg. −0.40∗ −0.57∗ per capita income (in $10,000s) (0.14) (0.16)
Session length (in days) 0.00 0.00
(0.01) (0.01) Staff size (in individuals) −0.16∗ −0.06
(0.07) (0.08)
Political context
South (indicator) 0.78
(0.72) Unionization rate (percentage) 0.14∗ (0.04)
Term limits (indicator) 0.33
(0.87)
GOP vote share (percentage 0.00
of two-party vote) (0.03)
Income inequality −0.21
(% of income to top 1%) (0.12)
Poverty rate (percentage) −0.05
(0.08)
Income (avg. per capita −0.09
personal income) (0.06)
Percent black (percentage) −0.08∗
(0.03)
Percent urban (percentage) −0.02
(0.02)
Intercept 5.52∗ 8.95∗
(0.65) (3.13)
Year fixed effects yes yes
N 200 200
R2 0.23 0.37
Adj.R2 0.21 0.32
Source: Insurance Institute of America (1979), National Confer-ence of State Legislatures (2012), and authors’ data collection.
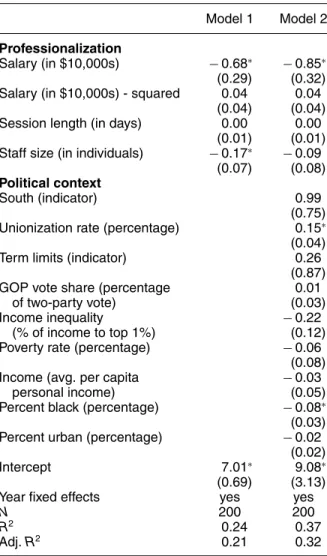
TABLE A4. Quadratic Model of Legislative Salaries and Working-Class Representation
Model 1 Model 2
Professionalization
Salary (in $10,000s) −0.68∗ −0.85∗ (0.29) (0.32) Salary (in $10,000s) - squared 0.04 0.04
(0.04) (0.04)
Session length (in days) 0.00 0.00
(0.01) (0.01) Staff size (in individuals) −0.17∗ −0.09
(0.07) (0.08)
Political context
South (indicator) 0.99
(0.75) Unionization rate (percentage) 0.15∗ (0.04)
Term limits (indicator) 0.26
(0.87)
GOP vote share (percentage 0.01
of two-party vote) (0.03)
Income inequality −0.22
(% of income to top 1%) (0.12)
Poverty rate (percentage) −0.06
(0.08)
Income (avg. per capita −0.03
personal income) (0.05)
Percent black (percentage) −0.08∗
(0.03)
Percent urban (percentage) −0.02
(0.02)
Intercept 7.01∗ 9.08∗
(0.69) (3.13)
Year fixed effects yes yes
N 200 200
R2 0.24 0.37
Adj.R2 0.21 0.32
Source: Insurance Institute of America (1979), National Confer-ence of State Legislatures (2012), and authors’ data collection.
Notes: Cells report estimates from regression models relating the percentage of state lawmakers from the working class in each state in 1979, 1993, 1995, and 2007 to the variables listed here.∗p<0.05, two tailed.
TABLE A5. Legislative Salaries and
Working-Class Representation, Controlling for Distance to the Capital
Model 1 Model 2
Professionalization
Salary (in $10,000s) −0.23 −0.40
(0.17) (0.21) Session length (in days) −0.02∗ −0.02∗ (0.01) (0.01) Staff size (in individuals) 0.10 −0.01
(0.10) (0.14)
Political context
Distance to the capital −0.34 −0.18 (0.31) (0.43)
South (indicator) 0.97
(1.05) Unionization rate (percentage) 0.12
(0.09)
Term limits (indicator) 0.31
(0.66)
GOP vote share −0.08
(percentage of two-party vote) (0.05)
Income inequality 0.03
(% of income to top 1%) (0.21)
Poverty rate (percentage) 0.09
(0.12)
Income (avg. per capita 0.04
personal income) (0.05)
Percent black (percentage) −0.02
(0.05)
Percent urban (percentage) 0.02
(0.03)
Intercept 5.03∗ 3.69
(0.69) (4.91)
N 47 47
R2 0.27 0.43
Adj.R2 0.20 0.21
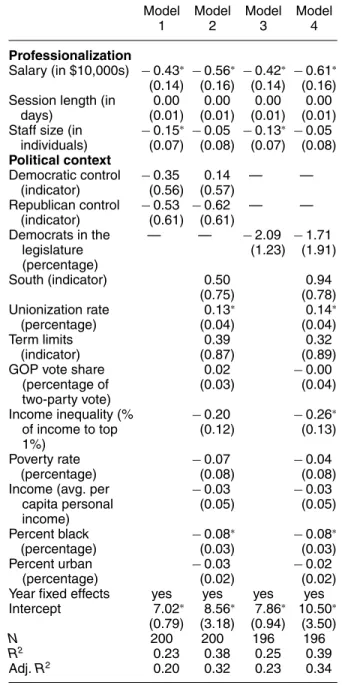
TABLE A6. Legislative Salaries and
Working-Class Representation, Controlling for the Partisan Makeup of the Legislature
Model Model Model Model
1 2 3 4
Professionalization
Salary (in $10,000s) −0.43∗ −0.56∗ −0.42∗ −0.61∗ (0.14) (0.16) (0.14) (0.16) Session length (in
days)
0.00 0.00 0.00 0.00 (0.01) (0.01) (0.01) (0.01) Staff size (in
individuals)
−0.15∗ −0.05 −0.13∗ −0.05 (0.07) (0.08) (0.07) (0.08)
Political context
Democratic control (indicator)
−0.35 0.14 — —
(0.56) (0.57) Republican control
(indicator)
−0.53 −0.62 — —
(0.61) (0.61)
Democrats in the — — −2.09 −1.71
legislature (1.23) (1.91)
(percentage)
South (indicator) 0.50 0.94
(0.75) (0.78)
Unionization rate (percentage)
0.13∗ 0.14∗
(0.04) (0.04)
Term limits (indicator)
0.39 0.32
(0.87) (0.89)
GOP vote share 0.02 −0.00
(percentage of (0.03) (0.04)
two-party vote)
Income inequality (% −0.20 −0.26∗
of income to top (0.12) (0.13)
1%) Poverty rate
(percentage)
−0.07 −0.04
(0.08) (0.08)
Income (avg. per −0.03 −0.03
capita personal (0.05) (0.05)
income) Percent black
(percentage)
−0.08∗ −0.08∗
(0.03) (0.03)
Percent urban −0.03 −0.02
(percentage) (0.02) (0.02)
Year fixed effects yes yes yes yes Intercept 7.02∗ 8.56∗ 7.86∗ 10.50∗
(0.79) (3.18) (0.94) (3.50)
N 200 200 196 196
R2 0.23 0.38 0.25 0.39
Adj.R2 0.20 0.32 0.23 0.34
Source: Insurance Institute of America (1979), National Confer-ence of State Legislatures (2012), and authors’ data collection.
Notes: Cells report estimates from regression models relating the percentage of state lawmakers from the working class in each state to the variables listed here.∗p<0.05, two tailed. Observations from Nebraska, which has a nonpartisan legisla-ture, are omitted for Models 3 and 4.
TABLE A7. Legislative Salaries and
Working-Class Representation, Controlling for the Sophistication of State Party
Organizations
Model 1 Model 2
Professionalization
Salary (in $10,000s) −0.22 −0.55∗ (0.18) (0.22) Session length (in days) −0.01 −0.01
(0.01) (0.01) Staff size (in individuals) 0.08 0.05
(0.11) 0.14
Political context
Democratic sophistication 0.41 −0.66 ($ spent per citizen) (0.95) (1.03) Republican sophistication −0.71 1.39
($ spent per citizen) (1.62) (1.88)
South (indicator) 0.60
(1.21) Unionization rate (percentage) 0.22∗ (0.09)
Term limits (indicator) 0.42
(0.75)
GOP vote share 0.03
(percentage of two-party vote) (0.04)
Income inequality −0.25
(% of income to top 1%) (0.19)
Poverty rate (percentage) −0.05
(0.14)
Income (avg. per capita 0.05
personal income) (0.06)
Percent black (percentage) 0.02
(0.05)
Percent urban (percentage) 0.00
(0.03)
Intercept 4.54∗ 4.68
(0.62) (5.84)
N 50 50
R2 0.19 0.37
Adj.R2 0.10 0.12
TABLE A8. Legislative Salaries and
Working-Class Representation, Controlling for Party Competition
Model 1 Model 2
Professionalization
Salary (in $10,000s) −0.43∗ −0.62∗ (0.14) (0.16)
Session length (in days) 0.00 0.00
(0.01) (0.01) Staff size (in individuals) −0.10 −0.05
(0.07) (0.08)
Political context
Competition (% contests 0.04∗ −0.02
won by<20%) (0.02) (0.02)
South (indicator) 0.70
(0.76) Unionization rate (percentage) 0.15∗ (0.05)
Term limits (indicator) 0.16
(0.93)
GOP vote share (percentage 0.03
of two-party vote) (0.05)
Income inequality −0.26∗
(% of income to top 1%) (0.13)
Poverty rate (percentage) −0.07
(0.09)
Income (avg. per capita −0.02
personal income) (0.05)
Percent black (percentage) −0.09∗
(0.04)
Percent urban (percentage) −0.02
(0.02)
Year fixed effects yes yes
Intercept 5.25∗ 8.10∗
(0.80) (3.63)
N 186 186
R2 0.27 0.38
Adj.R2 0.24 0.32
Source: Insurance Institute of America (1979), National Confer-ence of State Legislatures (2012), and authors’ data collection.
Notes: Cells report estimates from regression models relating the percentage of state lawmakers from the working class in each state to the variables listed here.∗p<0.05, two tailed. Missing observations from Nebraska, Louisiana, and Missis-sippi are dropped from the analysis.
TABLE A9. Legislative Salaries and
Working-Class Representation, Controlling for Budget Size
Model 1 Model 2
Professionalization
Salary (in $10,000s) −0.42∗ −0.69∗ (0.15) (0.18)
Session length (in days) 0.00 0.00
(0.01) (0.01) Staff size (in individuals) −0.07 0.05
(0.08) (0.09)
Political context
State budget size (in billions of $) −0.02 0.02 (0.02) (0.02)
South (indicator) 1.04
(0.75) Unionization rate (percentage) 0.18∗ (0.05)
Term limits (indicator) 0.42
(0.78)
GOP vote share −0.00
(percentage of two-party vote) (0.03)
Income inequality −0.17
(% of income to top 1%) (0.12)
Poverty rate (percentage) −0.03
(0.07)
Income (avg. per capita −0.05
personal income) (0.05)
Percent black (percentage) −0.06
(0.03)
Percent urban (percentage) −0.03
(0.07)
Year fixed effects yes yes
Intercept 6.81∗ 11.41∗
(0.56) (3.10)
N 150 150
R2 0.29 0.42
Adj.R2 0.26 0.35
Source: Insurance Institute of America (1979), National Confer-ence of State Legislatures (2012), and authors’ data collection.
TABLE A10. Legislative Salaries and
Working-Class Representation, Controlling for Campaign Spending (2007 Only)
Model 1 Model 2
Professionalization
Salary (in $10,000s) −0.26 −0.49+ (0.18) (0.23) Session length (in days) −0.01 −0.01
(0.01) (0.01) Staff size (in individuals) 0.03 0.08
(0.11) (0.16)
Political context
Campaign spending 0.79∗ 0.62
($ per citizen) (0.30) (0.38)
South (indicator) 0.99
(1.41) Unionization rate (percentage) 0.10
(0.09)
Term limits (indicator) 0.63
(0.80)
Income inequality (% of −0.19
income to top 1%) (0.21)
GOP vote share (percentage −0.00
of two-party vote) (0.05)
Poverty rate (percentage) −0.14
(0.17)
Income (avg. per capita 0.04
personal income) (0.07)
Percent black (percentage) −0.04
(0.07)
Percent urban (percentage) −0.00
(0.03)
Year fixed effects n/a n/a
Intercept 3.15∗ 6.63∗
(0.78) (6.54)
N 44 44
R2 0.3123 0.4353
Source: National Conference of State Legislatures (2012), au-thors’ data collection, and National Institute of Money in State Politics (2015). Notes: Cells report estimates from regres-sion models relating the percentage of state lawmakers from the working class in each state to the variables listed here.
+p<0.10,∗p<0.05, two tailed. We were only able to obtain
campaign spending data for 2006; as such, these models only use data from 2007.
REFERENCES
Beckett, Paul, and Celeste Sunderland. 1957. “Washington State’s Lawmakers: Some Personnel Factors in the Washington Legisla-ture.”Western Political Quarterly10: 180–202.
Berkman, Michael B., and Robert E. O’Connor. 1993. “Do Women Legislators Matter? Female Legislators and State Abortion Pol-icy.”American Politics Quarterly21: 102–24.
Besley, Timothy. 2004. “Paying Politicians: Theory and Evidence.”
Journal of the European Economic Association2 (2-3): 193–215. Besley, Timothy, and Stephen Coate. 1997. “An Economic Model of
Representative Democracy.”Quarterly Journal of Economics112 (1): 85–114.
Blumberg, Nick. 2014. “Voters to Decide on a Pay Raise for State Lawmakers.” KJZZ, October 23. http://kjzz.org/content/59158/ voters-decide-pay-raise-state-lawmakers(April 2, 2015).
Bowen, Daniel C., and Zachary Greene. 2014. “Should We Measure Professionalism with an Index? A Note on The-ory and Practice in State Legislative Professionalism Re-search.” State Politics and Policy Quarterly 14 (3): 277– 96.
Bowen, T. Renee, and Cecilia Hyunjung Mo. 2016. “The Voter’s Blunt Tool.”Journal of Theoretical Politics28 (4): 655–77. Broockman, David, Nicholas Carnes, Melody Crowder-Meyer, and
Christopher Skovron (producers and distributors). 2012.The 2012 National Candidate Study(dataset).
Broockman, David, and Christopher Skovron. 2013. “What Politi-cians Believe About Their Constituents: Asymmetric Misper-ceptions and Prospects for Constituency Control.” Presented at the “Political Representation: Fifty Years after Miller and Stokes” conference, Nashville, TN. http://www.vanderbilt.edu/ csdi/miller-stokes/(December 3, 2015).
Campbell, Rosie, and Philip Cowley. 2014. “Rich Man, Poor Man, Politician Man: Wealth Effects in a Candidate Biography Survey Experiment.”British Journal of Politics and International Relations
16: 56–74.
Canon, David T. 1999.Race, Redistricting, and Representation: The Unintended Consequences of Black Majority Districts. Chicago: University of Chicago Press.
Carnes, Nicholas. 2013.White-collar Government: The Hidden Role of Class in Economic Policy Making. Chicago, IL: University of Chicago Press.
Carnes, Nicholas. 2016. “Why Are There So Few Working-class Peo-ple in Political Office? Evidence from State Legislatures.”Politics, Groups, and Identities4 (1): 84–109.
Casellas, Jason P. 2011.Latino Representation in State Houses and Congress. New York: Cambridge University Press.
Caselli, Francesco, and Massimo Morelli. 2004. “Bad Politicians.”
Journal of Public Economics88 (3-4): 759–82.
Confidential. 2014. Confidential email to the author, December 10. Diermeier, Daniel, Michael Keane, and Antonio Merlo. 2005. “A
Political Economy Model of Congressional Careers.”American Economic Review95 (1): 347–73.
Domhoff, G. William. 1967.Who Rules America?Englewood Cliffs, NJ: Prentice-Hall.
Fausset, Richard. 2014. “Mostly Black Cities, Mostly White City Halls.”New York Times, September 28.http://www.nytimes.com/ 2014/09/29/us/mostly-black-cities-mostly-white-city-halls.html (April 2, 2015).
Ferraz, Claudio, and Frederico Finan. 2009. “Motivating Politi-cians: The Impacts of Monetary Incentives on Quality and Per-formance.” NBER Working Paper 14906. http://www.nber.org/ papers/w14906(December 10, 2014).
Fiorina, Morris P. 1994. “Divided Government in the American States: A Byproduct of Legislative Professionalism?”American Political Science Review88 (2): 304–16.
Fitzsimon, Chris. 2010. “Legislative Pay the Latest Distortion of the Right.” NC Policy Watch. http://www.ncpolicywatch.com/2010/ 09/02/legislative-pay-the-latest-distortion-of-the-right/#sthash. fwV5WxYS.dpuf(April 2, 2015).
Frank, Mark W. 2009. “Inequality and Growth in the United States: Evidence from the Current Population Survey: Note.”Industrial and Labor Relations Review56 (2): 349–54.
Gagliarducci, Stefano, and Tommaso Nannicini. 2013. “Do Better Paid Politicians Perform Better? Disentangling Incentives from Selection.”Journal of the European Economic Association11 (2): 369–98.
Griffin, John D., and Claudia Anewalt-Remsburg. 2013. “Legislator Wealth and the Effort to Repeal the Estate Tax.”American Politics Research41 (4): 599–622.
Grose, Christian. 2013. “Risk and Roll Calls: How Legislators’ Per-sonal Finances Shape Congressional Decisions.” SSRN Working Paper 2220524. http://papers.ssrn.com/sol3/papers.cfm?abstract id=2220524(June 17, 2015).
Hirsch, Barry T., and David A. Macpherson. 2003. “Union Member-ship and Coverage Database: Note.”Industrial and Labor Rela-tions Review56 (2): 349–54.
Hout, Michael, Jeff Manza, and Clem Brooks. 1995. “The Demo-cratic Class Struggle in the United States, 1948–1992.”American Sociological Review60: 805–28.
Hyneman, Charles S. 1940. “Who Makes Our Laws.”Political Sci-ence Quarterly55: 556–81.
Key, V.O., Jr. 1956.American State Politics: An Introduction. New York: Knopf.
Kotakorpi, Kaisa, and Panu Poutvaara. 2011. “Pay for Politicians and Candidate Selection: An Empirical Analysis.”Journal of Public Economics95 (7-8): 877–85.
Lawless, Jennifer L., and Richard L. Fox. 2005.It Takes a Candidate: Why Women Don’t Run for Office. New York, NY: Cambridge University Press.
Lawless, Jennifer L., and Richard L. Fox. 2010.It Still Takes a Can-didate: Why Women Don’t Run for Office. New York, NY: Cam-bridge University Press.
Maddox, H.W. Jerome. 2004. “Opportunity Costs and Outside Ca-reers in U.S. State Legislatures.”Legislative Studies Quarterly29 (4): 517–44.
Matthews, Donald R. 1954a.The Social Background of Political Decision-Makers. New York: Random House.
Matthews, Donald R. 1954b. “United States Senators and the Class Structure.”Public Opinion Quarterly18: 5–22.
Mattozzi, Andrea, and Antonio Merlo. 2008. “Political Careers or Career Politicians?”Journal of Public Economics92: 597–608. Mills, C. Wright. 1956.The Power Elite. New York: Oxford University
Press.
National Institute of Money in State Politics. 2015. Elec-tion Overview.http://www.followthemoney.org/election-overview (December 8, 2015).
Orth, Samuel P. 1904. “Our State Legislatures.”Atlantic Monthly94: 728–39.
Osborne, Martin J., and Al Slivinski. 1996. “A Model of Political Competition with Citizen-Candidates.”Quarterly Journal of Eco-nomics111 (5): 65–96.
Rosenson, Beth A. 2006. “The Impact of Ethics Laws on Legislative Recruitment and the Occupational Composition of State Legisla-tures.”Political Research Quarterly59 (4): 619–27.
Sadin, Meredith. 2012. “Campaigning with Class: The Ef-fect of Candidate Social Class on Voter Evaluations.” http://cess.nyu.edu/policon2012/wp-content/uploads/2012/ 02/Campaigning-with-Class-CESS-2012-Sadin.pdf (June 17, 2015).
Sanbonmatsu, Kira. 2006.Where Women Run: Gender and Party in the American States. Ann Arbor, MI: University of Michigan Press. Shor, Boris, and Nolan McCarty. 2011. “The Ideological Mapping of American Legislatures.”American Political Science Review105 (3): 530–51.
Silbermann, Rachel. 2015. “Gender Roles, Work-Life Balance, and Running for Office.”Quarterly Journal of Political Science10 (2): 123–53.
Sojourner, Aaron. 2013. “Do Unions Promote Electoral Office-Holding? Evidence from Correlates of State Legislatures’ Occu-pational Shares.”Industrial and Labor Relations Review66 (2): 467–86.
Squire, Peverill. 1992. “Legislative Professionalization and Member-ship Diversity in State Legislatures.”Legislative Studies Quarterly
17 (1): 69–79.
Squire, Peverill. 2007. “Measuring State Legislative Professionalism: The Squire Index Revisited.”State Politics and Policy Quarterly7: 211–27.
Swers, Michele. 2002.The Difference Women Make. Chicago: Uni-versity of Chicago Press.
Thomas, Sue. 1991. “The Impact of Women on State Legislative Policies.”Journal of Politics53: 958–76.
Trounstine, Jessica, and Melody E. Valdini. 2008. “The Context Mat-ters: The Effects of Single-Member versus At-Large Districts on City Council Diversity.”American Journal of Political Science52: 554–69.
Weeden, Kim A., and David B. Grusky. 2005. “The Case for a New Class Map.”American Journal of Sociology111: 141–212. Wright, Erik Olin. 1997. “Rethinking, Once Again, the Concept of
Class Structure.” InReworking Class, ed. John Hall. Ithaca, NY: Cornell University Press.