THREE ESSAYS ON THE IMPACT OF HIGH-NET-WORTH SCIENCE PHILANTHROPY
Emily I. Nwakpuda
A dissertation submitted to the faculty at the University of North Carolina at Chapel Hill in partial fulfillment of the requirements for the degree of
Doctor of Philosophy in the Department of Public Policy.
Chapel Hill 2020
Approved by: Maryann P. Feldman Daniel Gitterman Daniel Goroff
ABSTRACT
Emily I. Nwakpuda: Three Essays on the Impact of High-Net-Worth Science Philanthropy (Under the direction of Maryann P. Feldman)
This dissertation extends the public management and public policy literatures to include
individual science philanthropy as a distinct funding source for the support of science and innovation.
This dissertation is composed of three essays attempting to identify the trends, outcomes, and the
motivations associated with science philanthropy. Using a mix of quantitative and qualitative methods,
each dissertation essay uses a different methodology and develops original data to address aspects of this
topic. A philanthropic database, funded by the Sloan Foundation and a National Science Foundation
(NSF) Dissertation Improvement Award, was developed to study this topic. Machine learning techniques
augmented the development of this database.
In the first essay, econometric techniques identify trends in large gifts to support the natural
sciences, technology, engineering, and mathematics (STEM) disciplines at US colleges and universities.
Entrepreneurial status is found to be a key characteristic of high-net-worth donors who support STEM or
academic science. By disaggregating high-net-worth donors who support science and technology from all
other donors, this essay ultimately provides new insights on the profile of donors to academic science.
The second essay is focused on research centers and institutes established by large gifts from individual
donors identified in the philanthropic database. Interviews with center representatives, center directors
and fundraisers, assess the impact of the centers. In the final essay, two experimental surveys evaluate
individuals’ motivations for supporting science and innovation. The results of the two surveys
demonstrate new insights on entrepreneurs’ and non-entrepreneurs’ philanthropic inclinations towards
To my mom, Barbara Ann Thompson Nwakpuda.
ACKNOWLEDGEMENTS
This dissertation would not have been possible without the support and encouragement of
personal and professional advisors. I am indebted to these individuals for helping me continue to move
forward, when at times completion seemed too difficult. The research consultation and career advice from
all the following individuals shaped and enhanced my dissertation research.
My doctoral advisor, Dr. Maryann P. Feldman, was immensely generous with her time and
advice. Dr. Feldman challenged me to be innovative and progress my research agenda towards a research
career. I cannot thank her enough for all she has taught me. Notably, Dr. Feldman encouraged my
participation in conferences, seminars, grant writing, and project management opportunities throughout
my doctoral studies.
I extend my sincerest thanks to my dissertation committee members Daniel Gitterman, Daniel
Goroff, Douglas MacKay, Julie Marks, and Joaquin Rubalcaba. Their insightful feedback and unwavering
support throughout my time at UNC Chapel Hill has been invaluable. I foresee their advice being
meaningful throughout my professional career.
I received research support that greatly enhanced this dissertation project. I wish to acknowledge
research support from the Alfred P. Sloan Foundation and the National Science Foundation. I thank
Lauren Lanahan for providing data. I would also like to acknowledge Ted Zoller, Bernard Bell, Pete
McEntegart, Tarryn Henry, Jason Widen, and Jason Doherty for survey distribution assistance. I
appreciate the assistance of Kevin Thompson, Beth Thompson, Arthur Wasserman, Susan B. Ervin, and
Andrea Morris for providing expert interviews.
I would not have been able to successfully navigate the doctoral program without the support of
my fellow PhD cohort members, Dillan Bono-Lunn, Ipsita Das, Ghazal Dezfuli, Frank Otchere, and
graduate students at UNC which include Alexandra Graddy-Reed, Yuna Kim, Andre Assumpcao, Averi
Chakrabarti, Paige Clayton, Marlous De Milliano, and Aspacia Stafford. These individuals helped me
remain happy and focused on finishing my PhD as we embraced the same life goals.
Lastly, my family, friends, and church have nurtured my dreams of earning my PhD. This dream
began at North Carolina Central University, which is located in my hometown, Durham, NC. I maintained
this dream after my Peace Corps service, but I may not have attended graduate school if Dr. RaJade
Berry-James had not recruited me to become a Masters of Public Administration student at North
Carolina State University. As I finish my degree at UNC, I would be remiss if I did not thank the late
Harris Johnson and Kathy Wood, co-director of the Initiative for Minority Excellence (IME), for
TABLE OF CONTENTS
LIST OF TABLES ... ix
CHAPTER 1: INTRODUCTION ... 1
Essay One ... 2
Essay Two ... 3
Essay Three ... 3
REFERENCES ... 5
CHAPTER 2: MAJOR DONORS AND HIGHER EDUCATION: ARE STEM DONORS DIFFERENT FROM OTHER DONORS? ... 6
Abstract ... 6
Introduction ... 7
Science Philanthropy and Higher Education ... 9
Data ... 12
Methodology ... 14
Results ... 15
Limitations ... 24
Discussion and Conclusions ... 24
REFERENCES ... 27
CHAPTER 3: HIGH-NET-WORTH DONORS AS ANGEL INVESTORS IN ACADEMIC SCIENCE CENTERS ... 32
Abstract ... 32
Introduction ... 33
Investor Donors ... 34
Methodology ... 35
Results ... 37
Discussion ... 48
REFERENCES ... 53
CHAPTER 4: ENTREPRENEURS’ TRANSITION TO PHILANTHROPY: EMPIRICAL EVIDENCE FROM AN EXPERIMENTAL SURVEY ... 58
Abstract ... 58
Introduction ... 59
To Give or Not to Give? ... 60
Research Design ... 62
Experiment One ... 63
Experiment Two ... 70
Discussion and Conclusions ... 78
REFERENCES ... 81
APPENDIX A: ADDITIONAL TABLES FROM CHAPTER 2 ... 84
APPENDIX B: ADDITIONAL TABLES FROM CHAPTER 3 ... 85
LIST OF TABLES
Table 2.1: Descriptive statistics of full and stratified samples of STEM and non-STEM major gifts. ... 16
Table 2.2: Counts of major gifts received by non-STEM and STEM academic disciplines. ... 17
Table 2.3: Quantile regressions results for STEM major gift amount by donor characteristics. ... 19
Table 2.4: Quantile regressions results for non-STEM major gift amount by donor characteristics. ... 20
Table 2.5: OLS regressions of the full and stratified STEM and non-STEM samples ... 23
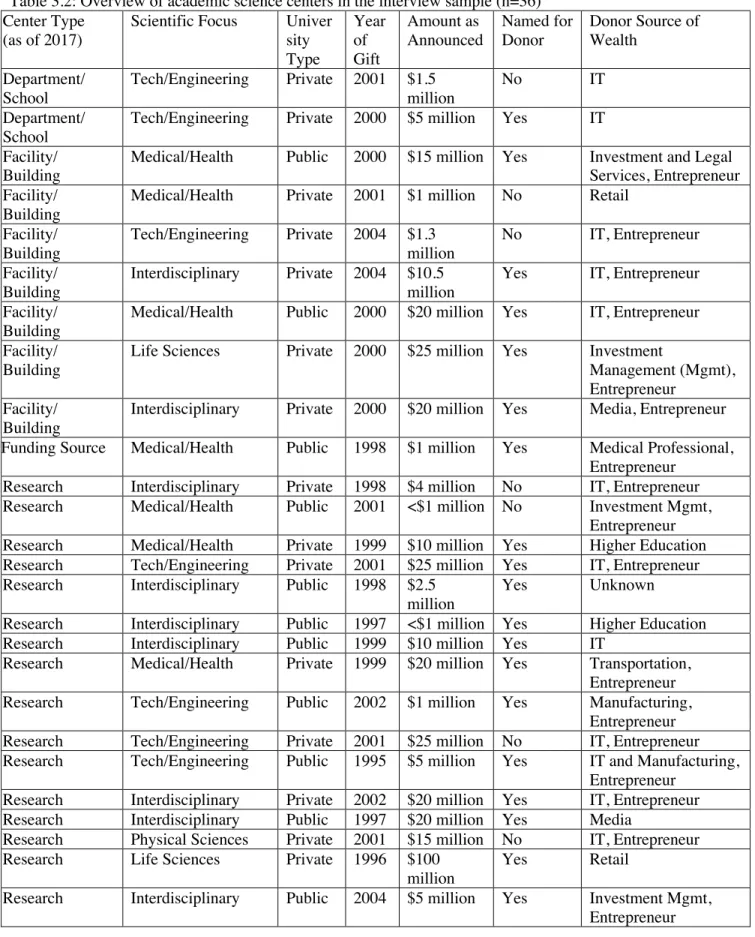
Table 3.1: Summary of the operational status of announced gifts to found academic science centers. ... 36
Table 3.2: Overview of academic science centers in the interview sample (n=36) ... 38
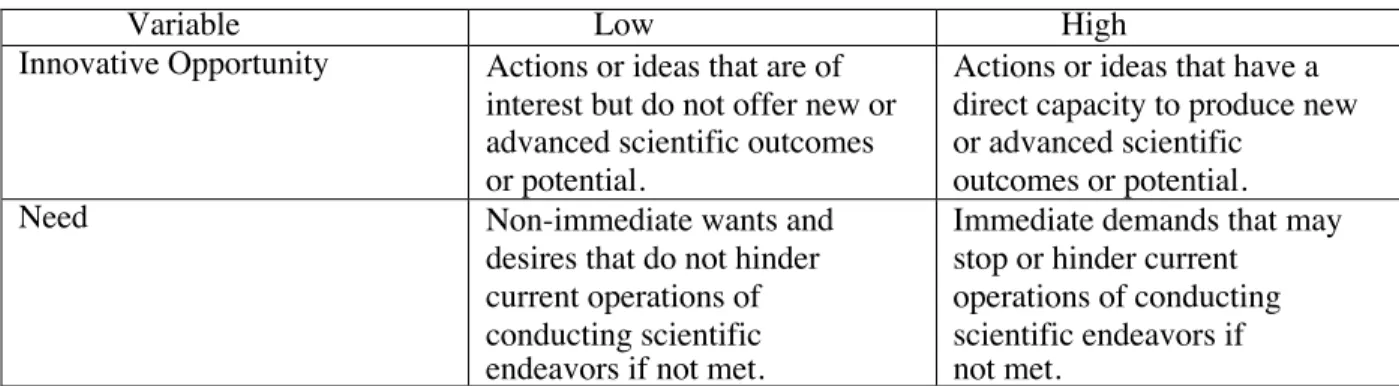
Table 4.1: Operationalization of decision attributes ... 63
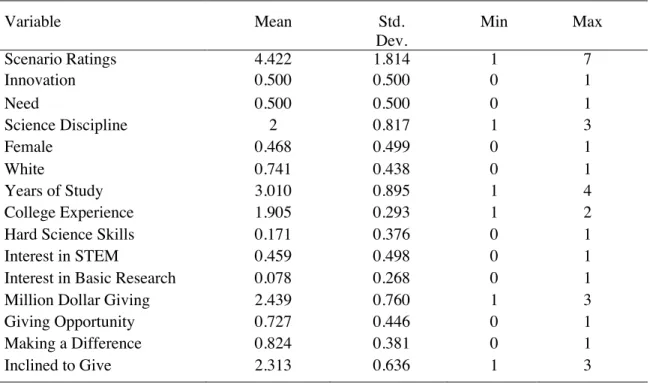
Table 4.2: Descriptive statistics of variables in experiment one analyses with student participants ... 66
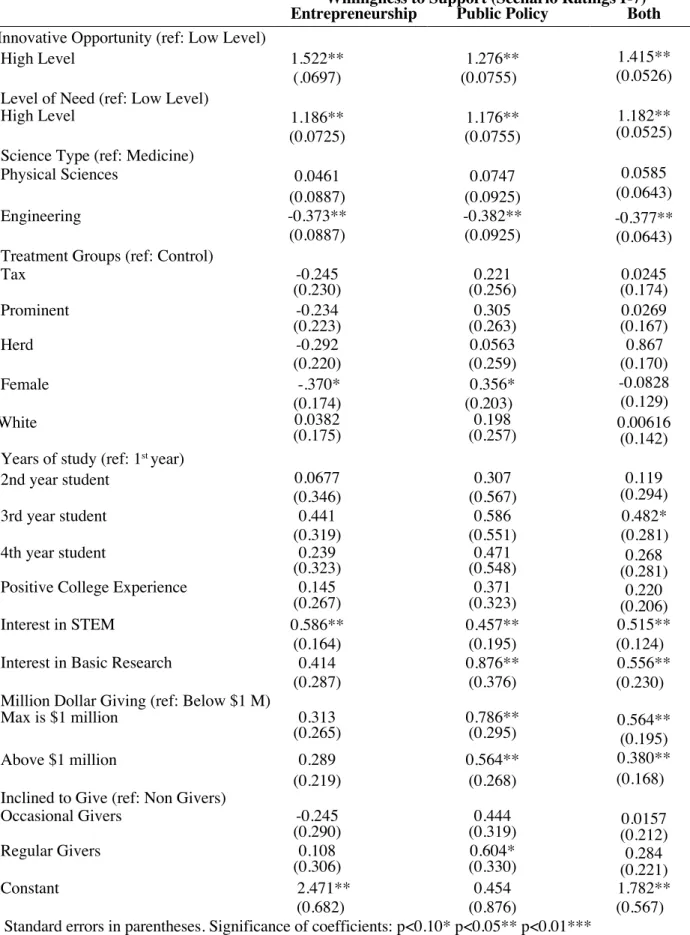
Table 4.3. Multilevel estimates for willingness to support academic science for students ... 68
CHAPTER 1: INTRODUCTION
Brown and Ferris (2007) regard philanthropic activity as any private action intended for the public
good. The term philanthropy is frequently equated to charitable giving in academic literature, but, as
opposed to charity, philanthropy is focused on alleviating root causes and not just symptoms (Katz, 2005).
Giving philanthropic dollars requires some financial capacity to give before a potential donor cycles
through the process of becoming a receptive, engaged, and committed donor; learning to give can happen
in various ways (Siegel & Yancey, 2003). In light of this, philanthropic dollars constitute an important
element of nonprofit finance and public finance that is rough with complexities due to its dependence on
human nature.
Radley and Kennedy (1995) note motive as the first predictor of giving behavior and that donors
are usually assumed to have some altruistic motive(s). Altruism is commonly understood as a selfless
concern for others. More specifically, Bierhoff (1987) defines altruism as a self initiated voluntary act with
the intention to help others without any expectation for an external reward. In contrast, Andreoni (1989)
argues that the traditional model of altruistic giving is not general enough to confirm even the broadest
empirical data on giving. Andreoni concludes that altruism is a part of the explanation of charitable giving,
but it cannot offer a complete explanation of the extensive (whether or not to give at all) or the intensive
(how much to give) nature of giving to provide a public good.
Unmet social needs left by gaps in the governmental social safety net have traditionally been
addressed by nonprofit organizations, communities, and philanthropic individuals. According to Andreoni
(2004), the public policy interest in philanthropy is strong. Notably, it is commonly thought that the need
for governmental provisions of public goods will decrease if provided by private philanthropy as a substitute
Another consideration is that tax policies in the US incentivize philanthropic giving, but Reich (2012) warns
against limiting our understanding of philanthropy to tax subsidies. Furthermore, Goldberg (2009) notes
there is not always a clear rhyme or reason for why donors give and what causes receive support.
Philanthropy has become more complex as high-net-worth or major donors move away from
traditional philanthropy and seek more engaged forms of philanthropy. How and what this small number
of wealthy donors decide to fund has long term implications. Ostrander (2007) argues that there should be
public concern about wealthy donors’ growing control over philanthropic resources. An added complexity
of high-net-worth donors’ behavior is their ability to “shape” the causes they support (Schervish, 2005). A
traditional donor, who is more accustom to pure grant making, considers overly engaged donor behavior to
be intrusive and a potential conflict of interest (Unwin, 2005).
This dissertation has a three essay format that provides empirical evidence on the phenomenon of
high-net-worth donors’ support of the natural sciences, technology, engineering, and mathematics (STEM).
The objective of each chapter is to understand the trends, impacts, and motivations of individual donors
who support academic science. Few scholars evaluate questions of who provides philanthropic gifts to
academic science, why they give, and what outcomes result. Focusing on these vantage points is the
scholarly contribution of this work. Taken together, the findings of the dissertation chapters raise important
questions about the role of donors in addressing the needs of scientific research and development (R&D)
activities at public and private research universities. Below is a more in-depth summary of each dissertation
essay followed by each dissertation essay in full.
Essay One
High-net-worth donors’ philanthropic gifts to academic science is an under researched topic, as
data on individual donors’ large gifts to academic science are typically classified among “other” forms of
philanthropy. To address this problem, essay one uses an original database of large gifts to higher education
from more than 6,000 unique high-net-worth donors and nearly 950 unique academic institutions. The
database was augmented with data from governmental sources and machine learning techniques to then
US colleges and universities. There is variation in how donors’ characteristics influence gift amount when
comparing STEM and non-STEM fields. Quantile regression is used to understand these relationships. Most
interesting is the finding that donors’ entrepreneurial status has a positive effect on gift amount at the 99th
quantile (worth $100 million or more). Findings suggests there is potential value in segmenting
high-net-worth donors to leverage them as an alternative source of funding for academic science.
Essay Two
Essay two investigates the impacts of scientific research centers established by large gifts from
high-net-worth donors. Scientific research centers were identified within the database from essay one.
Trends in high-net-worth donors’ support of scientific research centers are the focal point of this research
because the creation of a research center has scientific, social, and economic ramifications. Interviews with
research center directors and center fundraisers—supplemented with quantitative data on publications,
patents, and follow-on funding—assess centers relationships with donors, operations of the centers, and the
impact of these research centers. The impacts of scientific research centers established by large
philanthropic gifts are found to be limited and highly variable. This essay also makes the argument that
modern donors, many of whom are wealthy entrepreneurs, view their philanthropic gifts as investments
akin to those of angel investors. This argument offers new considerations for resource management and
organizational innovation as these donors’ investments have long term impacts on an organizations’
operations and ability to tackle complex problems.
Essay Three
Essay three explores prospective donors’ motivations using a within-subjects design of an online
multi-stage scenario experiment with control and experimental conditions. The pilot experiment was
launched in November of 2017 with entrepreneurship student participants who were randomly assigned to
a treatment or control condition. Student participants (n=205) in the pilot experiment were asked to rate 12
entrepreneurial students and public policy students in which entrepreneurial individuals respond to highly
innovative projects. Both groups are equally likely to fund high-innovation projects in medicine and
physical science. A second experimental survey in the fall of 2018 with entrepreneurs (n=122) focuses on
quantum physics, a highly innovative field of the physical sciences. This experiment features a more
interactive design, such as a video embedded within the experiment, to increase the understanding of survey
participants. Entrepreneurs’ willingness to support quantum science was found to be elastic, which further
REFERENCES
Andreoni, J. (1989). Giving with impure altruism: Applications to charity and Ricardian equivalence. Journal of Political Economy. 97(6), 447–58.
Andreoni, J. (2004). Economics of philanthropy. In Serge-Christophe Kolm & Jean Mercier Ythier (Eds.), Handbook of Giving, Reciprocity and Altruism (pp. 11369-76). Elsevier.
Andreoni, J. & Payne, A. A. (2003). Do government grants to private charities crowd out giving or fundraising?. American Economic Review 93(3), 792–812.
Bierhoff, H. (1987) Donor and recipient: Social development, social interaction and evolutionary processes. European Journal of Social Psychology, 17(1), 113-130.
Brown, E., & Ferris, J. M. (2007). Social capital and philanthropy: An analysis of the impact of social capital on individual giving and volunteering. Nonprofit and Voluntary Sector Quarterly, 36(1), 85-99.
Goldberg, S. (2009) Billions of drops in millions of buckets: Why philanthropy doesn’t advance social progress, Hoboken, New Jersey: Wiley and Sons, Inc.
Katz, S. N. (2005). What does it mean to say that philanthropy is "effective"? The philanthropists' new clothes. Proceedings of the American Philosophical Society, 149(2), 123-131.
Ostrander, S. A. (2007). The growth of donor control: Revisiting the social relations of philanthropy. Nonprofit and Voluntary Sector Quarterly, 36(2), 356–372.
Radley, A., & Kennedy, M. (1995). Charitable giving by individuals: A study of attitudes and practice. Human Relations, 48(6), 685-709.
Reich, R. (2012). A failure of philanthropy: American charity shortchanges the poor, and public policy is partly to blame. Civic Investment in Education, 42.
Roberts, R.D. (1984). A positive model of private charity and public transfers. Journal of Political Economy, 92(1), 136–148.
Schervish, P. G. (2005). Major donors, major motives: The people and purposes behind major gifts. New Directions for Philanthropic Fundraising, 47, 59-87.
Siegel, D., & Yancey, J. (2003). Philanthropy’ forgotten resource? Engaging the individual donor: The state of education today & a leadership agenda for the road ahead. The Donor Education Initiative—Final Report.
CHAPTER 2: MAJOR DONORS AND HIGHER EDUCATION: ARE STEM DONORS DIFFERENT FROM OTHER DONORS?
Abstract
Philanthropic support of higher education is a growing area of interest among academic fundraisers and
philanthropy scholars. STEM disciplines, in particular, are in need of a better understanding of their major
donors. This article analyzes a unique database of announced gifts to higher education institutions from
1995 to 2017 to investigate relationships between major donors’ characteristics and the magnitude of their
gifts to STEM and all other academic disciplines. Major donors to STEM are disproportionately
entrepreneurs who, on average, give larger gifts to STEM than other major donors. Quantile regressions
reveal a positive and statistically significant relationship between major donors’ entrepreneurial status and
gift amounts at the 99th quantile (worth US $100 million or more). As major funding sources for
academic STEM are increasingly threatened, these findings are pertinent to academic institutions seeking
to leverage major donors as an alternative source of funding.
Introduction
Private donors have consistently been the primary financial supporters of philanthropic causes in
the United States. High-net-worth donors are driving philanthropic giving (List, 2011), although less
wealthy donors give higher proportions of their wealth to charitable causes. The literature on giving
motivations (e.g., religion, identity, social networks, and trust) typically refers to low-dollar philanthropic
donors (e.g., Drezner & Garvey, 2016; Eckel & Grossman, 2004; Herzog& Yang, 2018). Few studies
have explicitly addressed empirical findings on high-net-worth donors’ giving preferences (Osili,
Ackerman, & Li, 2019).
Academic institutions, in particular, attract high-net-worth donors (Holmes, 2009; Monks, 2003).
Universities seek support from development or fundraising professionals in order to raise private funds.
According to the Giving USA Foundation (2019), the education sector, including higher education,
received approximately $58.72 billion from donors in 2018. Academic institutions have used
donor-centric fundraising practices to encourage high-net-worth donors to give (Burnett, 2002), but there is still
a need to critically analyze if their gifts are responsive to the priorities of academic institutions. While
athletics draw much media attention, higher education has ongoing funding difficulties that have affected
all academic disciplines (Lye, Newfield, & Vernon, 2011; Newfield, 2009).
This paper focuses on major gifts from high-net-worth donors (or major donors) who support
STEM. Funding for academic science is a public policy decision of utmost importance. Economic and
political shifts have exposed gaps in our understanding of the appropriate levels of funding basic research.
These gaps are complicated by the phenomenon of diversifying funding sources. These funding sources
include the federal government, state governments, industry partners, foundations, and nonprofit
organizations. Rectifying our understanding of funding gaps depends on the goals of the funding source.
Kohler (1985) argued that philanthropists’ support of science in the university context stemmed
Scientific projects and initiatives have served as opportunities to attract philanthropic dollars (Feldman &
Graddy-Reed, 2014). Potential reasons for this attraction may lie within some distinguishing features of
academic STEM. For example, basic research and applied research and development (R&D) in STEM
disciplines at universities have contributed to industrial innovation (Mansfield & Lee, 1996).
Furthermore, R&D in STEM disciplines at colleges and universities remain critical to the national R&D
enterprise (National Science Board, 2018).
Trends in high-net-worth donors’ gifts to STEM at U.S. colleges and universities have not been
fully explored due to a lack of disaggregated data. High-net-worth donors’ gifts to support STEM at U.S.
colleges and universities are currently categorized by the National Science Board (NSB) as part of the
“other” funding category, alongside nonprofit and foundation funding. The “other” funding category
increased from 6.7% in 2006 to nearly 9.5% in 2016 as federal government funding remained stagnant.
The rise of the “other” funding category warrants scholarly attention as philanthropic dollars become
more important to institutions of higher education.
There is historical evidence of high-net-worth donors’ contributions to academic STEM. Consider
the legacy of early industrialists who provided funding that established academic institutions that now
bear their names, such as Duke, Stanford, and Harvey Mudd. Media coverage of major gifts to academic
institutions have become more common. For example, Phil Knight, the co-founder of the shoe brand
Nike, announced a $500 million gift in 2016 for a new science campus to his alma mater, the University
of Oregon. Another major gift, $30 million to Spelman College in 2018, came from Ronda Stryker and
William Johnston; this gift was used to build a Center for Innovation and the Arts, which seeks to help
students integrate scientific competencies within the liberal arts.
The term “major gift” has historically been applied to variable and unclear size ranges, with the
definition of a major gift often depending on the recipient organization and its fundraising capacity
(Sargeant, Eisenstein, & Kottasz, 2015). In this study, a major gift is defined as a philanthropic
contribution of $1 million or more. This manuscript empirically analyzes 6,815 publicly announced major
distinguishing characteristics of major donors who contribute major gifts to STEM in comparison to
major donors who contribute major gifts to non-STEM fields.
This paper uses quantile regression analysis to assess the relationship between donors’
characteristics and the amount of their major gifts, across the distribution of gift amounts. This approach
accommodates different potential influences across the range of gift amounts. The results suggest that
there are important differences in donor characteristics between STEM and non-STEM major gifts. The
results provide empirical evidence of entrepreneurial status having a strong, positive relationship with
major gift amounts at the 99th quantile of major gifts to STEM, but this is not the case for major gifts to
non-STEM. This means the entrepreneurial status of donors may be a distinguishing characteristic of the
wealthiest STEM donors as academic fundraisers seek to promote STEM projects. List (2011) argued for
the need for additional information for successful donor prospecting and cultivation. Ultimately, the
funding characteristics of STEM donors are relevant to modern institutions seeking to leverage major
donors as an alternative funding source for academic science, especially STEM.
In the next section, I examine the existing literature on science philanthropy from the lens of
higher education. This brief literature review describes the understudied, but growing, field of science
philanthropy. After an explanation of the data and methodology is provided, STEM and non-STEM
donors’ giving trends are discussed in the results section. The paper concludes with a discussion of the
limitations of the study and areas for future research.
Science Philanthropy and Higher Education
Science philanthropy is an understudied field of philanthropy that is drawing scholarly attention
to how philanthropy supports and shapes the study and practice of science. Federal sponsorship is the
largest source of funding for academic R&D but has had cumulative funding declines and stagnation in
recent years (NSB, 2018). Murray (2013) provided the first empirical evaluation of the role of science
foundations being less interested in basic research and becoming more selective about the science they
choose to support.
Considering how governments and foundations are changing their funding strategies, individual
donors’, especially high-net-worth donors’, support of STEM warrants further investigation. Empirical
studies on this topic are few, and existing studies have not fully considered individual donors’
characteristics and contributions to science philanthropy. Investigations of high-net-worth donors’ support
of STEM are often focused on the medical sciences (Chervenak, McCullough, Fraley, & Golding, 2010;
Stewart, Wolfe, Flynn, Carrese, & Wright, 2011; Wheeler, Rum, & Wright, 2014).
The phenomenon of high-net-worth donors committing major gifts to science is evident in media
reports. For example, Facebook co-founders Dustin Moskovitz and Mark Zuckerberg committed billions
of dollars to high-risk basic and applied research through their own initiatives and foundations (Callaway,
2017). Additionally, the Science Philanthropy Alliance (SPA), created in 2012, has advised
high-net-worth donors and foundations on long-term philanthropic investments in basic research in response to
governmental cuts in R&D funding (SPA, 2019).
As members of the upper percentiles of wealth in society, high-net-worth donors have been
considered to practice “elite philanthropy” (Ostrower, 1995) and have sought to “shape” the causes they
support (Schervish, 2005). Examinations of wealthy donors’ giving patterns revealed giving trends
favoring the support of elite institutions, such as colleges and universities (Lincoln & Saxton, 2012;
Odendahl, 1990; Rosqueta, Noonan, Shark & Casey, 2011).
Alumni donors have remained a critical segment of potential donors to academic institutions
(Boverini, 2006). Roughly 26% of individual donors to higher education were alumni donors, and they
gave approximately $12.15 billion in 2018 (Council for Advancement and Support of Education, 2019).
The alumni of academic institutions have had varied experiences, and their level of satisfaction with their
alma maters influences their willingness to support these institutions (Clotfelter, 2003). In regard to major
non-alumni donors preferred to support academic programs. Yet, Leslie and Ramey (1988) found non-non-alumni
donors typically gave to support academic programs as well as programmatic excellence.
The gender of alumni donors is potentially a defining feature of higher education donors, but
research in this area has contradictory results. For example, in earlier works by Okunade (1996) and
Wunnava and Lauze (2001), male alumni were found to give more than female alums. More recent
evidence on the difference between male and female donors’ gifts to higher education shows no statistical
difference in giving with respect to gender (Lara & Johnson, 2014). Further research is needed to resolve
this discrepancy.
College attendance can serve as a gateway to career paths that provide income to support
philanthropic initiatives. The relationship between donors’ occupations and industry sectors has been
found to affect the likelihood of donating to academic institutions (Baade & Sundberg, 1996; Holmes,
2009; Monks, 2003; Olsen, Smith, & Wunnava, 1989). In general, individuals working as entrepreneurs
are found to have an interest in supporting topics that support their local communities, such as education
(Mickiewicz, Sauka, & Stephan, 2016; Peake, Harris, McDowell, & Davis, 2015; Shaw, Gordon, Harvey,
& Maclean, 2013).
The aforementioned studies broadly consider science philanthropy and higher education. To
explore the characteristics of major donors that practice science philanthropy regarding higher education,
I aim to answer the following research questions:
Research Question 1:
What are the differences between STEM and non-STEM major donors’ giving trends?
Research Question 2:
What are the key characteristics of high-net-worth donors who practice science philanthropy at
Data
To answer the research questions, I utilize a database of major gift announcements to higher
education from 1995 to 2017. I created this database primarily using the Chronicle of Higher Education
and the Chronicle of Philanthropy. The 1995 to 2004 data was hand coded because digital versions of
these Chronicles were not available at the time of data collection. Next, the collection of 2005 to 2017 gift
announcements, which were available online, was automated using web-scraping techniques in the
Python programming language. Automated data collection and data cleaning occurred from January to
December 2017. Data from the Million Dollar List, published by Indiana University’s Lilly Family
School of Philanthropy, was also scraped as an additional source of data and used to verify data from the
Chronicles.
The sample of major gifts for analysis consists of 6,815 gift announcements. Major gifts to higher
education exhibit cyclical fluctuations that follow national economic trends. Within this sample of major
gifts, a range of 200 to nearly 500 major gifts occur per year. Major gifts range from $1 million to $600
million. The average major gift is approximately $10 million. Gifts of $10 million or more increased in
the most recent decade, despite fluctuations in the number of major gifts.
The analysis includes major gifts to STEM and non-STEM. This analysis uses the National
Science Foundation’s (NSF) classification of STEM fields. Major gifts to STEM were assigned to the
following fields: health and medicine, engineering, life sciences, physical sciences, mathematics and
computer sciences, and interdisciplinary STEM (two or more fields of science). Gift categories for
non-STEM are based on academic classification categories set by the Voluntary Support of Education (VSE)
survey conducted by the Council for Advancement and Support of Education (CASE). Definitions for
gifts reported by the VSE include gifts for student aid, faculty aid, library aid, and athletics. The VSE uses
separate categories for gifts provided for unrestricted purposes, endowment, buildings and equipment, and
physical plant operations and maintenance; this study classifies such gifts in a catch-all “other” category
if the gift does not specify an academic discipline. The “mixed use” gift category does not include gifts to
and non-STEM gift designations (n=894) were excluded from the sample because these gift
announcements do not specify how the funding is divided between the STEM and non-STEM
discipline(s). This results in a set of 1,637 major gifts to STEM and 5,178 major gifts to non-STEM for
analysis.
There are 944 academic institutions represented in the database. To account for possible
differences between academic institutions, the U.S. Department of Education’s Integrated Postsecondary
Education Data System (IPEDS) was used to supplement the database with information about each
academic institution. Most institutions receiving major gifts are private institutions (65%). The salient
characteristics of the gift recipient institutions include public/private status, student enrollment, location
(urban/rural and region), and Carnegie classification.
In total, 6,039 unique donors supported the 944 institutions. The Standard Occupational
Classifications (SOC, 2010 version) and the North American Industry Classification System (NAICS,
2012 version) classifications were used to categorize donor occupations and assign industry sectors. A
limited set of extrinsic motivators (e.g., gender, married status, occupation, and industry sector) were
captured from gift announcements. If not specified, the variable coding was dichotomous (0,1). Gender
was determined by machine learning software for gendered names and was manually verified. The
web-scraping method used for the database cannot yet account for donor age and different types of unmarried
people, such as older widowed men. An individual’s wealth is not typically publicly available. Therefore,
in keeping with the labor economics and sociology literatures, occupation and industry serve as proxies
for wealth because these factors are related to an individual’s socioeconomic position (Easton-Brooks &
Davis, 2007; Galobardes, Shaw, Lawlor, Lynch, & Smith, 2006; King, 1974).
The dataset and interpretation of the results are limited to announced major gifts. Still, scholars
have analyzed major gift data despite such limitations. Taylor (2018) used quantitative content analysis to
understand gift announcement language based on data limited to 150 flagship universities. Osili,
several limitations that include the over and under reporting of major gifts. Additionally, Murray (2013)
broadly addressed private philanthropy to STEM at academic institutions using the NSF’s Science and
Engineering Statistics, VSE, and the Foundation Center data that only focused on the top 50 US
universities and colleges.
The database produced for this research is intended to help answer empirical questions with
greater granularity at the donor and institutional levels. The coded dataset is archived at the author’s
university. The appendix details efforts to validate the comprehensiveness of the data.
Methodology
The empirical analysis uses the sample of 6,815 major gifts from the database previously
discussed. The following linear regression model is estimated first:
Log(Majorgift)ijt= a + b1Donori + b2Collegejt + Timet +eijt (1)
Ordinary least squares (OLS) predicts the standard conditional mean relationships between
variables. The change in the major gift amount, Majorgiftijt, is predicted by a vector of donor
characteristics, Donori. Institutional characteristics, Collegejt, and time-fixed effects are included in the
analysis to control for variation in time from macroeconomic shocks.
The analysis is extended using the following quantile regression model (Koenker and Bassett,
1978):
Quantq(yit|xit)= x¢itbq (2)
In contrast to OLS, quantile regression can predict relationships throughout the distribution of the
outcome variable, including measures of central tendency. Specifically, Quantq(yit|xit) represents the qth
conditional quantile with respect to yit given xit. Quantile regression allows for an analysis of the
Intuitively, major gift amounts are different in scale and importance. Outliers are retained in the analysis,
as they are accounted for within specific quantiles.
Incorporating the sample in quantiles seeks to avoid bias due to truncation (Heckman, 1979), but
this study interprets results conservatively, given the data limitations previously discussed. The standard
errors of quantile regression coefficients are estimated by bootstrapping to reduce sensitivity to
heteroskedasticity (Rogers, 1993). In the next section, the results are considered in the order of the
specified research questions.
Results
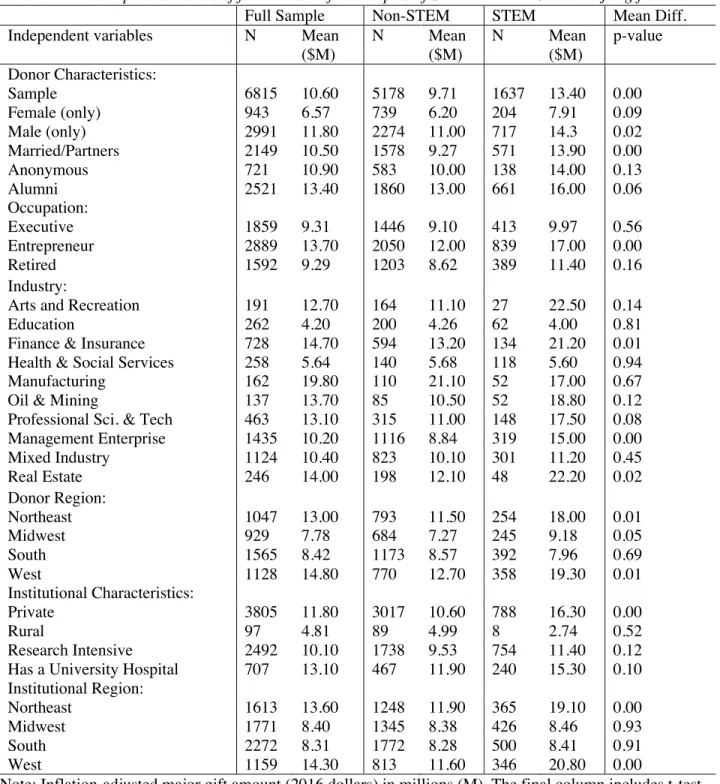
Table 2.1 provides summary statistics and t-test results of the mean differences in donor and
Note: Inflation-adjusted major gift amount (2016 dollars) in millions (M). The final column includes t-test for mean differences. Categories of donor and institutional characteristics are not mutually exclusive.
STEM and Non-STEM Donors’ Giving Trends
Table 2.1: Descriptive statistics of full and stratified samples of STEM and non-STEM major gifts. Full Sample Non-STEM STEM Mean Diff. Independent variables N Mean
($M)
N Mean ($M)
N Mean ($M)
p-value
Donor Characteristics:
Sample 6815 10.60 5178 9.71 1637 13.40 0.00 Female (only) 943 6.57 739 6.20 204 7.91 0.09 Male (only) 2991 11.80 2274 11.00 717 14.3 0.02 Married/Partners 2149 10.50 1578 9.27 571 13.90 0.00 Anonymous 721 10.90 583 10.00 138 14.00 0.13 Alumni 2521 13.40 1860 13.00 661 16.00 0.06 Occupation:
Executive 1859 9.31 1446 9.10 413 9.97 0.56 Entrepreneur 2889 13.70 2050 12.00 839 17.00 0.00 Retired 1592 9.29 1203 8.62 389 11.40 0.16 Industry:
Arts and Recreation 191 12.70 164 11.10 27 22.50 0.14 Education 262 4.20 200 4.26 62 4.00 0.81 Finance & Insurance 728 14.70 594 13.20 134 21.20 0.01 Health & Social Services 258 5.64 140 5.68 118 5.60 0.94 Manufacturing 162 19.80 110 21.10 52 17.00 0.67 Oil & Mining 137 13.70 85 10.50 52 18.80 0.12 Professional Sci. & Tech 463 13.10 315 11.00 148 17.50 0.08 Management Enterprise 1435 10.20 1116 8.84 319 15.00 0.00 Mixed Industry 1124 10.40 823 10.10 301 11.20 0.45 Real Estate 246 14.00 198 12.10 48 22.20 0.02 Donor Region:
Northeast 1047 13.00 793 11.50 254 18.00 0.01 Midwest 929 7.78 684 7.27 245 9.18 0.05 South 1565 8.42 1173 8.57 392 7.96 0.69 West 1128 14.80 770 12.70 358 19.30 0.01 Institutional Characteristics:
Private 3805 11.80 3017 10.60 788 16.30 0.00 Rural 97 4.81 89 4.99 8 2.74 0.52 Research Intensive 2492 10.10 1738 9.53 754 11.40 0.12 Has a University Hospital 707 13.10 467 11.90 240 15.30 0.10 Institutional Region:
The average major gift for STEM is approximately $13.4 million, as opposed to an average major
gift size of approximately $9.7 million to non-STEM. However, rural institutions receive smaller gifts for
STEM disciplines. The trend of larger major gifts to STEM is present throughout almost all subcategories
of major donors, with the exception of donors in the education, health and social services, and
manufacturing industries. Notably, 51% of entrepreneurs in the sample support STEM disciplines and
entrepreneurs give approximately $5 million more to STEM than non-STEM disciplines. Major donors
that identify as entrepreneurs or executives are most often in the finance, insurance, or the professional
services industries.
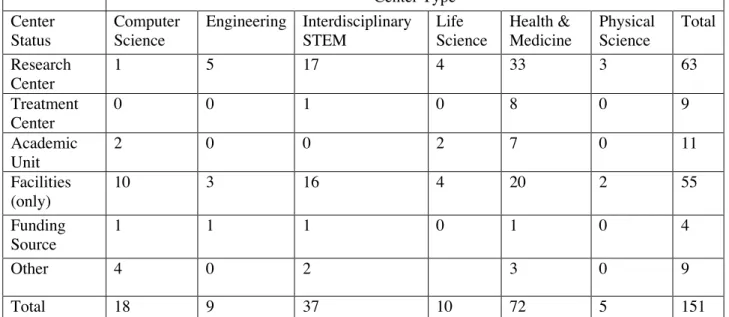
Major donors’ giving to STEM varies among STEM disciplines, as seen in Table 2.2 and Figure
2.1
Table 2.2: Counts of major gifts received by non-STEM and STEM academic disciplines.
Non-STEM N STEM N
Social Sciences 1409 Interdisciplinary STEM 640 Mixed Use 1303 Medical & Health 615 Arts & Humanities 733 Engineering 188
Other 846 Life Science 70
Student Aid 585 Math & Computer Science 73 Athletics 152 Physical Science 51 Library 77
Faculty Aid 73
Figure 2.1: Mean and median values for the sample of major gifts (n=6815) by academic disciplines, 1995–2017. The “Other” gift category includes gifts not specific to an academic discipline or activity, such as gifts for unspecified facilities and unrestricted gifts.
As indicated in Table 2.2, nearly a quarter (24%) of major gifts within the 14 major gift
designations are provided to STEM disciplines. Interdisciplinary STEM and the social sciences are most
often supported by major gifts within the STEM and non-STEM academic disciplines. However, as
demonstrated in Figure 2.1, interdisciplinary STEM is the highest funded field among the 14 major gift
Key Characteristics of STEM Donors
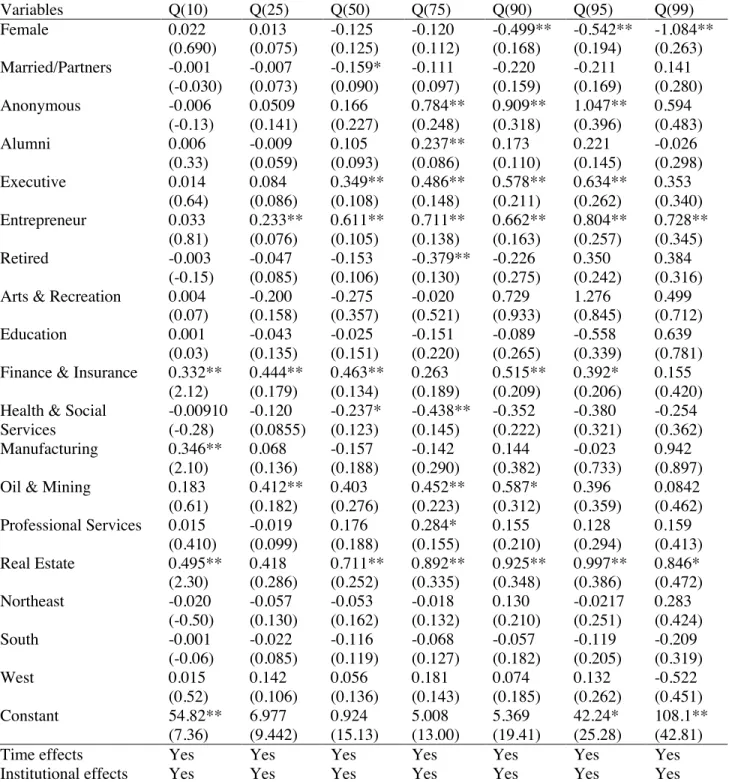
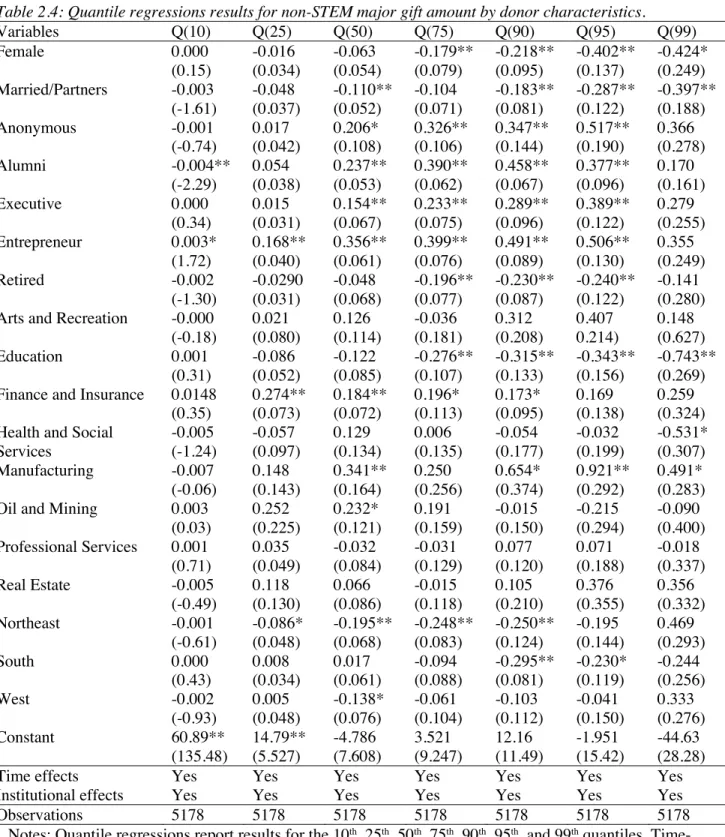
Tables 2.3 and 2.4 present quantile regression estimates of the relationships between major donor
characteristics and gift amounts across the distribution of major gifts to STEM and non-STEM,
respectively.
Table 2.3: Quantile regressions results for STEM major gift amount by donor characteristics.
Variables Q(10) Q(25) Q(50) Q(75) Q(90) Q(95) Q(99) Female 0.022 0.013 -0.125 -0.120 -0.499** -0.542** -1.084**
(0.690) (0.075) (0.125) (0.112) (0.168) (0.194) (0.263) Married/Partners -0.001 -0.007 -0.159* -0.111 -0.220 -0.211 0.141
(-0.030) (0.073) (0.090) (0.097) (0.159) (0.169) (0.280) Anonymous -0.006 0.0509 0.166 0.784** 0.909** 1.047** 0.594
(-0.13) (0.141) (0.227) (0.248) (0.318) (0.396) (0.483) Alumni 0.006 -0.009 0.105 0.237** 0.173 0.221 -0.026
(0.33) (0.059) (0.093) (0.086) (0.110) (0.145) (0.298) Executive 0.014 0.084 0.349** 0.486** 0.578** 0.634** 0.353
(0.64) (0.086) (0.108) (0.148) (0.211) (0.262) (0.340) Entrepreneur 0.033 0.233** 0.611** 0.711** 0.662** 0.804** 0.728**
(0.81) (0.076) (0.105) (0.138) (0.163) (0.257) (0.345) Retired -0.003 -0.047 -0.153 -0.379** -0.226 0.350 0.384
(-0.15) (0.085) (0.106) (0.130) (0.275) (0.242) (0.316) Arts & Recreation 0.004
(0.07) -0.200 (0.158) -0.275 (0.357) -0.020 (0.521) 0.729 (0.933) 1.276 (0.845) 0.499 (0.712) Education 0.001 -0.043 -0.025 -0.151 -0.089 -0.558 0.639
(0.03) (0.135) (0.151) (0.220) (0.265) (0.339) (0.781) Finance & Insurance 0.332** 0.444** 0.463** 0.263 0.515** 0.392* 0.155
(2.12) (0.179) (0.134) (0.189) (0.209) (0.206) (0.420) Health & Social
Services -0.00910 (-0.28) -0.120 (0.0855) -0.237* (0.123) -0.438** (0.145) -0.352 (0.222) -0.380 (0.321) -0.254 (0.362) Manufacturing 0.346** 0.068 -0.157 -0.142 0.144 -0.023 0.942
(2.10) (0.136) (0.188) (0.290) (0.382) (0.733) (0.897) Oil & Mining 0.183 0.412** 0.403 0.452** 0.587* 0.396 0.0842 (0.61) (0.182) (0.276) (0.223) (0.312) (0.359) (0.462) Professional Services 0.015 -0.019 0.176 0.284* 0.155 0.128 0.159
(0.410) (0.099) (0.188) (0.155) (0.210) (0.294) (0.413) Real Estate 0.495** 0.418 0.711** 0.892** 0.925** 0.997** 0.846* (2.30) (0.286) (0.252) (0.335) (0.348) (0.386) (0.472) Northeast -0.020 -0.057 -0.053 -0.018 0.130 -0.0217 0.283
(-0.50) (0.130) (0.162) (0.132) (0.210) (0.251) (0.424) South -0.001 -0.022 -0.116 -0.068 -0.057 -0.119 -0.209
(-0.06) (0.085) (0.119) (0.127) (0.182) (0.205) (0.319) West 0.015 0.142 0.056 0.181 0.074 0.132 -0.522
(0.52) (0.106) (0.136) (0.143) (0.185) (0.262) (0.451) Constant 54.82** 6.977 0.924 5.008 5.369 42.24* 108.1**
Observations 1637 1637 1637 1637 1637 1637 1637 Notes: Quantile regressions report results for the 10th, 25th, 50th, 75th, 90th, 95th, and 99th quantiles. Time- and institution-fixed effects included in regression specifications. p < 0.1*, p < 0.05** and p<0.01***
Table 2.4: Quantile regressions results for non-STEM major gift amount by donor characteristics.
Variables Q(10) Q(25) Q(50) Q(75) Q(90) Q(95) Q(99) Female 0.000 -0.016 -0.063 -0.179** -0.218** -0.402** -0.424*
(0.15) (0.034) (0.054) (0.079) (0.095) (0.137) (0.249) Married/Partners -0.003 -0.048 -0.110** -0.104 -0.183** -0.287** -0.397**
(-1.61) (0.037) (0.052) (0.071) (0.081) (0.122) (0.188) Anonymous -0.001 0.017 0.206* 0.326** 0.347** 0.517** 0.366
(-0.74) (0.042) (0.108) (0.106) (0.144) (0.190) (0.278) Alumni -0.004** 0.054 0.237** 0.390** 0.458** 0.377** 0.170
(-2.29) (0.038) (0.053) (0.062) (0.067) (0.096) (0.161) Executive 0.000 0.015 0.154** 0.233** 0.289** 0.389** 0.279
(0.34) (0.031) (0.067) (0.075) (0.096) (0.122) (0.255) Entrepreneur 0.003* 0.168** 0.356** 0.399** 0.491** 0.506** 0.355
(1.72) (0.040) (0.061) (0.076) (0.089) (0.130) (0.249) Retired -0.002 -0.0290 -0.048 -0.196** -0.230** -0.240** -0.141
(-1.30) (0.031) (0.068) (0.077) (0.087) (0.122) (0.280) Arts and Recreation -0.000
(-0.18) 0.021 (0.080) 0.126 (0.114) -0.036 (0.181) 0.312 (0.208) 0.407 0.214) 0.148 (0.627) Education 0.001 -0.086 -0.122 -0.276** -0.315** -0.343** -0.743**
(0.31) (0.052) (0.085) (0.107) (0.133) (0.156) (0.269) Finance and Insurance 0.0148
(0.35) 0.274** (0.073) 0.184** (0.072) 0.196* (0.113) 0.173* (0.095) 0.169 (0.138) 0.259 (0.324) Health and Social
Services -0.005 (-1.24) -0.057 (0.097) 0.129 (0.134) 0.006 (0.135) -0.054 (0.177) -0.032 (0.199) -0.531* (0.307) Manufacturing -0.007 0.148 0.341** 0.250 0.654* 0.921** 0.491* (-0.06) (0.143) (0.164) (0.256) (0.374) (0.292) (0.283) Oil and Mining 0.003 0.252 0.232* 0.191 -0.015 -0.215 -0.090
(0.03) (0.225) (0.121) (0.159) (0.150) (0.294) (0.400) Professional Services 0.001 0.035 -0.032 -0.031 0.077 0.071 -0.018
(0.71) (0.049) (0.084) (0.129) (0.120) (0.188) (0.337) Real Estate -0.005 0.118 0.066 -0.015 0.105 0.376 0.356
(-0.49) (0.130) (0.086) (0.118) (0.210) (0.355) (0.332) Northeast -0.001 -0.086* -0.195** -0.248** -0.250** -0.195 0.469
(-0.61) (0.048) (0.068) (0.083) (0.124) (0.144) (0.293) South 0.000 0.008 0.017 -0.094 -0.295** -0.230* -0.244
(0.43) (0.034) (0.061) (0.088) (0.081) (0.119) (0.256) West -0.002 0.005 -0.138* -0.061 -0.103 -0.041 0.333
(-0.93) (0.048) (0.076) (0.104) (0.112) (0.150) (0.276) Constant 60.89** 14.79** -4.786 3.521 12.16 -1.951 -44.63
(135.48) (5.527) (7.608) (9.247) (11.49) (15.42) (28.28) Time effects Yes Yes Yes Yes Yes Yes Yes Institutional effects Yes Yes Yes Yes Yes Yes Yes Observations 5178 5178 5178 5178 5178 5178 5178
Gender and married status. The results in both Tables 2.3 and 2.4 show female and married
major donors have negative associations with major gift amount. The negative relationships for both
variables become stronger at higher quantiles for STEM and non-STEM major gifts, especially for female
donors. Additional wealth and income data for all donors is needed to fully explain such propensities for
giving smaller major gifts.
Anonymous giving. A positive relationship between anonymous donors and gift amount is
observed for gifts to STEM and non-STEM disciplines at the highest quantiles, except for the 99%
quantile. Again, coefficients at the highest quantiles are twice as large for gifts to STEM. This suggests
anonymous donors have the capacity to give large gifts and, although the donors are anonymous, have
some preference for giving their largest gifts to STEM.
Alumni status. The relationship between alumni status and major gift amount for STEM major
gifts contrasts that of non-STEM major gifts. In the case of non-STEM, a positive and significant
relationship is observed for alumni status at nearly all quantiles. In contrast, the relationship between
alumni status and major gift amount to STEM is typically smaller in magnitude and not significant. This
result suggests alumni donors may prefer to support non-STEM disciplines at their alma maters.
Non-alumni may be more inclined to support STEM.
Occupation and retirement status. Both executive and entrepreneur occupation statuses have
positive associations with gift amount for STEM and non-STEM in the selected quantiles, which suggests
these donors have a capacity and willingness to give across the distribution of major gifts. Notably, the
relationship between being an entrepreneur and gift amount is positive and statistically significant for the
99th quantile of STEM major gifts only. This finding corresponds with the descriptive finding that
entrepreneurs in the sample of major gift givers provide 61% of mega gifts ($50 million or more).
However, in contrast to working major donors, retired donors are consistently associated with negative
giving trends for STEM and non-STEM major gifts throughout the selected quantiles.
finance and insurance industry sector and gift amount that is consistent and statistically significant for
STEM and non-STEM major gifts. On the other hand, this trend for the health and social services sector
shows a consistently negative relationship with gift amount.
The association between working in the real estate sector and gift amount for non-STEM major
gifts has inconsistent coefficient signs but is not significant at any quantile. In contrast, this relationship is
positive and significant at all the specified quantiles of STEM major gifts, except for the 25th quantile. It
is unclear why the real estate sector has such a contrary trend in the donor groups. Future research might
include deeper investigations of these industry differences.
Donor region. The Midwest was the reference group for donors’ regional locations in the quantile
regressions. In regard to STEM and non-STEM major gifts, negative relationships are observed for the
northeastern, western, and southern regional locations of donors for all the selected quantiles. However,
these relationships are consistently not significant for STEM major gifts.
Additional Specifications
Table 2.5 presents an additional robustness check of the quantile regression models. The first
column of Table 2.5 provides the full-sample OLS regression. The last column of Table 1.5 provides OLS
results for the stratified samples of major gifts for STEM and non-STEM. The differences in the two
Table 2.5: OLS regressions of the full and stratified STEM and non-STEM samples of
major gifts. Industry-, regional-, institutional-, and time-fixed effects included.
Variables Full Sample non-STEM STEM Difference Female -0.140** -0.144** -0.148 -0.015
(-3.35) (0.046) (0.090) (-0.15) Married/Partners -0.104** -0.114** -0.110 0.000
(-3.20) (0.037) (0.067) (0.01) Anonymous 0.201** 0.166** 0.287** 0.130
(3.55) (0.062) (0.135) (0.95) Alumni 0.205** 0.249** 0.123** -0.123*
(6.86) (0.034) (0.060) (-1.86) Executive 0.162** 0.140** 0.265** 0.114
(4.00) (0.044) (0.094) (1.14) Entrepreneur 0.370** 0.321** 0.469** 0.157*
(9.67) (0.042) (0.085) (1.72) Retired -0.101** -0.086* -0.171* -0.086
(-2.39) (0.047) (0.094) (-0.85) Constant 4221.9** 6949.9** -1353.2 4746.9**
(2.86) (1673.4) (3141.8) (3.21)
Time effects Yes Yes Yes Yes
The findings of the quantile regressions for STEM major gifts hold, with the exception of the
regressions for the medical and social sciences. Quantile regression findings also hold when the model is
limited to include fewer industry categories. Additionally, interquantile regressions were conducted to
understand the differences in quantiles specific to donors’ characteristics for STEM and non-STEM
donors. Significant differences in the specified quantiles were observed across the characteristics of
donors. Lastly, the results of the ordered logistic regression, using the number of gifts as the dependent
variable, are also robust.
Limitations
It is not possible to know the specific causal role of the predictor variables considered. Given the
nature of the data, some donor groups may be lost within other donor groups. For example, the giving
participation of some single women in this sample of major donors may be hidden within the anonymous
donor category, as single women have a higher likelihood of giving anonymously (Kamas, Preston, &
Baum, 2008). Additionally, married/partnered major donors represent only 32% of donors in the sample
of major gifts used for this analysis. This proportion of married/partnered donors who give to charity is
lower than reported figures from prior studies (Holmes, 2009; Monks, 2003; Okunade & Berl, 1997; U.S.
Trust & IUPUI, 2016). This is an indication that information on donors’ married/partnered status may not
be consistently announced. Efforts were made to reconfirm donor information using the aforementioned
sources and systematic online searches for additional donor information.
Discussion and Conclusions
Scholars of philanthropy have taken a closer look at the specific areas that individual donors, in
general, choose to support, such as giving to women’s and girls’ issues (Dale, Ackerman, Mesch, Osili, &
Garcia, 2018) and international causes (Casale & Baumann, 2015). However, the findings of this study
are unique to high-net-worth donors, specifically their support of academic STEM fields. This study has
First, this work highlights the rarity of major gifts to fund academic STEM but finds that, on
average, major gifts to STEM are larger than major gifts to non-STEM academic disciplines. This trend
may signal larger gifts being given to support transformational philanthropy (Osili & Ackerman, 2013;
Strickland, 2007). For example, the sample of major gifts is inclusive of gifts to establish scientific
research centers and institutes that have grand missions, such as Dana and David Dornsife’s $8 million
gift in 2003 to create a Cognitive Neuroscience Imaging Center at the University of Southern California.
As depicted in Figure 2.1, the top three disciplines receiving the most philanthropic dollars are all
STEM disciplines. Interdisciplinary science received the most and the largest major gifts. This is an
important finding, as interdisciplinary science may help to propel innovation to address complex
problems (Lyall, Bruce, Marsden, & Meagher, 2013; Rhoten & Parker, 2004). Murray (2013) found that
interdisciplinary science is a highly funded STEM discipline, but philanthropic funders’ preference for
applied medical research yielded more than 57% of gifts to STEM. Additionally, Murray found that the
life sciences are one of the least supported fields of STEM, while this study finds the life sciences to be a
top-funded academic discipline. This contrast may be due to this study broadly considering donor support
of STEM disciplines and not just STEM research.
An analysis of industry and occupational trends between STEM and non-STEM donors led to the
third major finding, which is that there exists a higher prevalence of entrepreneurs among STEM donors
than among non-STEM donors. This trend is important, as it corresponds with entrepreneurs’
philanthropic activities and objectives becoming more relevant to philanthropy (Shaw et al., 2013). The
“new donor” is thought to be inclusive of donors with an entrepreneurial mindset toward philanthropy,
such as high-tech entrepreneurs, social entrepreneurs, and engaged grant makers or investors (Wagner,
2002). Psychosocial motives may drive wealthy entrepreneurs to be philanthropic toward education
(Coombs, Shipp, & Christensen, 2008). Additionally, the philanthropic activities of self-made
entrepreneurs (Shaw et al., 2013; Schervish, O’Herlihy, & Havens, 2001) and individuals who inherited
is needed to understand how entrepreneurs’ distinctions in wealth affect giving, especially as findings
suggest entrepreneurial status matters at the highest quantiles of STEM major gifts.
Fourth, approximately 40% of STEM donors in this study are alumni of the recipient institution.
This proportion is higher than the proportion of alumni giving to higher education (20% or more
depending on the institutional comparison group) reported by the VSE survey (CASE, 2018). In contrast,
Taylor (2018) reviewed gift announcements to public flagship universities and found that 55% of major
gift donors are alumni and most often support student scholarships. In the case of STEM, a fundraiser
might regard 40% of STEM donors being alumni as a signal that alumni donors are a narrower pool of
potential STEM donors. In contrast, the positive and consistent relationship between alumni status and
major gift amount for non-STEM gifts may signal a broader alumni donor pool for such academic
disciplines.
Lastly, the findings demonstrate STEM donors are less likely to be alumni of the institutions they
support and more likely to be entrepreneurs. This characterization presents an opportunity for university
fundraisers to further study this donor group, especially as this donor group offers preferential support of
STEM disciplines, which may pose a challenge for spreading the wealth among the STEM fields.
Irrespective of a donor’s gift preference, the majority of STEM and non-STEM donors, 82% and 84%,
respectively, gave only one announced major gift between 1995 and 2017, meaning major donors to
academic STEM are unlikely to surpass the federal government as the dominant funding source for
academic science.
Individual donors have the potential to help fill science funding gaps, especially for riskier
science, that industry and government are unlikely to fill (Murray, 2013). The process of attracting major
donors to support academic STEM may be better understood when the characteristics of these donors are
critically analyzed. How academic institutions leverage major donors as an alternative source of funding
for STEM disciplines is likely to be institution-specific, but the uncovered distinctions between STEM
REFERENCES
Andreoni, J., & Petrie, R. (2004). Public goods experiments without confidentiality: A glimpse into fund-raising. Journal of Public Economics, 88(7), 1605-1623. doi:10.1016/S0047-2727(03)00040-9
Baade, R. A., & Sundberg, J. O. (1996). What determines alumni generosity?. Economics of Education Review, 15(1), 75-81. doi:10.1016/0272-7757(95)00026-7
Boverini, L. (2006). When venture philanthropy rocks the ivory tower. International Journal of Educational Advancement, 6(2), 84-106. doi:10.1057/palgrave.ijea.2150011
Burnett, K. (2002). Relationship fundraising: A donor-based approach to the business of raising money. San Francisco, CA: John Wiley & Sons.
Callaway, E. (2017, December 20). Facebook billionaire pours funds into high-risk research. Nature. Retrieved from https://www.nature.com/articles/d41586-017-08795-0.
Casale, D., & Baumann, A. (2015). Who gives to international causes? A sociodemographic analysis of US donors. Nonprofit and Voluntary Sector Quarterly, 44(1), 98-122.
doi:10.1177/0899764013507141
Chervenak, F. A., McCullough, L. B., Fraley, M., & Golding, J. (2010). Ethics: An essential
dimension of soliciting philanthropic gifts from donors. American Journal of Obstetrics and Gynecology, 203(6), 540-e1. doi:10.1016/j.ajog.2010.04.032
Clotfelter, C. T. (2003). Alumni giving to elite private colleges and universities. Economics of Education Review, 22(2), 109-120. doi:10.1016/S0272-7757(02)00028-6
Coombs, J. E., Shipp, A. J., & Christensen, L. J. (2008). Entrepreneurs as change agent: Antecedents and moderators of individual-level philanthropic behavior. Frontiers of Entrepreneurship, 28(21), 1-13. Retrieved from https://ssrn.com/abstract=1348127.
Council for Advancement and Support of Education. (2018). Voluntary support of education survey. CASE. Retrieved from https://www.case.org/resources/vse-data-miner.
Council for Advancement and Support of Education. (2019). Voluntary support of education: Trends in alumni giving. CASE. Retrieved from https://www.case.org/resources/voluntary-support-education-trends-alumni-giving.
Dale, E. J., Ackerman, J., Mesch, D. J., Osili, U. O., & Garcia, S. (2018). Giving to women and girls: An emerging area of philanthropy. Nonprofit and Voluntary Sector Quarterly, 47(2), 241-261. doi:10.1177/0899764017744674
Drezner, N. D., & Garvey, J. C. (2016). LGBTQ alumni philanthropy: Exploring (un)conscious motivations for giving related to identity and experiences. Nonprofit and Voluntary Sector Quarterly, 45(1), 52-71. doi:10.1177/0899764015597780
Eckel, C. C., & Grossman, P. J. (2004). Giving to secular causes by the religious and nonreligious: An experimental test of the responsiveness of giving to subsidies. Nonprofit and Voluntary Sector Quarterly, 33(2), 271-289. doi:10.1177/0899764004263423
Feldman, M. P., & Graddy-Reed, A. (2014). Accelerating commercialization: A new model of strategic foundation funding. The Journal of Technology Transfer, 39(4), 503-523. doi:10.1007/s10961-013-9311-1
Galobardes, B., Shaw, M., Lawlor, D. A., Lynch, J. W., & Smith, G. D. (2006). Indicators of
socioeconomic position (part 1). Journal of Epidemiology & Community Health, 60(1), 7- 12. doi:10.1136/jech.2004.023531
Giving USA Foundation. (2019). Giving USA 2019: The annual report on philanthropy for the year 2018. Giving USA Foundation. Retrieved from https://givingusa.org/tag/giving-usa-2019/.
Heckman, J. (1979). Sample selection bias a s a specification error. Econometrica, 47, 153-161. doi:10.2307/1912352
Herzog, P. S., & Yang, S. (2018). Social networks and charitable giving: Trusting, doing, asking, and alter primacy. Nonprofit and Voluntary Sector Quarterly, 47(2), 376-394.
doi:10.1177/0899764017746021
Holmes, J. (2009). Prestige, charitable deductions and other determinants of alumni giving: Evidence from a highly selective liberal arts college. Economics of Education Review, 28(1), 18-28. doi:10.1016/j.econedurev.2007.10.008
Kamas, L., Preston, A., & Baum, S. (2008). Altruism in individual and joint-giving decisions: What’s gender got to do with it? Feminist Economics, 14(3), 23-50. doi:10.1080/13545700801986571
Katz, S. N. (2005). What does it mean to say that philanthropy is "effective"? The philanthropists' new clothes. Proceedings of the American Philosophical Society, 149(2), 123-131. Retrieved from https://www.jstor.org/stable/4598921.
King, A. G. (1974). Occupational choice, risk aversion, and wealth. ILR Review, 27(4), 586-596. doi:10.1177/001979397402700407
Koenker, R. & Bassett, G. (1978). Regression quantiles. Econometrica, 46, 33-50. doi:10.2307/1913643
Kohler, R. (1985). Philanthropy and science. American Philosophical Society, 129(1), 9-13. Retrieved from http://www.jstor.org/stable/986975.
Lara, C., & Johnson, D. (2014). The anatomy of a likely donor: Econometric evidence on philanthropy to higher education. Education Economics, 22(3), 293-304.
doi:10.1080/09645292.2013.766672
Leslie, L. L., & Ramey, G. (1988). Donor behavior and voluntary support for higher education institutions. The Journal of Higher Education, 59(2), 115-132.
Lincoln, S., & Saxton, J. (2012). Major donor giving research report. Institute of Fundraising. Retrieved from https://nfpsynergy.net/major-donor-giving-research-report.
List, J. A. (2011). The market for charitable giving. Journal of Economic Perspectives, 25(2), 157-80. doi:10.1257/jep.25.2.157
Lyall, C., Bruce, A., Marsden, W., & Meagher, L. (2013). The role of funding agencies in creating interdisciplinary knowledge. Science and Public Policy, 40(1), 62-71.
doi:10.1093/scipol/scs121
Lye, C., Newfield, C., & Vernon, J. (2011). Humanists and the public university. Representations, 116(1), 1-18. doi:10.1525/rep.2011.116.1.1
Mansfield, E., & Lee, J. Y. (1996). The modern university: Contributor to industrial innovation and recipient of industrial R&D support. Research Policy, 25(7), 1047-1058. doi:10.1016/S0048-7333(96)00893-1
Mickiewicz, T., Sauka, A., & Stephan, U. (2016). On the compatibility of benevolence and self-interest: Philanthropy and entrepreneurial orientation. International Small Business Journal, 34(3), 303-328. doi:10.1177/0266242614555245
Monks, J. (2003). Patterns of giving to one’s alma mater among young graduates from selective institutions. Economics of Education Review, 22(2), 121-130. doi:10.1016/S0272-7757(02)00036-5
Murray, F. E. (2013). Evaluating the role of science philanthropy in American research universities. Innovation Policy and the Economy, 13(1), 23-60. doi:10.1086/668238
National Science Board. (2018). Science and engineering indicators 2018 (NSB-2018-1). National Science Foundation. Retrieved from https://www.nsf.gov/statistics/indicators/.
Newfield, C. (2009). Ending the budget wars: Funding the humanities during a crisis in higher education. Profession, 2009(1), 270-284. doi:10.1632/prof.2009.2009.1.270
Odendahl, T. (1990). Charity begins at home: Generosity and self-interest among the philanthropic elite. New York, NY: Basic Books.
Okunade, A. A., (1996). Graduate school alumni donations to academic funds: Micro-data
evidence. American Journal of Economics and Sociology, 55(2), 213-29. doi:10.1111/j.1536-7150.1996.tb03201.x
Okunade, A. A., & Berl, R. L. (1997). Determinants of charitable giving of business school alumni. Research in Higher Education, 38(2), 201-14. doi:10.1023/A:1024933720131
Olsen, K., Smith, A. L., & Wunnava, P. V. (1989). An empirical study of the life-cycle hypothesis with respect to alumni donations. The American Economist, 33(2), 60-63.
doi:10.1177/056943458903300207
Osili, U. O., Ackerman, J., Kong, C. H., Light, R. P., & Börner, K. (2017). Philanthro-metrics: Mining multi-million-dollar gifts. PLOS One, 12(5). doi:10.1371/journal.pone.0176738
Osili, U. O., Ackerman, J., & Li, Y. (2019). Economic effects on million dollar giving. Nonprofit and Voluntary Sector Quarterly, 48(2), 417-439. doi:10.1177/0899764018800791
Ostrower, F. (1995). Why the wealthy give: The culture of elite philanthropy. Princeton, New Jersey: Princeton University Press.
Peake, W. O., Harris, M. L., McDowell, W. C., & Davis, P. E. (2015). Get what you give? An
examination of enlightened self-interest, philanthropic intent, and engagement in philanthropy for small firm owners. Journal of Small Business Strategy, 25(2), 77. Retrieved from
https://libjournals.mtsu.edu/index.php/jsbs/article/view/562.
Rhoten, D., & Parker, A. (2004). Risks and rewards of an interdisciplinary research path. Science, 306(5704), 2046-2046. doi:10.1126/science.1103628
Rogers, W. H. (1993). Calculation of quantile regression standard errors. Stata Technical Bulletin, 13, 18-19. Retrieved from
https://www.researchgate.net/publication/24137015_Quantile_Regression_Standard_Errors.
Rosqueta, K. M., Noonan, K., Shark, M., & Casey, A. E. (2011). I’m not Rockefeller: Implications for major foundations seeking to engage ultra-high-net-worth donors. The Foundation Review, 3(4), 96-109. doi:10.4087/FOUNDATIONREVIEW-D-10-00020
Sargeant, A., Eisenstein, A., & Kottasz, R. (2015). Major gift fundraising: Unlocking the potential for your nonprofit. Sustainable Philanthropy with Plymouth University. Retrieved from
http://eprints.kingston.ac.uk/id/eprint/35007.
Schervish, P. G. (2000). The modern Medici: Patterns, motivations and giving strategies of the wealthy. Retrieved from
https://www.bc.edu/research/cwp/publications/by-topic/wealthphil.html.
Schervish, P. G. (2005). Major donors, major motives: The people and purposes behind major gifts. New Directions for Philanthropic Fundraising, 2005(47), 59-87. https://doi.org/10.1002/pf.95
Schervish, P. G., O’Herlihy, M. A., & Havens, J. J. (2001). Agent-animated wealth and philanthropy: The dynamics of accumulation and allocation among high-tech donors (Final report of the 2001 high-tech donors study). Boston College Social Welfare Research Institute.
Science Philanthropy Alliance. (2019). Our mission. Retrieved from https://www.sciencephilanthropyalliance.org.
Shaw, E., Gordon, J., Harvey, C., & Maclean, M. (2013). Exploring contemporary entrepreneurial philanthropy. International Small Business Journal, 31(5), 580-599.
doi:10.1177/0266242611429164
Stewart, R., Wolfe, L., Flynn, J., Carrese, J., & Wright, S. M. (2011). Success in grateful patient philanthropy: Insights from experienced physicians. The American Journal of
Strickland, S. (2007). Partners in writing and rewriting history: Philanthropy and higher education. International Journal of Educational Advancement, 7(2), 104-116.
doi:10.1057/palgrave.ijea.2150051
Taylor, Z. W. (2018). Go big and go home: Major gifts, public flagships, and the parlance of prestige. Philanthropy & Education, 1(2), 54-81. doi:10.2979/phileduc.1.2.03
U.S. Trust, & IUPUI. (2016). The 2016 U.S. Trust study of high-net-worth philanthropy: Charitable practices and preferences of wealthy households. Retrieved from
https://scholarworks.iupui.edu/handle/1805/11234.
Vesterlund, L. (2003). The informational value of sequential fundraising. Journal of Public Economics, 87(3), 627-657. doi:10.1016/S0047-2727(01)00187-6
Wagner, L. (2002). The “new” donor: Creation or evolution?. International Journal of Nonprofit and Voluntary Sector Marketing, 7(4), 343-352. doi:10.1002/nvsm.191
Wheeler, J. L., Rum, S. A., & Wright, S. M. (2014). Philanthropy, medical research, and the role of development. The American Journal of Medicine, 127(10), 903-904.
doi:10.1016/j.amjmed.2014.05.025
Wunnava, P. V., & Lauze, M. A. (2001). Alumni giving at a small liberal arts college: Evidence from consistent and occasional donors. Economics of Education Review, 20(6), 533-543.
doi:10.1177/056943458903300207