EVALUATING THE DIFFERENTIAL ITEM FUNCTIONING OF THE BEHAVIORAL ACTIVATION FOR DEPRESSION SCALE CHINESE VERSION (C-BADS) WITH
FACTORIAL INVARIANCE PROCEDURES
Yun Chen
A thesis submitted to the faculty at the University of North Carolina at Chapel Hill in partial fulfillment of the requirements for the degree of Master of Art in the Department of Psychology
and Neuroscience (Clinical Psychology) in the UNC College of Arts & Sciences.
Chapel Hill 2016
Approved by:
© 2016 Yun Chen
ABSTRACT
Yun Chen: Evaluating the Differential Item Functioning of the Behavioral Activation for Depression Scale Chinese Version (C-BADS) with Factorial Invariance Procedures
(Under the direction of Stacey B. Daughters)
The current study aims to exam the psychometric property of the Chinese Behavioral Activation for Depression Scale (C-BADS) in order to correctly assess behavioral activation related construct in China and Taiwan. A total of 752 college students were recruited from China, Taiwan, and the United States. Factorial invariance based differential item functioning (DIF) testing and confirmatory factor analysis (CFA) were used to study the psychometric property of C-BADS. Results show that the majority of BADS items show differences in
TABLE OF CONTENTS
LIST OF TABLES………...……vi
LIST OF FIGURES………vii
INTRODUCTION………1
Depression in China and Taiwan, and the Needs for Evidence-based Treatments……...1
Behavioral Activation (BA) Treatment for Depression………...2
Challenges Facing the Introduction of Behavioral Activation into China and Taiwan……3
Shooting Two Birds with One Stone: Study Difference in Item Functioning for BADS…6 Subgroup Difference between China and Taiwan………7
The Current Study………7
METHODS………...9
Participants………...9
Procedure……….9
Measures………10
Data Analytic Plan………...………..11
RESULTS………..17
Sample Characteristics………...17
Classical Test Theory……….18
Subscale Unidimensionality………..19
Testing the Overall Model Fit………27
Convergent Validity………...29
DISCUSSION………30
Differential Item Functioning………...……..30
Factor Analysis………..31
Theoretical Explanations for the Factorial and Item Differences Across Culture……….32
Is It Culture Value, Translation, or Response Style?...36
Recommendations and Future Directions………..37
Limitations……….39
Conclusion……….39
LIST OF TABLES
TABLE 1 - Sample Demographic Information ………50
TABLE 2 - Internal consistency across population and existing literature ………..51
TABLE 3 - Corrected Item-Total Correlation………..52
TABLE 4 - Inter item correlations for avoidance item 9, 10, and 13 with all items in the activation and avoidance subscales………...53
TABLE 5 - Model fit for 4 BADS subscales……….54
TABLE 6 - Linear CFA DIF detection results for Activation factor……….55
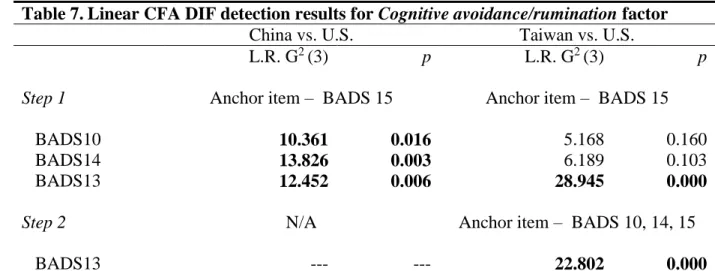
TABLE 7 - Linear CFA DIF detection results for Cognitive avoidance/rumination factor……..55
TABLE 8 - Linear CFA DIF detection results for Behavioral avoidance factor………..56
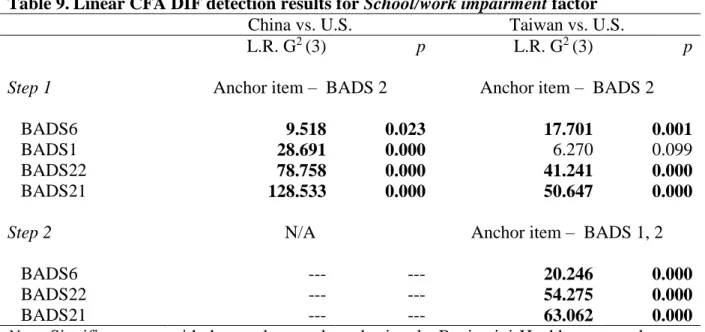
TABLE 9 - Linear CFA DIF detection results for School/work impairment factor……….56
TABLE 10 - Linear CFA DIF detection results for Social impairment factor………..56
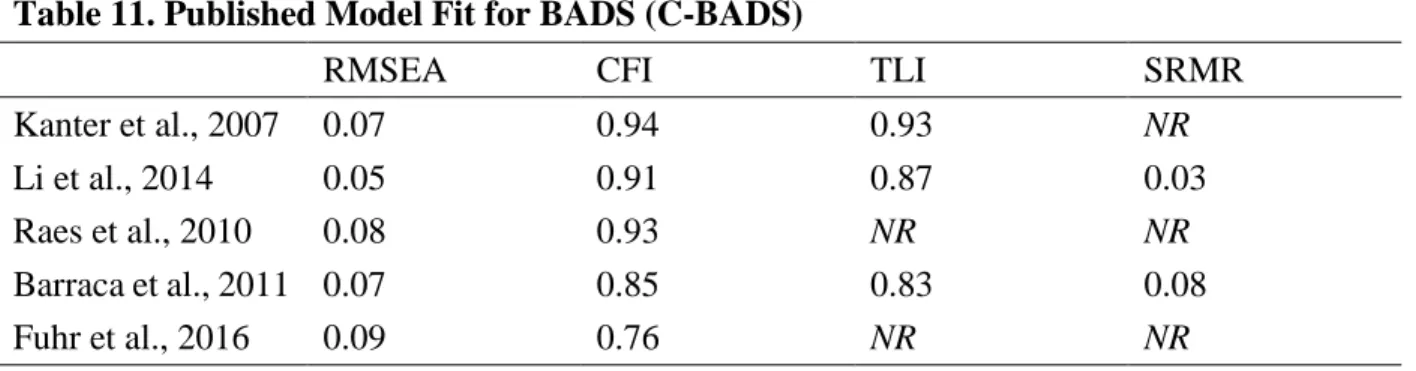
TABLE 11 - Published Model Fit for BADS (C-BADS)………..57
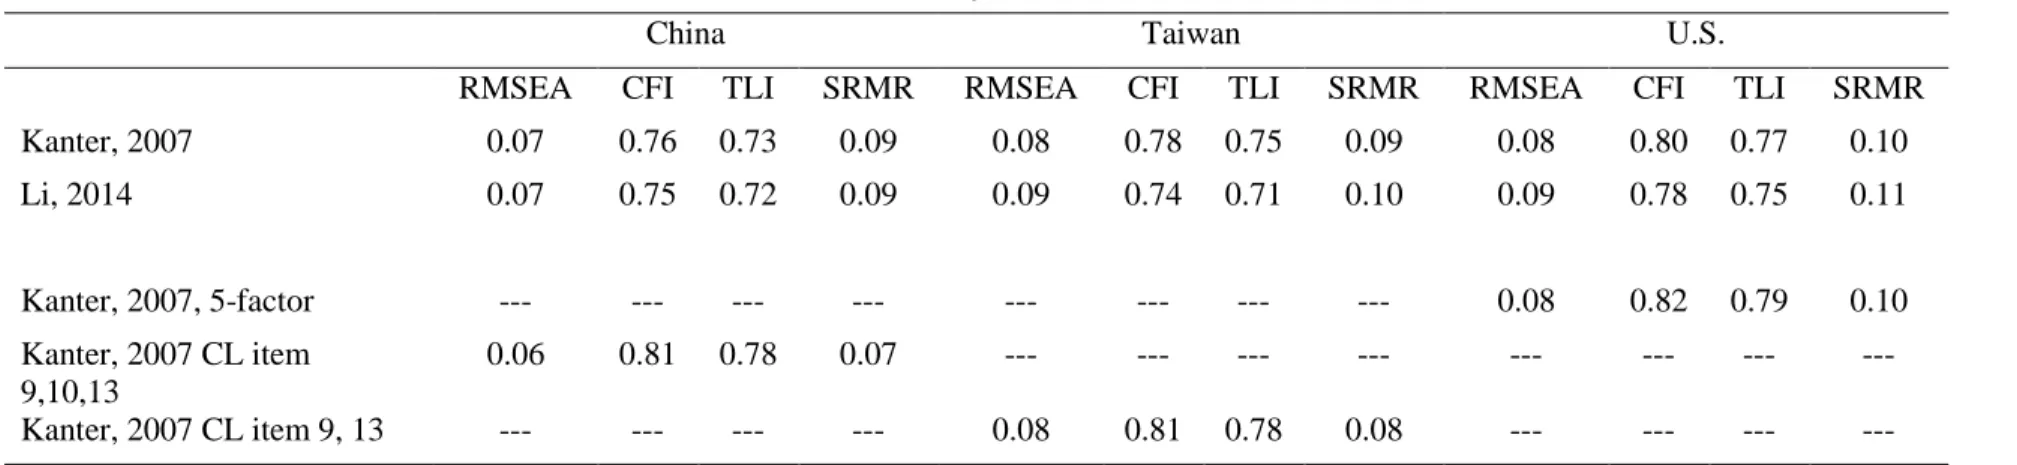
TABLE 12 - Overall model fit for BADS (C-BADS) in the current study………..58
TABLE 13 - Factor Structure for C-BADS in China………59
TABLE 14 - Factor Structure for C-BADS in Taiwan……….60
LIST OF FIGURES
FIGURE 1 - Data screening summary………63 FIGURE 2 - CFA models for Activation items with BADS 3, 5, 11, and 12
as anchor. ………...64 FIGURE 3 - CFA models for Activation items with BADS 3, 4, 7, 11, and 12
as anchor………..………..65 FIGURE 4 - CFA models for Cognitive avoidance/rumination items with BADS 15 (China)
or BADS 10, 14, and 15 (Taiwan) as anchor ………….………...66 FIGURE 5 - CFA models for Behavioral avoidance items with BADS 8 as anchor……….67 FIGURE 6 - CFA models for S/W impairment items with BADS 2 (China)
INTRODUCTION
Using the Confirmatory Factor Analyses (CFA) based differential item functioning (DIF) testing (Thissen, 2016), the current study investigated the item level difference in functioning between the English and Chinese versions of Behavioral Activation Depression Scale (BADS; Kanter et al., 2007; Li et al., 2014) for participants from China, Taiwan, and the United States. The aims for the current study are (1) examine item level difference in functioning between BADS and C-BADS using DIF analysis; (2) replicate factor structure of BADS and C-BADS based on previous literature; (3) study the convergent validity of BADS (C-BADS) in corresponding regions.
Depression in China and Taiwan, and the Needs for Evidence-based Treatments
Depression is highly prevalent in both China and Taiwan (Gu et al., 2013). In both regions, depression is associated with elevated levels of suicide risks (Tang et al., 2009; Wang, Chan, & Yip, 2014; Weng, Chang, Yeh, Wang, & Chen, 2016; Widhowati & Liou, 2013), increased physical & cognitive impairments (Chen et al., 2007; Chen et al., 2015; Lam & Lauder, 2000; Yen et al., 2010), as well as significant economic burden on the national health systems (Chan, Yang, Chen, Yu, & Leung, 2006; Hu, He, Zhang, & Chen, 2007).
Regardless of the significant mental health needs, both regions only have access to a limited number of evidence-based treatment (EBT) for depression. In both China and Taiwan, antidepressant (primarily SSRI) is the most researched EBT for depression, which is used as the first-line treatment for depression (Treuer et al., 2013). Despite the thriving of
(Han & Zhang, 2007). Another study surveyed 258 counselors from a variety of clinical settings in China, and find most of them are individuals with college-level training in psychology or education (Shi, Sang, Li, Zhou, & Wang, 2005). Similar to China, even CBT for depression has been more extensively researched and practiced in Taiwan (Wu & Cheng, 1993), most practitioners only have college-level training in providing psychosoical therapy.
In order to meet this need, it is important to develop EBTs for depression that are not only effective, but can also be practiced by Chinese and Taiwanese mental health providers with limited training. These treatments should also have the flexibility to be implemented independent from the administration of medication, or combined with medication to further improve the treatment outcomes. A promising evidence based treatment (EBT) that can help address the prevalence of depression in China and Taiwan is Behavioral Activation, such as the Brief Behavioral Activation Treatment for Depression (BATD; Lejuez, Hopko, Acierno, Daughters, & Pagoto, 2011).
Behavioral Activation (BA) Treatment for Depression
Empirically supported research based on reinforcement and behavioral theories indicate that depression is often associated with a loss of positive reinforcement due to (1) an overall lack of available positive reinforcements; (2) an inaccessibility to available
reinforcers; and (3) a decrease in perceived value of potential reinforcers (Lewinsohn & Graf, 1973; MacPhillamy & Lewinsohn, 1971; Murphy, Correia, & Barnett, 2007). Modern BA treatments, such as BATD, were developed base on the reinforcement principles, and function as standalone EBTs for depression. The treatment focuses on helping clients
increase level of value based activtion, while reducing the occurrence of avoidance behaviors, such as rumination.
Dimidjian et al., 2006; Dobson, Dimidjian, et al., 2008; Ekers, Richards, & Gilbody, 2008; Ekers et al., 2014; Jacobson et al., 1996; Mazzucchelli, Kane, & Rees, 2009). Unlike CBT which requires sophisticated training and extensive practice to master, BA is much more cost-effective, brief, straightforward, and easy to be trained (Lejuez et al., 2011). With these features, mental health providers having limited training or practice experience can still well manage and practice BA (Daughters, Magidson, Lejuez, & Chen, 2016; Lejuez et al., 2011; Lejuez, Hopko, & Hopko, 2001).
In addition to its efficacy, BA has been successfully applied to different settings and demographics, such as inpatient (Hopko, Lejuez, LePage, Hopko, & McNeil, 2003),
outpatient (Dobson, Hollon, et al., 2008), and among college students (Gawrysiak, Nicholas, & Hopko, 2009). Further, BA has been adapted to address depression among ethnic
minorities in the United States, such as Latino immigrants with limited English proficiency (Collado, Castillo, Maero, Lejuez, & MacPherson, 2014; Kanter, Santiago-Rivera, Rusch, Busch, & West, 2010). One recent study reported that compared to Spanish-speaking Latinos receiving supportive counseling, Spanish-speaking Latinos receiving BA showed a greater decrease in depressive symptoms, higher rate of MDD remission, and a greater increase in behavioral activation and perceived environmental reward (Collado, Calderon, MacPherson, & Lejuez, 2016). These features of BA made it an ideal treatment to address the mental health needs in China and Taiwan.
Challenges Facing the Introduction of Behavioral Activation into China and Taiwan
Cross-cultural conceptualization of BA constructs. As previously discussed, one of the main focus for behavioral activation treatment is to increase individuals’ engagement in value based activation behaviors, and reduce the frequency of maladaptive coping behaviors, such as avoidance. However, it has been well supported by the literature that the same behavior may carry difference meanings across culture (for review, Triandis, 1994). In terms of activation and avoidance behaviors, there is no direct evidence supporting the
conceptualization of these behaviors are the same between Chinese and American culture. Chinese culture is heavily influenced by the the principles of Confucianism, which shares some similar values with the western culture, while differs on others. On the one hand, Confucianism values individual achievements and persist in goal-directed behaviors in the face of difficulties (Kim, 2009; Kim & Park, 2003). This ideology is very similar to the conceptualization of activation behaviors in BATD (e.g. item 12: I did something that was hard to do but it was worth it). On the other hand, other Confucianism values are more deviated from the ideologies valued in western culture, such as the “middle way” thinking (Peng & Nisbett, 1999), limiting the expression of strong emotions (Chen & Davenport, 2005), and emphasizing community or interpersonal “harmony” (Chen, 2000; Wang & Juslin, 2009). For example, a few studies found a common characteistics shared by Asian or Chinese American clients is diffuculties associated with emotion expression. The authors suggested one potential reason is that the lack of emotional control, which is manifested by disclose of emotions, is considered as a “shameful” behaviors that would threat the “harmony” of the community (Chen & Davenport, 2005; Hodges & Oei, 2007; Hwang, 2006; Lin, 2002; Miller, Yang, & Chen, 1997). In China and Taiwan, where the the influence of Confucianism is much stronger and the mental health resources are way more limited, avoidance behaviors, such as experiencial avoidance (e.g. supression of emotions), may become something
whether the understanding of any BA constructs, such as activation, avoidance, and BA related impairment, differ between Chinese and American cultures.
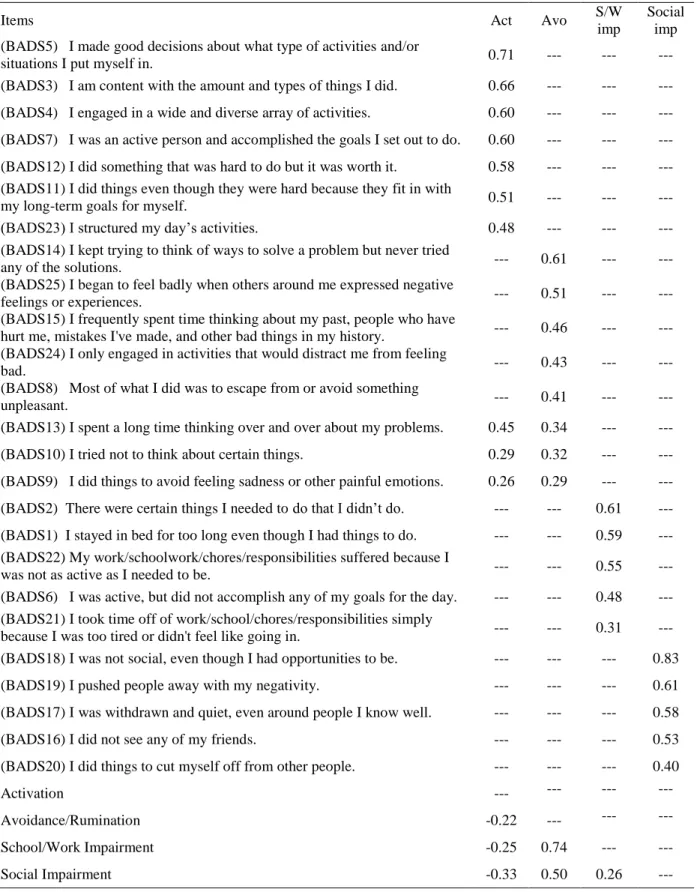
BA measures. In order to develop culturally sensitive BA treatment, it is critical to establish measures in Chinese language to accurately assess the hypothesized underlying mechanisms of change in BA. One such behavioral activation measures that has been validated in English is the Behavioral Activation for Depression Scale (BADS; Kanter, Mulick, Busch, Berlin, & Martell, 2007). This measure assesses an individual’s engagement in activation and avoidance behaviors, as well as impairments due to a lack of activation or the presence of avoidance behaviors. The BADS is thought to represent four factors:
activation, avoidance/rumination, work/school impairment, and social Impairment (Kanter et al., 2007). In particular, the activation factor represents focused, goal-directed behavior and completion of scheduled activities; the avoidance/rumination factor represents avoidance of negative aversive states and engaging in rumination rather than active problem solving; the work/school impairment factor represents the consequences of inactivity and passivity on work and school responsibilities; and the social impairment factor represents social consequences of avoidance and a lack of activation. This four factor structure has been established for the BADS in both college and community samples (Kanter et al., 2007; Fuhr, Hautzinger, Krisch, Berking, & Ebert, 2016; Kanter, Rusch, Busch, & Sedivy, 2009).
Consequently, BADS has been widely used in BA treatment studies (Armento et al., 2012; Collado et al., 2014; Daughters, Magidson, Schuster, & Safren, 2010; Magidson et al., 2011).
impairment factor. Additionally, item 25 (“I began to feel badly when others around me expressed negative feelings or experiences”) reloaded onto social impairment factor, instead of the original avoidance/rumination factor. With these changes, however, the study did not explain specific factors contributing to these changes, which left the reader in blind regarding what can be done to improve the psychometric functioning of C-BADS, as well as whether each subscale in C-BADS is still capturing the same concept as in the English version. As such, more work needs to be done to examine the psychometric prosperity of C-BADS, especially to identify and interpret the sources of differences from the original U.S model.
Shooting Two Birds with One Stone: Study Difference in Item Functioning for BADS
In thinking about pinpointing the unique functioning of BADS in China and Taiwan, as well as the impact of Chinese culture on BA related constructs, a single method that can help answering both questions is to study the BADS item level differences in functioning (DIF) between China/Taiwan and U.S. samples. DIF analysis using methods such as item response theory (e.g. IRT; Thissen & Steinberg, 2009) or factor analysis procedure (Thissen, 2016) can elicit the extent to which an item might be measuring different constructs or latent traits for individuals from separate groups. In the case of examining the psychometric
property of BADS or C-BADS, DIF analysis can provide information regarding whether any of the BADS items function differently between China/Taiwan and U.S., above and beyond the establishment of model fit. As previously discussed, It is possible that some BADS items would show DIF across culture, due to the cross-cultural differences in the understanding and expression of emotions and behaviors.
between China/Taiwan and the U.S., BA related constructs represented by these items are likely to be understood in similar ways across culture. For items that do exhibit DIF across culture, it is possible that cultural differences in the understanding of activation, avoidance, and impairment behaviors may contribute to the differences in item functioning. At the same time, it is also important to note that other factors, such as the quality of translation, may also contribute to the cross-cultural difference in item functioning. In thinking about introducing BA treatment into Chinese culture, it is also important to learn if any treatment principles or components needed to be modified to fit with the cultural expectation. This study may serve as the very first step in understanding how the key treatment components of BA, such as activation, avoidance, and impairment behaviors, are being understood in China and Taiwan.
Subgroup Difference between China and Taiwan
Even though China and Taiwan have a close kinship and Chinese culture is the mainstream culture for both regions, subgroup differences in culture values still exist. For example, Taiwanese are more acculturated to Western culture than Chinese do (Chu & Lin, 2001). These cultural differences between China and Taiwan may influence the population’s understanding and interpretation of psychological concepts. Based on these differences, it is important to independently compare the DIF pattern of BADS between U.S. and
China/Taiwan. It is anticipated that the magnitude of DIF differences between Taiwan vs. U.S. comparison would be smaller than that between China and the United States.
The Current Study
proposed by both Kanter et al., (2007) and Li et al., (2014) in the corresponding regions. Findings from the current study can further inform the psychometric properties of the C-BADS, the impact of culture on BA related constructs, and subgroup differences in understanding BA concepts among relatively homogenious populations. The aims and hypothesizes for the current study are:
Aim 1: examine item level difference in functioning between BADS and C-BADS using DIF analysis. It was expected that some BADS items would exhibit DIF in both the China vs. U.S. and Taiwan vs. U.S. comparisons.
Aim 2: confirmatory factor analysis was performed to replicate the factorial structure of BADS and C-BADS. We hypothesized that the U.S. sample would replicate Kanter’s model, while the Chinese and Taiwanese samples would replicate Li’s model (Kanter et al., 2007; Li et al., 2014).
Aim 3: examine the convergent validity of BADS (U.S.) and C-BADS (China and Taiwan) by studying their correlations with BDI (U.S.) and C-BDI (China and Taiwan). It is expected that BADS total score would have a medium negative correlation with BDI total score in all three regions.
METHODS
Participants
A total of 752 college students were recruited into the current study (300 from China, 300 from Taiwan, and 152 from U.S.). The inclusion criteria were: (1) having received more than 9 years of education in the region of recruitment (i.e. China, Taiwan, and the U.S.); (2) being native speakers of Chinese (China and Taiwan samples) or English (U.S. sample); (3) having citizenship of the region of recruitment (4) being 18 years of age or older. Among these participants, 651 were retained for analyses while the remaining were excluded due to careless responding (Desimone, Harms, & Desimone, 2015; Meade & Craig, 2012; Niessen, Meijer, & Tendeiro, 2016). The criteria for screening are outlined below.
Procedure
Data from the U.S., China, and Taiwan were collected using the Qualtrics platform (an online survey software; Qualtrics, Provo, UT) and all measures used in the current study were part of a larger battery of questionnaires.
consisting of Chinese versions of BADS (C-BADS) and BDI-II (C-BDI). Batteries were administered in simplified Chinese in China and traditional Chinese in Taiwan.
United States samples.152 participants in the United States were recruited from the University of North Carolina – Chapel Hill through online research pools in both the
Department of Psychology and Neuroscience, and the School of Business. Similar to the Chinese and Taiwanese samples, participants were first screened and eligible participants gave consent for the study using an online form. Participants were then asked to provide basic demographic information before completing the English versions of BADS and BDI-II
through the online survey.
Measures
Demographics survey. Information regarding gender, age, ethnicity, and marital status were collected for the Chinese, Taiwanese, and the U.S. samples.
Behavioral Activation for Depression Scale (BADS). In both BADS and C-BADS, respondents use a 7-point Likert scale to mark responses ranging from “Not at all” to
“Completely.” Both the BADS and C-BADS measure individual differences in the level of behavioral activation through four constructs: activation, avoidance/rumination, work/school impairment, and social impairment (Kanter et al., 2007). Appropriate factor structure and good construct validity have been established for BADS in both healthy college samples and community samples with elevated depressive symptoms (Kanter et al., 2007; Fuhr et al., 2016; Kanter et al., 2009).
Depression Scale (Radloff, 1977).
Beck Depression Inventory (BDI-II).The English version of the BDI-II (Beck, Steer, & Brown, 1996), a 21-item inventory, was used to assess the level of depression symptoms among U.S. college students in the current study. Each item of the BDI-II is rated on a four-point scale (0-3) with summary scores ranging between 0 and 63. The BDI–II has been found to demonstrate high internal consistency of > 0.9 in multiple studies (Beck, Steer, Ball, & Ranieri, 1996; Buckley, Parker, & Heggie, 2001; Segal, Coolidge, Cahill, & O'Riley, 2008).
The Chinese version of the Beck Depression Inventory (C-BDI-II; Leung, 2001), a 21-item inventory, was used in the current study to assess the severity of depression among the samples in China and Taiwan. Similar to the English version of BDI-II, each item is rated on a 0-3 scale with summary scores ranging between 0 and 63. Leung and colleagues (2001) found strong reliability estimates (Cronbach’s alpha > 0.8) across three samples using this measure. The same study found that the factor structure for the C-BDI was consistent with that of the English version of the BDI-II.
Data Analytic Plan
This involved the following steps: (a) based on factorial structures proposed by Kanter et al., (2007) and Li et al., (2014), examining unidimentionality for each subscale in BADS (C-BADS), for all 3 regions independently; (b) within each BADS and C-BADS subscale, examining the possibility of differential item functioning in the Chinese and Taiwanese samples with the U.S. sample – this allows us to see whether the items measure a latent construct to the same extent in the samples being compared; (c) examining whether previously established overall factor structures of the BADS fit responses from the three samples in the current study; and (d) investigating the convergent validity for the modified C-BADS using the C-BDI. These steps are discussed in detail below.
Screening for careless responses. Careless responses are partially random or
responses. All four indicators have demonstrated good sensitivity and specificity with simulated data (Desimone et al., 2015; Meade & Craig, 2012; Niessen et al., 2016).
The screening procedure involved two phases. In phase I, for each indicator we selected two cut scores to determine three subsets of responders: individuals at high risk, low risk, and no risk for careless responses. Cut scores were determined based on the distribution of the indicators, outlier statistics, and suggestions from previous literature (Desimone et al., 2015; Meade & Craig, 2012; Niessen et al., 2016). In this first step, no participants’ data were set aside (excluded). Rather, we used these cut scores to assemble two databases: one
database (clean) with participants flagged by none of the four indicators, or only flagged as low risk by one indicator; another database (at risk) with the remaining participants, who were flagged by one indicator as high risk, or by two or more indicators.
Using the “at-risk” dataset, we applied several strategies to determine which
responders to set aside, such as the combination of indicators (e.g. participants flagged as at high risk by multiple indicators). Responses that were relatively ambiguous (e.g. participants flagged as low risk by two indicators), were sent to phase II screening. In phase II screening, we applied different strategies to determine which participants’ data to keep or set aside. Strategies in phase II included investigating consistency in response patterns within subscales, and score discrepancy across subscales. A subset of data sent to phase II was marked clean, with the remaining set aside. By combining both screening procedures, a final list of careless respondents was identified. A detailed description of data screening can be requested by contacting the corresponding author.
category. Second, item means and standard deviations were examined to ensure that they were relatively similar within a scale. Third, Cronbach's alpha reliability estimates of both the C-BADS and BADS scales were examined to ensure an acceptable reliability of 0.7 or above (Bernstein & Nunnally, 1994). Finally, the correlation was computed between each item and the subscale total score (computed from all items except the one being studied). An item total correlation of 0.4 or above was thought to show substantial item internal consistency (Ware et al., 1980).
Subscale unidimensionality. Subscales were examined individually in this stage by verifying that the same set of items within the subscale loaded onto a single factor.The subscales can be considered unidimensional if a single factor structure is confirmed. This is a critical preparatory step for DIF analysis, because all subscales need to be unidimensional, and contain identical sets of items, before any DIF analysis can be performed. Kanter et al., (2007) and Li et al., (2014) purposed two slightly different factorial structures for BADS. To investigate subscale unidimensionality within all three regions, we fitted each BADS subscale within Kanter and Li’s models separately and selected models with the best goodness of fit with the current data.
We performed model fit analysis at the subscale level, instead of at whole scale level, for the following reasons. (1) The main purpose of the current study is to investigate the differential item functioning of BADS (C-BADS) items across regions, and this type of analysis only requires subscale unidimensionality. (2) It was unclear whether the factorial structure of BADS (C-BADS) would be different across regions. In case of any model misfit, it would be easier to detect these differences at a subscale (factor) level, rather than a whole scale level.
(CFI; Bentler, 1990), the Tucker-Lewis index (TLI; Tucker & Lewis, 1973), and the
Standardized Root Mean Square Residual (SRMR). In order to conclude good fit between the observed data and the hypothesized model, it is recommended that RMSEA should be ≤ 0.10, CFI ≥ 0.90, TLI ≥ 0.90, and SRMR ≤ 0.80 (Hu & Bentler, 1998; Yu, 2002). However, it is recommended that these cut scores must not be adhered to too rigidly (Marsh, Hau, & Wen, 2004).
Measurement invariance between groups as DIF analysis. In the current study, we designed our factorial invariance testing procedure primarily followed the work of Thissen (2013). The study found that DIF analysis using an IRT framework and the factor analytic approach yielded the similar results. The author suggested that in studies with relatively small sample size (e.g. hundreds of observations) and many response categories, the CFA approach has the advantage of having only three parameters per item, while under the Graded IRT framework, in the case of BADS (C-BADS), each item will have seven parameters. The extra information provided by these additional four parameters may not outweigh the complexity.
The specific factor analysis model based DIF detection procedure includes the following six steps. (1) Identify one item to be the initial anchor for each subscale. The selection process included identifying an item that well represents the construct, and possibly showing the minimal difference between groups when all three regions were assumed N (0, 1). (2) Establish the base model by constraining the slope, intercept, and unique variance parameters for the selected anchor item while keep the three parameters for the rest items in the subscale free across groups. (3) Constrain the three parameters for the remaining items equal between groups, one item at a time, examining the change in model fit. A significant change in model fit after constraining the parameters of an item indicates that item may exhibit DIF. A list of potential DIF items was generated in this step (with the p-values
formed a new anchor. (4) Using the new anchor, the DIF screening procedure in Step 3 was repeated for all items that showed DIF in step 3. (5) Continue steps 3 and 4 until all the remaining items showed DIF. Steps 1 to 5 were repeated for all four subscales in both the China vs. U.S. and the Taiwan vs. U.S. comparisons. All DIF and goodness of fit tests were performed using the linear model and maximum likelihood estimation as implemented in the lavaan software (Rosseel, 2012).
Overall model fit. The confirmatory factor analysis (CFA) was conducted with lavaan software (Rosseel, 2012) using a maximum-likelihood method. Data from each region were fitted with both Kanter’s (2007) and Li’s (2014) models independently. Models with better goodness of fit were selected as the final models for BADS (C-BADS) in each region. Similar to the unidimensionality test, we used RMSEA, CFI, TLI, and SRMR to test the overall model fit for BADS or C-BADS. We adopted the same cut scores for these indicators as for the subscale unidimensionality.
Convergent validity. Previous studies reported a strong association between
RESULTS
Sample Characteristics
Screening the data for careless responses. Figure 1 summarizes the data screening process. Based on phase I screening, 28, 14, and 10 participants’ data were set aside from the China, Taiwan, and U.S. samples, respectively. After phase I, we were still not certain about the data quality for 41 participants from China, 52 from Taiwan, and 19 from the U.S. These data were screened based on the phase II procedure. Data from the remaining 231 Chinese, 234 Taiwanese, and 123 U.S. participants were marked as clean. In phase II data screening, an additional 18, 25, and nine participants’ data from China, Taiwan, and U.S. were set aside. The remaining participants’ data (23 from China, 27 from Taiwan, and 10 from U.S.) were marked as clean. The final clean sample included 254 participants from China, 261 from Taiwan, and 133 from the U.S.
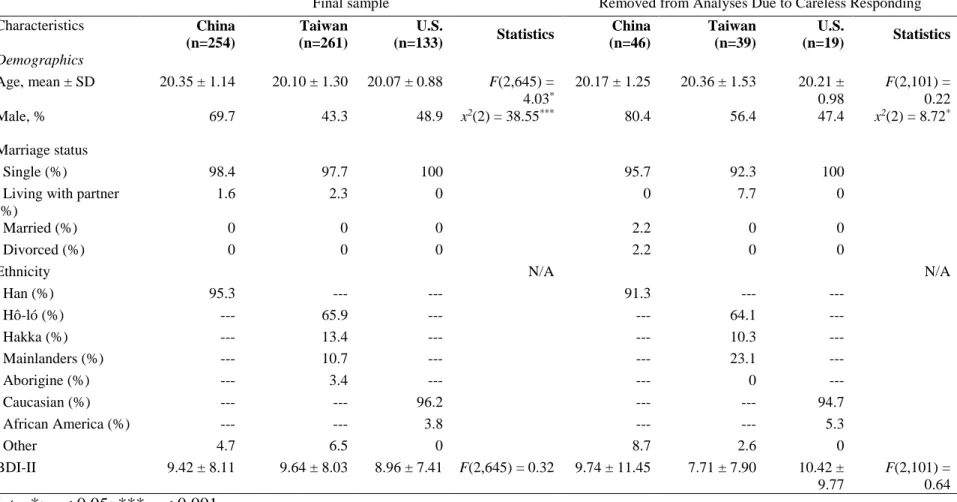
Demographics. Table 1 summarizes the demographic information for all participants. The Chinese sample (age M=20.35, SD=1.14) was slightly older than the U.S. sample (age M=20.07, SD=0.88), and the Taiwan sample fell between the two (age M=20.10, SD=1.30). There was no significant age difference between the Taiwanese and U.S. sample.
Significantly more participants in China were male (69.7%), as compared to participants in the Taiwanese (43.3%) and U.S. (48.9%) samples, χ2(2) = 38.55, p < 0.001. On average,
Classical Test Theory
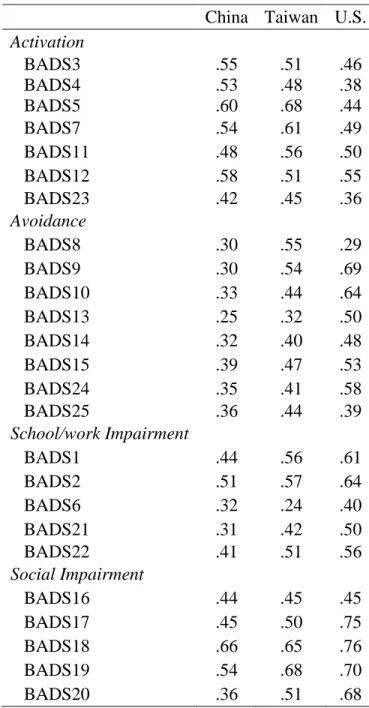
Table 2 summarizes the Cronbach’s α values for the BADS (C-BADS) total and subscale scores in the current study, as well as those reported in the literature. Across all three regions, acceptable or good internal consistency was observed at the total scale and subscale level, except the avoidance and work/school impairment subscales in China. In addition, the internal consistency for the Taiwan avoidance subscale was also much lower than previously reported in western countries, but was relatively consistent with Li’s report (2014). Table 3 shows that for the Chinese sample, all items in the avoidance subscale had item-total correlations smaller than 0.4 (r range from 0.25 – 0.39). A small item-total correlation indicates that an item is not measuring the same construct as the rest of the items in the same factor. The fact that all items in the Chinese avoidance subscale had low item-total
correlations indicates that these items may not be measuring one consistent avoidance factor as proposed in the original scale development (Kanter et al., 2007).
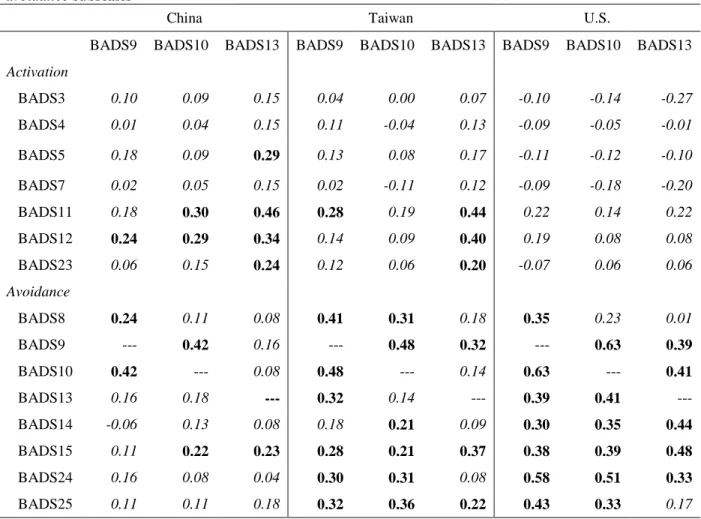
To further investigate the low internal consistency for the avoidance factor in the Chinese and Taiwan samples, we calculated inter-item correlations among the eight avoidance items and all 25 items in the BADS. Results show that three items in the
avoidance factor (r range from 0.22 to 0.37), at p = 0.001. In the U.S. sample, item 13 shows no correlation with any of the activation items, and significantly weak to moderate
correlations with 5 avoidance items (r range from 0.33 to 0.48), at p = 0.001. Taken together, in both the Chinese and Taiwanese samples, but not the U.S. sample, item 13 is positively correlated with a number of items in the activation factor, yet it lacks correlation with other items in the avoidance factor. This contradicts the original conceptualization of BADS, because items in the activation and avoidance factors are expected to have either no
correlation or negative correlation with each other (Kanter et al., 2007). The item correlation patterns in the U.S. sample fit well with the original conceptualization of BADS.
In the Chinese sample, items 9 and 10 in the avoidance scale also show positive, weak correlations with 1-2 items in the activation factor (p = 0.001; see Table 4). A similar
relationship was observed for item 9, but not item 10, in the Taiwan sample. In the U.S. sample, both item 9 and item 10 were significantly correlated with most avoidance items, but no activation items, at p = 0.001. Again, the performance of items 9 and 10 are consistent with originally conceptualization of BA in the U.S. sample, but less consistent in the Chinese and Taiwanese samples.
Taken together, for the Chinese and Taiwanese samples, items 9, 10 (only in Chinese sample) and 13 may contribute to the lack of internal consistency within the avoidance factor, and need to be taken into consideration when testing the overall model fit for C-BADS. Given that the goal of this research is to study DIF with all BADS (C-BADS) items, we decided to proceed with the remaining analysis including these items in the model.
Subscale Unidimensionality
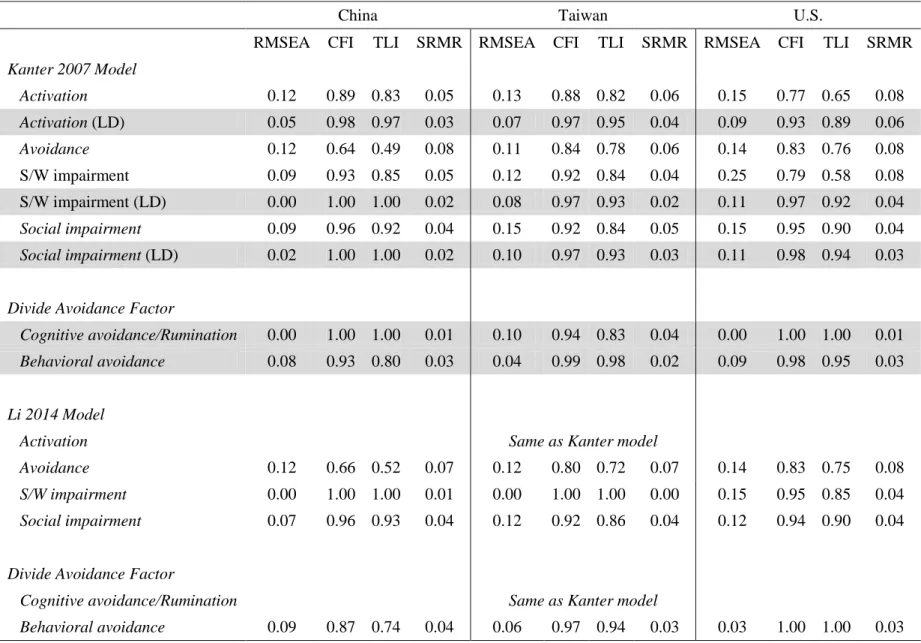
activation, avoidance, work/school impairment, and social impairment subscales that have been established in these two studies. Data from all three regions did not fit very well with any subscale structures proposed by Kanter et al. (2007). On the other hand, the Chinese sample fit well with the work/school impairment and social impairment structure, and the Taiwanese sample fit well with the work/school impairment structure proposed by Li et al., 2014. Our U.S. sample did not fit well with Li’s structure for any of the four subscales. This makes intuitive sense because Li’s structure was initially established in the Chinese
population. In this case, we cannot simply adopt any of the existing factorial structure proposed by either author, because subscales for China, Taiwan, and U.S. are required to be unidimensional and have the same sets of items before any DIF analysis can be performed.
To further investigate the lack of model fit, we tested potential local dependence (LD) within each factor across all three regions, using the “modification index” (MI) function in lavaan. Local independence of items is an assumption in all latent variable models, which means that items in a test should not be related to each other more than is accounted for by variation on the latent variable. A failure of local independence may result in biased
parameter estimation. To study LD, the MI can identify pairs of items that are correlated on a statistical level, but it is still researchers’ responsibilities to study the characteristics of the items. The researchers may then decide whether two items are truly dependent on both the statistical and theoretical levels. For the current study, because data were collected
independently for all three regions, if consistent patterns of LD are observed across regions, it increases our confidence that the sources of LD are likely to be the measurement per se, instead of errors associated with data collection. The following section discusses LD for each BADS (C-BADS) factor, and all discussion is based on Kanter model because it is the
original factor structure for BADS.
because they fit in with my long-term goals for myself”) and 12 (“I did something that was hard to do but it was worth it”) was observed in all three regions, with MI values equal to 43.50, 45.86, and 33.95 for China, Taiwan, and the U.S., respectively. We addressed this LD by freeing the error correlation between these two items, and the models in all three regions show good model fit once that is done (see Table 5). This consistent pattern of LD across all three regions indicated that items 11 and 12 may function similarly and violate the local independence assumption in latent variable testing. On the conceptual level, the wording and concepts measured by these two items are relatively similar to each other, which confirms our LD finding. In practice, it is suggested that researchers may consider removing one of these two items from the scale. In the current study, because the purpose is to study DIF for all BADS (C-BADS) items, we decided to leave both items in the model, and include correlated errors between items 11 and 12 for all the remaining analyses.
Work/school impairment. Strong LD between items 21 (“I took time off of
Social impairment. Strong LD between items 19 (“I pushed people away with my
negativity”) and 20 (“I did things to cut myself off from other people”) was observed in all three regions, with MI values equal to 11.40, 21.38, and 10.31 for China, Taiwan, and the U.S., respectively. Compared to the rest of the items in social impairment factor, these two items conceptually function very similarly to each other. We included correlated errors between these two items, and the models in all three regions then show good model fit.
Avoidance. The pattern of LD for the avoidance factor is much more scattered than for the other three factors. No item-pairs show consistent LD across all three regions. Strong LD was observed between items 9 -10 and items 9-14 in China, items 9-10 and items 13-15 in Taiwan, and items 14-15 in the U.S. This scattered pattern of LD demonstrates the lack of consistency in the understanding and interpretation of the avoidance concept across regions.
Given DIF analysis could not be performed without the establishment of
unidimensionality for each subscale, we investigated the characteristics of each item in the avoidance factor and discussed the nature of these items with experts in the field of
behavioral activation. As discussed in the original manuscript, the avoidance factor includes items representing both the concepts of avoidance and rumination (Kanter et al., 2007). However, the concept of avoidance can be further differentiated into two distinguished categories: cognitive avoidance and behavioral avoidance. Cognitive avoidance is associated with the avoidance of processing disturbing thoughts, while behavioral avoidance is
associated with the avoidance of uncomfortable behaviors. The link between rumination and cognitive avoidance is well supported, while the connection between rumination and
avoidance, but not behavioral avoidance (Dickson, Ciesla, & Reilly, 2012). Based on these findings, we concluded that on the conceptual level, the eight avoidance items may be related to two separated concepts: behavioral avoidance (items 8, 9, 24, 25) and cognitive
avoidance/rumination (items 10, 13, 14, 15).
We divided the avoidance factor into cognitive avoidance/rumination and behavioral avoidance. We first investigated the model fit for these two factors separately. All issues with LD disappeared after dividing the factors, and good model fits were found for both factors across all three regions (see Table 5). Taken together, the analysis suggested that individual model unidimensionality can be established once we separate the avoidance items into behavioral avoidance and cognitive avoidance/rumination.
To study whether we should consider BADS (C-BADS) as a 4-factor or a 5-factor model when testing the overall model fit, we used confirmatory factor analysis to study the change in goodness of fit between one and two factor models for the avoidance items. Results show a significant improvement in model fit for a 2-factor model in the U.S. sample, Δχ2(1) =
16.15, p < 0.001. For the Chinese and Taiwanese samples, however, the model fit did not improve and still fit poorly even after adapting the 2-factor model for avoidance items. The results suggest that for the overall model fit testing, we should still adapt the 4-factor model for Chinese and Taiwanese samples, while a 5-factor model structure may better represent the U.S. sample.
Measurement Invariance between Groups as DIF Analysis
and the modeled conditional distributions of the responses at f values of -2, 0 and 2. All items in the avoidance, work/school impairment, and social impairment factors were reverse coded for the DIF analysis. A higher score in these three factors indicates lower avoidance or impairments, and higher level of behavioral activation.
Activation. Item 11 (“I did things even though they were hard because they fit in with
my long-term goals for myself)” was selected as the initial anchor item, and shows minimal difference among item models when all three regions were assumed N (0, 1). Table 6 summarizes the linear CFA DIF detection results for this factor. In the China vs. U.S. comparison with item 11 as anchor, items 3, 5, and 12 exhibit no DIF, while items 4, 7, and 23 exhibit DIF. With items 3, 5, 11, and 12 as anchor, items 4, 7 and 23 continued to show DIF. A similar procedure was performed for the Taiwan vs. U.S. comparison. With items 3, 4, 7, 11, and 12 as anchor, items 5 and 23 were identified as the DIF items.
Taken together, almost all activation items have similar slopes across regions, indicating that these items are equally effective at discriminating individuals with different levels of activation across all three regions. Two items show smaller unique variances in Taiwan than the U.S., indicating that U.S. participants with the same level of activation (f) gave more various response than those from Taiwan. Lastly, the magnitude of differences between Taiwan and the U.S. is smaller than that of China and the U.S.
Cognitive avoidance/rumination. All of the items in the cognitive
avoidance/rumination subset appeared to function differently based on item models when all three regions were assumed N (0, 1). Item 15 (“I frequently spent time thinking about my past, people who have hurt me, mistakes I've made, and other bad things in my history.”) was selected as anchor item. Table 7summarizes the linear CFA DIF detection results for this factor. In the Taiwan vs. U.S. comparison, with item 15 as anchor, items 10 and 14 exhibit no DIF, while item 13 exhibits DIF. More specifically, the intercept of item 13 appears to be similar between Taiwan and U.S., while the slope and unique variances appear to be greater in the U.S. sample, compared to that of the Taiwan sample (see Figure 4). With item 15 as anchor, all the other items in the in the China vs. U.S. comparison show DIF. For items 10, 13, and 14, it appears the slopes for all three items are steeper in the U.S. sample compared to the Chinese sample. For item 10 (reverse coded), U.S. participants with the latent cognitive avoidance level (f) greater than -1 reported lower average responses than the Chinese sample. The relationship is the opposite for item 14, such that U.S. participants with the latent
cognitive avoidance level (f) smaller than 1 have higher average response than those from China. In addition, the unique variance for item 14 also appear to be smaller in the U.S. sample, compared to that of the Chinese sample.
three regions were assumed N (0, 1). When item 8 (“Most of what I did was to escape from or avoid something unpleasant”) was selected as anchor item, the remaining three items in this factor appear to function differently in both comparisons (see Table 8). As shown in Figure 5, the slopes for all three items are uniformly steeper for the U.S. participants as compared to their Chinese and Taiwanese peers. In addition, for all three items, Chinese participants appear to display larger unique variances than their U.S. counterparts. For item 24 (reversed coded) and f < 1.5, among participants with the same latent level of behavioral avoidance, the average responses from the Chinese and Taiwanese samples were lower than that of the U.S. sample.
Work/school impairment. Item 2 (“There were certain things I needed to do that I didn’t do”) was selected as anchor item for S/W impairment. It is worth noting that this item also appears to have minimal differences among item models when all three regions were assumed N (0, 1). With item 2 as anchor, all items appear to have differences in functioning for the China vs. U.S. comparison, and all items except item 1 appear to have differences in functioning for the Taiwan vs. U.S. comparison (see Table 9). Figure 6 shows the patterns for both comparisons. Items 6, 21, and 23 appear to have larger unique variances in the Chinese sample than the U.S. sample. The slope of the U.S. sample appears to be steeper than that of the Chinese sample for item 1, and steeper than that of the Taiwanese sample for item 6. Among participants with the same latent level of work/school impairment, for items 6, 21, and 22 (all reversed coded), most U.S. participants endosed lower response items compared to participants from China and Taiwan. The relationship is the opposite for item 1 in the China vs. U.S. comparison.
appear to function differently. The unique variances from the Chinese and Taiwanese samples are higher than those from the U.S. sample (see Figure 7). This is understandable given that the majority of the U.S. sample endorsed the most extreme answer (“not at all [impaired]”) for all five items in this factor, while participants from China and Taiwan endorsed a wider range of responses. In terms of slope differences, it appears that U.S. sample has steeper slopes for items 17 and 20 than the Chinese and Taiwanese samples. Further, for participants with the same latent level of social impairment, the average responses from the U.S. sample are lower than those from the Chinese sample for items 16 and 17 (both reversed coded). The opposite relationship was observed for item 20. In the Taiwan vs. U.S. comparison, for item 16, responses from the Taiwan sample are higher than those from the U.S. sample among participants with the same latent level of social
impairment.
For the two avoidance and two impairment factors, he magnitude of differences in the Taiwan comparison is always smaller than that in the China comparison.
Testing the Overall Model Fit
previously discussed, for items in the avoidance factor, the 2-factor model fits better with the U.S. data. We then tested a 5-fator model with the U.S. sample, taking cognitive
avoidance/rumination and behavioral avoidance as two separate factors. The 5-factor model fits the U.S. data significantly better than the 4-factor model, Δχ2(4) = 26.43, p < 0.001. In the
5-factor BADS model, both the RMSEA and SRMR indices remained the same as the 4-factor model, while the CFI and TLI indices slightly improved.
To investigate the potential source of model misfit in China and Taiwan, we first investigated the correlations among factors. Results show that for both Chinese and Taiwanese samples, the activation factor has very weak, negative correlation with the avoidance factor (r = -0.12 for China and r = -0.10 for Taiwan). As previously discussed in the classical test theory section, items 9, 10 and 13 were positive correlated with a number of activation items, while they lacked correlations with the remaining avoidance/rumination items in the Chinese sample. The same pattern was observed for items 9 and 13 in the
Taiwanese sample. As such, we reinvestigated the overall model fit by cross loading items 9, 10, and 13 with activation and avoidance/rumination factors in China, and items 9 and 13 with the same two factors in Taiwan. In both China and Taiwan, the loading for all cross loaded items were significant for both factors (p < 0.001). We then compared the differences in goodness of fit between models with and without cross loading. The models with cross loading fitted significantly better in both China, Δχ2(3) = 63.96, p < 0.001, and Taiwan,
Δχ2(2) = 50.84, p < 0.001. The RMSEA and SRMR indices demonstrate acceptable model fits
in the cross loading models for both China and Taiwan. The CFI and TLI are about 0.8 in both regions, which is lower than some recommended thresholds. Nevertheless, these indicators have close values similar to those reported in previous studies (See Table 11).
Taiwan) as appropriate to be used as behavioral activation measures in the Chinese and Taiwanese samples. Tables 13 to 15 summarizes the factor loading for China, Taiwan, and the U.S., respectively.
Overall Goodness of Fit indicators have often been considered as “standard tools” to evaluate the quality of measures. With the acknowledgment of their contributions, it is one of the many methods that can help researchers understand the function and property of the measures. Statistics methods should only be used as tools to guide decision making, instead of becoming shortcuts to conclusions. Researchers should still think above and beyond a set of numbers to evaluate the validity and implications of any measure. The implication of these findings will be discussed in the discussion section.
Convergent Validity
DISCUSSION
The current study aimed to investigate the difference in factor structure and item level functioning between the BADS in the United States and the C-BADS among participants from China and Taiwan. It is also hypothesized that the magnitude of differential item functioning (DIF) would be less in the Taiwan vs. U.S. than the China vs. U.S. comparison. The results of DIF analysis demonstrate that even with the establishment of good overall model fit, individual items still function differently across the Chinese and U.S. cultures. As expected, at least one item in all BADS factors exhibited DIF, with items in the activation factor having the smallest magnitude of DIF compared to items in the remaining factors. In addition, the current study failed to replicate both the Li et al., (2014) structure in China and Taiwan, and the Kanter et al., (2007) structure in the U.S. sample. Instead, the Kanter et al., (2007) model showed acceptable model fit after freeing the error correlations for three pairs of items, and cross loading three (items 9, 10 and 13) and two (items 9 and 13) items in the Chinese and Taiwanese samples, respectively. Further, as hypothesized, the magnitude of DIF differences was lower in the Taiwan vs. U.S. than the China vs. U.S. comparison.
Differential Item Functoning
these differences were significant, the magnitude of DIF was much smaller for activation items than items in the remaining four factors.
The word “inconsistent” best captures the mixed DIF patterns for items in the avoidance and impairment factors. With one or two exceptions, most items in these factors show equal or better discriminative abilities in the U.S. sample than in the Chinese and Taiwanese samples. Put another way, the quality of most C-BADS items in the avoidance and impairment factors are worse than the corresponding items in the BADS. For all items that exhibit differences in unique variances, U.S. participants with the same latent level of avoidance or impairment gave less various responses than those from China and Taiwan.
Further, Not only most items in the avoidance and impairment factors show DIF, the patterns and magnitudes of DIF also varies a lot from item to item. That said, even most items show steeper slopes and smaller unique variances in the U.S. sample than the Chinese/Taiwanese samples, the magnitude and combinations of these differences varies. Nevertheless, if we were to compare the pattern of difference between the China/U.S. and the Taiwan/U.S. comparisons, it seems for most items, the patterns of differences are similar for each item between these two comparisons. In addition, it appears that a few items that exhibit DIF in the China/U.S. comparison do not show DIF in the Taiwan/U.S. comparison. Further, for items that do show DIF, the magnitude of difference is smaller in the Taiwan/U.S.
comparison for all DIF items.
Factor Analysis
items can be interpreted as either activation or avoidance behaviors in China. This suggests that these items did not function in the way demonstrated by Kanter et al., (2007), and Chinese participants may interpret avoidance behaviors represanted by these three items differently compared to participants in the United States.
Taiwan sample shows a similar but slightly different pattern of item loading
comparted to the Chinese sample. Item 13 has acceptable loading on both the activation and avoidance factors, indicating that this item may represent both the concepts of activation and avoidance among Taiwanese participants. Item 9 also shows acceptable loading onto the activation factor, but loaded significantly better onto the avoidance factor. As such, item 9 seems to represent avoidance behaviors in Taiwan.
Results from the factor analysis demonstrate that the functioning of the C-BADS in China and Taiwan differs from the functioning of the BADS in the United States. Consistent with our hypothesis, the factor structure of the Taiwanese sample is more similar to the original model proposed by Kanter et al., (2007), compared to that of the Chinese sample.
Theoretical Explanations for the Factorial and Item Differences Across Culture
Culture difference in the conceptualization of avoidance and impairment
behaviors. In both comparisons, almost all items in the avoidance and impairment factors show DIF, with a few avoidance items also cross loading onto the activation factor. Specific ideologies valued by the Chinese culture may help explain this observation.
First, Chinese culture emphasizes the “harmony” of the community (Pitta, Fung, & Isberg, 1999). Interpersonal conflicts are considered as threats to community “harmony,” which should be avoided whenever possible (Chen, 2000; Wang & Juslin, 2009). In addition, Chinese culture discourages the expression of strong emotions, which sometimes can be considered a pathological behavior (Chen & Davenport, 2005). This cultural norm was manifested by some Chinese proverbs, such as “of the mouth comes evil” and “The more you talk, the more mistakes you make.” As a result, Chinese individuals are encouraged to remain calm during social events, without expressing their personal thoughts and feelings (Lin, 2002). Further, Chinese culture often portrays individuals with mental illnesses as someone who lacks will power (Lee, 1996) and/or have moral lapses (Geaney, 2004). This stigma not only keeps individuals from seeking mental health services (Fung, Tsang, & Chan, 2010; Fung, Tsang, Corrigan, Lam, & Cheung, 2007), but also creates a sense of “shame” around disclosing difficult emotional experiences to others.
experiencing difficult emotions, but are bound by social norms to not express these emotions. As a natural response, people may turn to avoidance behaviors as a way of coping. This coping behavior may not be necessarily adaptive; however, it does serve a function for these individuals under stress, at least temporarily. Similarly, for the concept of impairment, item 17 (“I was withdrawn and quiet, even around people I know well”) was originally designed to evaluate social impairment in the United States. In China and Taiwan, however, this behavior may not necessarily be considered as something negative, because being quiet in social events is something valued by Chinese culture.
Taken together, these cultural differences may attribute different meanings to
avoidance and impairment behaviors in Chinese culture. Specifically, these behaviors might be maladaptive even among Chinese and Taiwanese by worsening mood; however, the cultural values emphasized by these two regions may make these behaviors “seemed to be” socially adaptive in certain situations. This inconsistency may help explain the larger unique variances, flatter slopes, and item cross-loadings observed among Chinese and Taiwanese samples, as compared to their U.S. peers.
Cultural difference in response style. It has been well supported by the literature that East Asians show higher ambivalence than Americans when evaluating themselves. One study reported that compared to Americans, Chinese participants exhibited greater evaluative contradiction or “ambiguity,” so that they were more likely to describe themselves using both positive and negative terminology (Spencer-Rodgers, Peng, Wang, & Hou, 2004).
less extreme responses than Americans did (Hamamura, Heine, & Paulhus, 2008; Kitayama, Markus, Matsumoto, & Norasakkunkit, 1997; Song, Cai, Brown, & Grimm, 2011). This theory is also supported by data from the current study, with 8.9%, 7.2%, and 17.7% of the extreme response items (on both the highest and lowest end) being endorsed by Chinese, Taiwanese, and U.S. participants, respectively.
Therefore, the Chinese and Taiwanese participants’ tendency to avoid selecting extreme responses on items may have decreased these items’ abilities to discriminate among individuals with various levels of avoidance or impairment. This would explain the flatter slopes for avoidance and impairment items in the Chinese and Taiwanese samples, compared to that of the U.S. sample.
Change in item meanings due to translation. The alter of item meaning due to translation may also contribute to the cross-cultural difference in item functioning and factor structure. There is no doubt that the quality of translation may impact the differences in functions between BADS and C-BADS. Even with skilled translators, it is often difficult to find identical expressions for the same concepts in a different language. Also, translators sometimes need to compromise the accuracy of translation for the sake of ease of
understanding. For example, item 19 states “I pushed people away with my negativity.” The Chinese words with the exact meanings as “negativity” are “负面” or “负向.” However, these two phases are used mostly in scientific writings, instead of daily communication. The commonly used Chinese vocabulary that has the closest meaning with “negativity” is “消极,” which actually means “passive” in English. Here the translators need to either use the
word that the translators believe may slightly work better than the other option(s). These cross culture differences sometimes made it impossible to replicate identical measures between two language versions. The change of item meanings due to translation may certainly lead cross-cultural difference in factor structure and item functioning, while the direction and magnitude of the impact are difficult to predict.
Is It Culture Value, Translation, or Response Style?
In thinking about potential ways to improve the function of C-BADS in the future, as well as provide meaningful information to assist with other cross-cultural psychometric studies, it could be helpful to identify which factors might be the primary sources accounting for the differences. Based on findings from the current study, cross-cultural differences in response style is unlikely to be the primary source of the differences. Given that the response style is likely to be consistent across the entire measure, if response style were to be the main source of the difference, then the DIF patterns for items in the activation factor would be similar to the pattern of DIF pattern among items in the remaining four factors.
The impact of translation on the function of C-BADS is difficult to determine, because the quality of translation across an entire measure may vary from item to item. Indeed, certain words in the English language do not have corresponding words in Chinese that reflect the exact meaning. In the case of C-BADS, some concepts do not have good equivalent translated words in Chinese language, such as “negativity,” “aggressive,” “withdraw,” and “suffer.”
is the uniformly smaller magnitude of DIF observed in the Taiwan and U.S. comparison, compared to the China and U.S. comparison. This is in line with the difference in the degree of acculturation to the western culture between individuals from China and Taiwan.
The purpose of this discussion is not to reach a conclusive decision regarding the primary sources of differences between the function of BADS and C-BADS. Rather, the goal here is to elicit some initial ideas to inform the potential direction of research moving
forward. Compared to the impact of response style, it may be that translation and cultural value have influenced the differences between BADS and C-BADS functioning to a greater extent. This raises the importance of being cautious when translating measures across culture and languages and the need to psychometrically assess the validity of a translated measure among different cultures before interpreting their results.
Recommendations and Future Directions
In clinical practice, future studies may use the C-BADS in China and Taiwan follow the Kanter et al., (2007) model. Even the functioning of C-BADS is acceptable, for
investigators who aim to study cross-cultural difference in behavioral activation using BADS or C-BADS, it is important to take into consideration that C-BADS performs as well as BADS in assessing activation levels, but does not work very well at discriminating
individuals with different levels of avoidance and impairment. Further, some avoidance and impairment items used in the English version of BADS may not best capture the
In thinking about introducing BA treatment into Chinese culture, findings from the current study suggested that modification in BA treatment are required to fit the treatment principle and components with the expectation of Chinese culture. More specifically, when training therapists to help the clients identify potential avoidance behaviors that may cause their depressive symptoms, it is important for the treatment manual to highlight potential avoidance behaviors that are commonly utilized by Chinese individuals. Additionally, it is also important for the therapists to be aware of that the impairments as the result of
depression may also have their unique manifestations in Chinese culture, which are likely to be different from that in the western culture.
For future cross culture psychometric studies, findings from the current study suggest that the establishment of overall model fit in the target culture is not sufficient to ensure that the scale functions in the same way as its original version. As such, future studies may consider incorporating DIF analysis discussed in the current study, or other DIF analysis procedures (e.g. IRT), as standard procedures to examine item level differences in
functioning across cultures. Items with poor performance should be replaced by new items that better capture the local conceptualizations of the latent trait being measured. Indeed, rather than merely conducting direct translations across two different languages, it is important to consult local experts in the field to generate items that conceptually map on to the meaning of the construct being measured.
Last but not least, compared to China, the functioning of the C-BADS in Taiwan was more similar to that of the U.S. sample. This finding indicates that even among individuals who speak the same language and share a similar culture of origin, it is important to
Limitations
The sample size for the U.S. sample (n=133) is smaller than that of the Chinese (n=254) and Taiwanese samples (n=261), hence the margin of error might be larger for the U.S. sample. However, it is unlikely that this has biased the results we obtained because even though sample size was smaller, it was still adequate to compute the statistics (Wolf,
Harrington, Clark, & Miller, 2013). Additionally, it is important to note that DIF analysis requires the investigators in the current study to select an item to be the first anchor, and gradually build up the model based on that item. The selection of this item depends to a large extent on the subjective judgment of the researchers, and the pattern of DIF may change based on which items was selected as anchor. As such, some caution must be applied when interpreting the results. Further, there are significantly more male in the Chinese sample compared to Taiwan and U.S. samples, and previous studies have suggested gender differences in engaging in avoidance behaviors (Nolen-Hoeksema & Jackson, 2001). It is possible that this difference may contribute to the smaller DIF differences between Taiwan vs. U.S. comparison. Lastly, the current study used college student samples in all three regions, which limits the generalizability of the findings. Specifically, even no study has ever investigated the function of C-BADS among Chinese and Taiwanese individuals with
elevated levels of depression, it is likely that the conceptualization of activation, avoidance, and impairment concepts may differ between depressive individuals and college student samples. As such, future studies may apply DIF analysis to study this relationship.
Conclusion
REFERENCES
Armento, Stanley, Marsh, Kunik, York, Bush, & Calleo. (2012). Cognitive behavioral therapy for depression and anxiety in Parkinson's disease: a clinical review. J Parkinsons Dis, 2(2), 135-151. doi:10.3233/JPD-2012-12080
Asparouhov, & Muthen. (2009). Exploratory Structural Equation Modeling. Structural Equation Modeling-a Multidisciplinary Journal, 16(3), 397-438.
doi:10.1080/10705510903008204
Beck, Steer, Ball, & Ranieri. (1996). Comparison of Beck Depression Inventories-IA and -II in psychiatric outpatients. Journal of Personality Assessment, 67(3), 588-597.
doi:DOI 10.1207/s15327752jpa6703_13
Beck, Steer, & Brown. (1996). Beck depression inventory-II.
Bentler. (1990). Comparative fit indexes in structural models. Psychol Bull, 107(2), 238-246. Bernstein, & Nunnally. (1994). A catastrophe model for developing service satisfaction
strategies. Journal of Marketing, 56, 83-95.
Buckley, Parker, & Heggie. (2001). A psychometric evaluation of the BDI-II in treatment-seeking substance abusers. Journal of Substance Abuse Treatment, 20(3), 197-204. doi:Doi 10.1016/S0740-5472(00)00169-0
Chan, Yang, Chen, Yu, & Leung. (2006). Cost of depression of adults in Taiwan. International Journal of Psychiatry in Medicine, 36(1), 131-135. doi:Doi 10.2190/6kn8-F4lv-7yv9-Fm8g
Chen. (2000). The impact of harmony on Chinese conflict management. Chinese conflict management and resolution, 3-17.
Chen, Chen, Chou, Sun, Chen, Tsai, & Chao. (2007). The relationship between quality of life and posttraumatic stress disorder or major depression for firefighters in Kaohsiung, Taiwan. Quality of Life Research, 16(8), 1289-1297. doi:10.1007/s11136-007-9248-7 Chen, & Davenport. (2005). Cognitive-behavioral therapy with Chinese American clients:
Cautions and modifications. Psychotherapy, 42(1), 101-110. doi:10.1037/0033-3204.42.1.101
Chen, Li, Tsai, Lin, Chang, Chen, . . . Bai. (2015). Risk of Subsequent Dementia Among Patients With Bipolar Disorder or Major Depression: A Nationwide Longitudinal Study in Taiwan. Journal of the American Medical Directors Association, 16(6), 504-508. doi:10.1016/j.jamda.2015.01.084
Chu, & Lin. (2001). Political development in 20th-century Taiwan: State-building, regime transformation and the construction of national identity. China Quarterly(165), 102-129.
Collado, Calderon, MacPherson, & Lejuez. (2016). The Efficacy of Behavioral Activation Treatment Among Depressed Spanish-Speaking Latinos. Journal of Consulting and Clinical Psychology, 84(7), 651-657. doi:10.1037/ccp0000103
Collado, Castillo, Maero, Lejuez, & MacPherson. (2014). Pilot of the Brief Behavioral Activation Treatment for Depression in Latinos With Limited English Proficiency: Preliminary Evaluation of Efficacy and Acceptability. Behavior Therapy, 45(1), 102-115.
Cuijpers, van Straten, & Warmerdam. (2007). Behavioral activation treatments of depression: A meta-analysis. Clinical Psychology Review, 27(3), 318-326.
doi:10.1016/j.cpr.2006.11.001
Daughters, Magidson, Lejuez, & Chen. (2016). LETS ACT: a behavioral activation treatment for substance use and depression. Advances in Dual Diagnosis, 9(2-3), 74-84.
doi:10.1108/Add-02-2016-0006
Daughters, Magidson, Schuster, & Safren. (2010). ACT HEALTHY: A Combined Cognitive-Behavioral Depression and Medication Adherence Treatment for HIV-Infected Substance Users. Cogn Behav Pract, 17(3), 309-321.
Desimone, Harms, & Desimone. (2015). Best practice recommendations for data screening. Journal of Organizational Behavior, 36(2), 171-181. doi:10.1002/job.1962
Dickson, Ciesla, & Reilly. (2012). Rumination, Worry, Cognitive Avoidance, and Behavioral Avoidance: Examination of Temporal Effects. Behavior Therapy, 43(3), 629-640. Dimidjian, Hollon, Dobson, Schmaling, Kohlenberg, Addis, . . . Jacobson. (2006).
Randomized trial of behavioral activation, cognitive therapy, and antidepressant medication in the acute treatment of adults with major depression. Journal of Consulting and Clinical Psychology, 74(4), 658-670. doi:10.1037/0022-006x.74.4.658