Nicholas W. Sterling, MS
Ming Wang, PhD
Lijun Zhang, PhD
Eun-Young Lee, PhD
Guangwei Du, PhD
Mechelle M. Lewis, PhD
Martin Styner, PhD
Xuemei Huang, PhD
Correspondence to Dr. Huang: [email protected]
Supplemental data at Neurology.org
Stage-dependent loss of cortical
gyrification as Parkinson disease
“
unfolds
”
ABSTRACT
Objective:
Nigrostriatal terminal losses are known to progress most rapidly in early-stage
Parkin-son disease (PD) and then plateau, whereas cortical pathology continues and may provide a better
marker of PD progression in later stages. We investigated cortical gyrification indices in patients
with different durations of PD, since cortical folding may capture complex processes involving
transverse forces of neuronal sheets or underlying axonal connectivity.
Methods:
Longitudinal cohort structural MRI were obtained at baseline, 18 months, and 36
months from 70 patients with PD without dementia and 70 control participants. Cortical local
gyrification index (LGI) was compared between controls and PD subgroups based upon duration
of illness (DOI,
,
1 year [PDE, n
5
17], 1
–
5 years [PDM, n
5
19],
.
5 years [PDL, n
5
24]) and
adjusted using false discovery rate. Associations between LGI and clinical measurements were
assessed using multiple linear regression. Areas having significantly reduced LGI also were
ana-lyzed using baseline data from a newly established cohort (PD n
5
87, control n
5
66) to validate
our findings.
Results:
In the longitudinal cohort, PDL
had significantly reduced overall gyrification, and
bilater-ally in the inferior parietal, postcentral, precentral, superior frontal, and supramarginal areas,
compared to controls (
p
,
0.05). Longitudinally, loss of gyrification was accelerated in PDM
participants, compared to controls. LGI showed robust correlations with DOI and also was
cor-related with PD-cor-related clinical measurements. Similar results were obtained in the validation
sample.
Conclusions:
Loss of cortical gyrification may be accelerated within the first few years after PD
diagnosis, and become particularly prominent in later stages. Thus, it may provide a metric for
monitoring progression in vivo.
Neurology®2016;86:1143–1151GLOSSARY
DOI5duration of illness;H&Y5Hoehn & Yahr;HAM5Hamilton Depression Rating Scale;ICV5intracranial volume; LEDD5levodopa-equivalent daily dose;LGI5local gyrification index;MMSE5Mini-Mental State Examination;PD5
Parkinson disease;PDE 5 Parkinson disease–early; PDM5 Parkinson disease–middle;PDL5 Parkinson disease–late; UPDRS5Unified Parkinson’s Disease Rating Scale.
In Parkinson disease (PD), degeneration of dopamine terminals is thought to progress rapidly
within the first few years after diagnosis and then plateau.
1Thus, in more advanced stages of
disease, non-nigrostriatal brain changes may serve as better markers of PD progression. Evidence
suggests that widespread pathologic changes occur in the cortex, including apoptotic signaling,
Lewy pathology, reduction in other neurotransmitters, and interneuron loss.
2–4It is unclear,
however, how cell death relates to the pattern of cortical Lewy pathology, and whether cortical
changes can be used to gauge PD progression.
5Lewy pathology has been documented in specific cortical layers (i.e., preferentially in deep
layers of high-order sensory association areas).
5,6Some previous imaging studies have
demon-strated decreased cortical thickness in PD,
7,8but reported results have been inconsistent and
have not shown robust associations with disease progression in the absence of dementia. These
From the Departments of Neurology (N.W.S., L.Z., E.-Y.L., G.D., M.M.L., X.H.), Public Health Sciences (M.W.), Pharmacology (M.M.L., X.H.), Radiology (X.H.), Neurosurgery (X.H.), and Kinesiology (X.H.), Pennsylvania State University–Milton S. Hershey Medical Center; and Departments of Computer Science and Psychiatry (M.S.), University of North Carolina, Chapel Hill.
inconsistencies may be attributable to several
factors. First, cortical thickness may be less
sensitive in areas where cortex pathology is
not transmural. Second, thickness
measure-ments may not reflect more complex changes
of cortex surface architecture.
9Thus, the
dis-tinction between structural metrics is
impor-tant because they may reflect different aspects
of cortical neurodegeneration. In the current
study, we aimed to characterize changes in
cor-tical gyrification during PD progression by
studying participants with different durations
of illness. We hypothesized that reductions in
gyrification would follow the spatiotemporal
distribution described in studies of Lewy
pathology.
5,6METHODS Longitudinal cohort participants. Patients with PD (n570) and controls (n570) with a Mini-Mental State Examination (MMSE) score$26 were selected from a large cohort study based on matching for baseline age distribution, sex ratio, and number of follow-up visits (table 1).10,11Patients with
PD were recruited from a tertiary movement disorders clinic, and controls from spouses and the local community. PD diagnosis was confirmed according to published criteria.12All participants
were free of major and acute medical issues or neurologic disorders other than PD. All brain images were inspected and deemed free of any major structural abnormalities. Hamilton Depression Rating Scale (HAM)13scores were obtained at each
visit. PD subgroups were assigned for comparisons to controls based upon duration of illness (DOI), defined as the number of years since diagnosis in the same fashion that we had done previously (PD–early [PDE] [,1 year], PD–middle [PDM] [1–5 years], PD–late [PDL] [.5 years]).14
Validation study participants.A validation study was con-ducted using the baseline data from a newly established cohort under the NIH PD Biomarkers Program (NCT01888185).15
Participants were recruited in a similar manner as the longitudinal cohort participants, except there were more advanced-stage patients. The original population of validation participants included 104 patients with PD and 71 controls. Participants having signs of dementia were excluded using the MMSE score cutoff described above.
Standard protocol approvals, registrations, and patient consents.Written informed consent was obtained for all partic-ipants, in accordance with the Declaration of Helsinki. The research study protocol was approved by the Penn State Hershey Institutional Review Board.
Clinical evaluation.Unified Parkinson’s Disease Rating Scale (UPDRS) motor scores and Hoehn & Yahr (H&Y) stages were obtained for PD in the“on”medication state at each visit. Lon-gitudinal cohort UPDRS motor scores were recorded using the original UPDRS.16Validation study UPDRS motor scores were
recorded using the revised UPDRS.17Levodopa-equivalent daily
dose (LEDD) was calculated according to published criteria.18
MRI data acquisition and analysis. All participants were scanned using a 3.0T MRI scanner (Trio, Siemens Magnetom, Erlangen, Germany, with an 8-channel phased array head coil)
at baseline, 18 months, and 36 months. A magnetization-prepared rapid acquisition gradient echo sequence was used to obtain T1-weighted images with repetition time/echo time5 1,540/2.34, field of view52563256 mm, matrix52563 256, slice thickness51 mm (with no gap), slice number5176. T1-weighted images were processed automatically using Free-Surfer (version 5.1.0).19The longitudinal pipeline was utilized to
process longitudinal cohort images by first creating unbiased within-subject templates. The within-within-subject templates were then used to initialize image processing (skull stripping, Talairach transforms, atlas registration, spherical surface maps) for scans at each visit.20,21
Local gyrification index (LGI) was used as a measurement of cortical folding. Historically, LGI was defined as the ratio of cor-tical surface over the outer contour (perimeter) of a 2D brain sec-tion.22LGI offers a method to quantify gyrification as it varies
across the surface of a 3D cortical mesh (;150,000 vertices).23
For each vertex vi, a circular region of interest was defined on the mesh surface having radius 25 mm and center vertex vi. Outer and pial surface areas (AO, AP) were computed as the sum of surface areas assigned to vertices that fell within the region of interest. LGI was defined as the ratio of AP/AO. The final com-putation of LGI at each vertex was calculated by inverse weighting based upon distance. Thus, the LGI computed for each vertex vi contains information from both the center vertex viand vertices that are nearby. However, this is to be expected, since gyrification is aimed to represent the combined structural properties of neigh-boring gyri and the sulci between them.23
Statistical analysis.Sex and age were compared between pa-tients with PD and controls using Fisher exact test and 2-sample Student t test, respectively. Analysis of variance was used to assess differences among PD subgroups or controls. We performed longitudinal analyses of cortical structure at the vertex level using a validated framework (spatiotemporal linear mixed effects model) that leverages covariance among neighboring vertices and can yield increases in statistical power while providing good control of false-positive rate.24Briefly, each hemisphere was
divided into;30,000 regions of homogenous covariance from
;150,000 vertices. Fast expectation maximization iterations were applied to obtain more accurate parameter estimates, which were averaged within each region.25 Hypothesis testing utilized the
Satterthwaite-based approximation of a scaled F statistic.pValues were adjusted using an expected false discovery rate of 0.05.26,27
The final mixed effects model used for group comparisons included the following: linear and quadratic terms of age at baseline, sex, years elapsed since baseline, years of education, HAM at each visit, intracranial volume (ICV), the terms for PD stages, the respec-tive interaction terms for PD stages and years elapsed, the term for interaction between age at baseline and years elapsed, and the term for interaction between sex and years elapsed. ICV was included as a covariate because it was associated with overall LGI (p,0.0001). General linear hypothesis testing using the F statistic was uti-lized to conduct group and subgroup comparisons.28Overall LGI
was defined as the average of LGI across all cortical vertices. Regional and overall gyrification indices were analyzed using R version 3.1.1.29
The relationships between clinical measurements and cortical structural measures among PD participants at baseline were as-sessed (1) descriptively using locally weighted regression and 95% bootstrapped confidence regions and (2) quantitatively using multiple linear regression for each variable of interest inde-pendently (covariates included age, sex, education years, ICV, and HAM as appropriate).
longitudinal cohort. For this analysis, we utilized the bilateral regional means of LGI for the respective cortical areas. The general linear model was used to conduct these validation analyses and included the following variables: linear and quadratic terms of age at baseline, sex, years of education, HAM, ICV, and the terms for PD stages. Outliers having extremely low gyrification values (2 standard deviations,sample mean) were excluded from the study (1 control, 2 PDM, 2 PDLin the validation sample).
RESULTS Demographic characteristics of study participants.
In the longitudinal cohort, patients with
PD and controls were not significantly different in
age or sex frequencies at any visit (table 1). Controls
had more years of education than patients with PD,
but education did not correlate with any cortical metrics
in either the patients with PD or controls. From the
baseline visit, the 18-month dropout rate was 20.0%
and 17.1% for patients with PD and controls,
respectively, and 14.3% and 10.3%, respectively, from
18 to 36 months. The total number of visits did not
differ between patients with PD and controls (p
5
0.210). The demographic characteristics of those who
dropped out did not differ between patients with PD
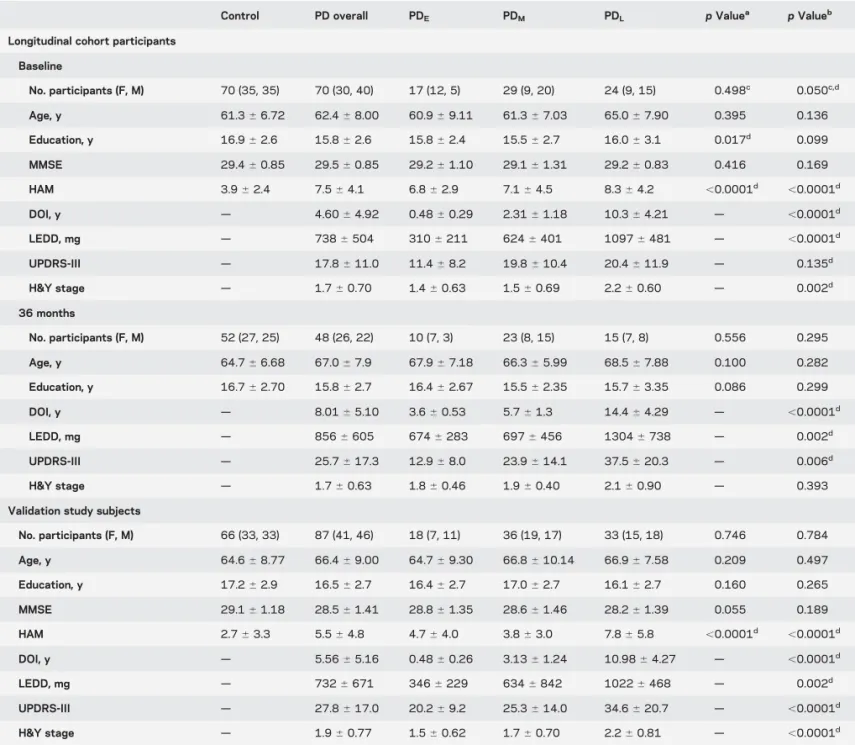
Table 1 Demographic and clinical properties of study participantsControl PD overall PDE PDM PDL pValuea pValueb
Longitudinal cohort participants
Baseline
No. participants (F, M) 70 (35, 35) 70 (30, 40) 17 (12, 5) 29 (9, 20) 24 (9, 15) 0.498c 0.050c,d
Age, y 61.366.72 62.468.00 60.969.11 61.367.03 65.067.90 0.395 0.136
Education, y 16.962.6 15.862.6 15.862.4 15.562.7 16.063.1 0.017d 0.099
MMSE 29.460.85 29.560.85 29.261.10 29.161.31 29.260.83 0.416 0.169
HAM 3.962.4 7.564.1 6.862.9 7.164.5 8.364.2 ,0.0001d ,0.0001d
DOI, y — 4.6064.92 0.4860.29 2.3161.18 10.364.21 — ,0.0001d
LEDD, mg — 7386504 3106211 6246401 10976481 — ,0.0001d
UPDRS-III — 17.8611.0 11.468.2 19.8610.4 20.4611.9 — 0.135d H&Y stage — 1.760.70 1.460.63 1.560.69 2.260.60 — 0.002d 36 months
No. participants (F, M) 52 (27, 25) 48 (26, 22) 10 (7, 3) 23 (8, 15) 15 (7, 8) 0.556 0.295
Age, y 64.766.68 67.067.9 67.967.18 66.365.99 68.567.88 0.100 0.282
Education, y 16.762.70 15.862.7 16.462.67 15.562.35 15.763.35 0.086 0.299
DOI, y — 8.0165.10 3.660.53 5.761.3 14.464.29 — ,0.0001d
LEDD, mg — 8566605 6746283 6976456 13046738 — 0.002d
UPDRS-III — 25.7617.3 12.968.0 23.9614.1 37.5620.3 — 0.006d H&Y stage — 1.760.63 1.860.46 1.960.40 2.160.90 — 0.393 Validation study subjects
No. participants (F, M) 66 (33, 33) 87 (41, 46) 18 (7, 11) 36 (19, 17) 33 (15, 18) 0.746 0.784
Age, y 64.668.77 66.469.00 64.769.30 66.8610.14 66.967.58 0.209 0.497
Education, y 17.262.9 16.562.7 16.462.7 17.062.7 16.162.7 0.160 0.265
MMSE 29.161.18 28.561.41 28.861.35 28.661.46 28.261.39 0.055 0.189
HAM 2.763.3 5.564.8 4.764.0 3.863.0 7.865.8 ,0.0001d ,0.0001d
DOI, y — 5.5665.16 0.4860.26 3.1361.24 10.9864.27 — ,0.0001d
LEDD, mg — 7326671 3466229 6346842 10226468 — 0.002d
UPDRS-III — 27.8617.0 20.269.2 25.3614.0 34.6620.7 — ,0.0001d H&Y stage — 1.960.77 1.560.62 1.760.70 2.260.81 — ,0.0001d
Abbreviations: DOI5duration of illness; H&Y5Hoehn & Yahr; HAM5Hamilton Depression Scale; LEDD5levodopa daily equivalent dosage; MMSE5
Mini-Mental State Examination; PD5Parkinson disease; PDE5Parkinson disease–early; PDM5Parkinson disease–middle; PDL5Parkinson disease–late;
UPDRS5Unified Parkinson’s Disease Rating Scale.
Measurements presented as mean6SD unless otherwise indicated.
a
pValues for comparisons between all PD and control participants using 2-samplettests.
b
pValues of analysis of variance across PD subgroups (and controls as appropriate).
c
pValues obtained using Fisher exact test.
and controls. Patients with PD demonstrated the
expected progression of symptoms as reflected by
increased UPDRS-III scores and LEDD. Patients with
PD had increased depression scores compared to
controls (p
,
0.0001). Among patients with PD,
disease stage and DOI were significantly associated
with depression scores at all visits (p
,
0.0001).
In the validation study sample, PD subgroups and
controls were relatively similar in age, sex frequencies,
and education, but patients with PD had trend-level
lower MMSE scores compared to controls (p
5
0.055).
Longitudinal cohort analysis of cortical gyrification.
We
first investigated LGI differences between patients with
PD and controls using vertex-level analyses. Compared
to controls, patients with PD overall had reduced LGI
in the left inferior parietal, superior frontal, frontal pole,
and rostral anterior cingulate, and the right inferior
parietal, precentral, rostral middle frontal, and
fusiform areas (p
,
0.05). There were no significant
differences in LGI between completed PD participants
and PD participants lost to follow-up (p
$
0.20).
At baseline and 36-month visits, LGI was not
sig-nificantly reduced in any region in PD
Eor PD
Msub-groups vs controls. There were substantial differences
in LGI between PD
Land controls, however, at baseline
bilaterally in overall LGI, inferior parietal, postcentral,
precentral, superior frontal, and supramarginal areas
(p
,
0.05) (figure 1, table 2). At the 36-month visit,
these bilateral differences persisted and also extended to
include bilaterally the transverse temporal, fusiform,
inferior temporal, and pars orbitalis regions (p
,
0.05). Comparisons of LGI between PD
Land controls
at the 18-month visit revealed patterns of reduced LGI
that were intermediate between baseline and
36-month visits. Figure e-1 on the
Neurology
®Web site
at Neurology.org depicts the longitudinal trajectories
of LGI in cortical regions where LGI was significantly
reduced in PD
L.
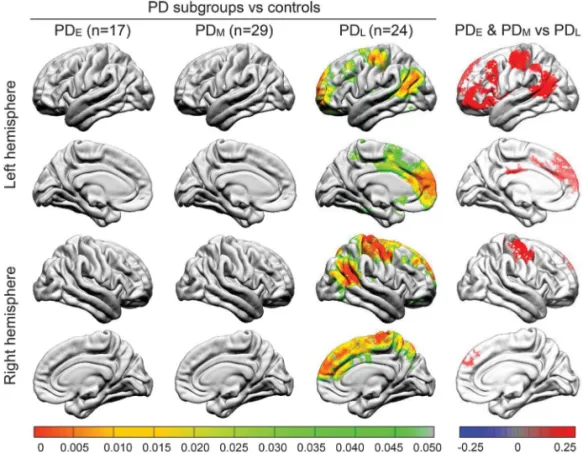
We next compared LGI among PD subgroups
(fig-ure 1). PD
Lhad reduced LGI at baseline in the
pre-central, postpre-central, and superior frontal areas
bilaterally; the left inferior parietal, pars orbitalis,
supe-rior temporal banks, lateral orbitofrontal, and rostral
middle frontal; and right caudal middle frontal areas
compared to combined PD
Eand PD
Msubgroups (p
,
0.05). At the 36-month visit, there were significant
differences in LGI between PD
E/PD
Mand PD
Lin
the right precentral and postcentral areas (p
,
0.05).
Figure 1 Comparison of local gyrification index between Parkinson disease (PD) subgroups and controls (left)and among PD subgroups (right) at baseline
PD–late (PDL) participants (duration of illness.5 years) demonstrated significantly reduced gyrification bilaterally in the
inferior parietal, precentral and postcentral, and superior frontal areas, compared to controls at baseline visit (left). PD subgroup vs control color maps represent adjustedpvalues using an expected false discovery rate of 0.05. PDL
partic-ipants demonstrated significantly reduced gyrification in several neocortical areas, compared to PD–early (PDE) and
Longitudinal analysis revealed accelerated overall
LGI loss in the PD
Msubgroup (p
,
0.001) and
non-significant accelerated loss in PD
E(p
5
0.056)
com-pared to controls. Loss of LGI also was accelerated in
the postcentral, precentral, superior frontal, and
supramarginal areas among PD
M(p
,
0.05)
com-pared to controls, and nonsignificant accelerated loss
was present in the inferior parietal area (p
5
0.055)
(table 2).
Several clinical measurements were correlated with
LGI. DOI was correlated negatively with overall LGI
and regional LGI of the postcentral, precentral,
supe-rior frontal, and supramarginal areas (p
,
0.05).
LEDD was correlated negatively with LGI in all of
the aforementioned areas and UPDRS showed
corre-lations with LGI of the inferior parietal area (p
5
0.026) (figure 2).
Validation study sample analysis of cortical gyrification.
For the validation study, we utilized bilateral averages
of LGI in regions that were shown to be reduced
bilat-erally in the longitudinal cohort study. Compared to
controls, PD
Ldemonstrated significantly lower overall
LGI and in the inferior parietal, postcentral, precentral,
and superior frontal areas (p
,
0.05), although the
LGI differences in the supramarginal area did not reach
statistical significance (p
5
0.054) (table 2).
DOI was correlated with overall LGI and regional
LGI of the postcentral, precentral, superior frontal,
and supramarginal areas (p
,
0.05), and the
correla-tion for the inferior parietal area did not reach
statis-tical significance (p
5
0.052) (figure 3). UPDRS-III
scores were correlated negatively with overall LGI,
and with regional LGI of the inferior parietal,
post-central, prepost-central, superior frontal, and
supramar-ginal areas (p
,
0.05).
DISCUSSION
This study demonstrated that reduced
cortical gyrification is related to disease progression in
participants with PD without dementia. Losses of
gyr-ification were accelerated early after diagnosis, and
became prominent in later stages of disease, suggesting
that measurements of cortical folding may be useful for
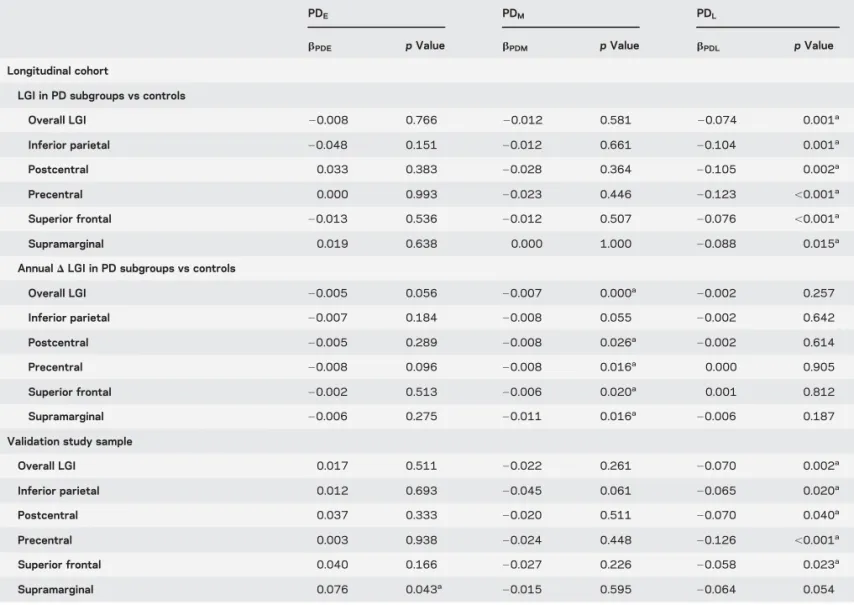
Table 2 Comparisons of regional local gyrification index among PD subgroups and controlsPDE PDM PDL
bPDE pValue bPDM pValue bPDL pValue
Longitudinal cohort
LGI in PD subgroups vs controls
Overall LGI 20.008 0.766 20.012 0.581 20.074 0.001a
Inferior parietal 20.048 0.151 20.012 0.661 20.104 0.001a
Postcentral 0.033 0.383 20.028 0.364 20.105 0.002a
Precentral 0.000 0.993 20.023 0.446 20.123 ,0.001a
Superior frontal 20.013 0.536 20.012 0.507 20.076 ,0.001a
Supramarginal 0.019 0.638 0.000 1.000 20.088 0.015a
AnnualDLGI in PD subgroups vs controls
Overall LGI 20.005 0.056 20.007 0.000a 20.002 0.257
Inferior parietal 20.007 0.184 20.008 0.055 20.002 0.642
Postcentral 20.005 0.289 20.008 0.026a 20.002 0.614
Precentral 20.008 0.096 20.008 0.016a 0.000 0.905
Superior frontal 20.002 0.513 20.006 0.020a 0.001 0.812
Supramarginal 20.006 0.275 20.011 0.016a 20.006 0.187
Validation study sample
Overall LGI 0.017 0.511 20.022 0.261 20.070 0.002a
Inferior parietal 0.012 0.693 20.045 0.061 20.065 0.020a
Postcentral 0.037 0.333 20.020 0.511 20.070 0.040a
Precentral 0.003 0.938 20.024 0.448 20.126 ,0.001a
Superior frontal 0.040 0.166 20.027 0.226 20.058 0.023a
Supramarginal 0.076 0.043a 20.015 0.595 20.064 0.054
Abbreviations: LGI5local gyrification index; PD5Parkinson disease; PDE5Parkinson disease–early; PDM5Parkinson disease–middle; PDL5Parkinson
disease–late.
monitoring disease progression. Interestingly, we
found that the loss of gyrification was particularly
prominent in the neocortical regions that are thought
to be relatively spared from Lewy pathology in
PD.
5,30In contrast, we did not observe altered
gyrifi-cation in areas known to be more heavily affected by
Lewy pathology (i.e., brain base and temporal areas).
Taken together, these findings raise the possibility that
cortical folding abnormalities may reflect pathologic
processes not attributable solely to Lewy pathology.
Although recent data provided initial evidence that
gyrification of the cortex is reduced in PD (average
DOI
;
3.9 years),
31the association between cortical
folding and disease progression remained unclear.
Indeed, another recent study reported no differences
between patients with PD and controls, although there
were some areas of correlation between a composite
measure of disease progression that included dementia
in PD and cortical gyrification of the left middle
fron-tal, superior pariefron-tal, superior fronfron-tal, supramarginal,
lateral occipital, inferior parietal, and right superior
frontal and superior parietal areas.
8Whereas these
find-ings may have been attributable to the inclusion of
dementia (mean MMSE
5
18.3 in the PD dementia
group), our study excluded dementia at baseline.
Par-ticipants with PD
Eor PD
Mdid not have reduced
gyr-ification at baseline, but demonstrated accelerated loss
of gyrification longitudinally. PD
Lhad prominently
reduced gyrification bilaterally in several cortical areas
despite the lack of dementia (MMSE
;
28–29).
Dis-ease duration, LEDD, and motor scores also were
asso-ciated with reduced overall LGI in PD. Together, these
findings suggest that accelerated loss of cortical folding
occurs shortly after PD diagnosis and may be
associ-ated with disease progression prior to the occurrence of
dementia. Accordingly, metrics of cortical folding may
provide sensitive measurements to gauge ongoing
cor-tical neurodegeneration as PD progresses.
Previous studies have reported findings of
wide-spread cortical pathology in PD, including reduced
lev-els of neurotransmitters and tyrosine hydroxylase
immunoreactive interneurons,
3,4increased apoptotic
signaling,
2and Lewy pathology.
5Neocortical areas,
however, have been shown to be relatively spared from
Lewy pathology.
5The current study demonstrated that
the loss of gyrification is especially prominent in the
precentral and postcentral areas in PD, suggesting that
cortical gyrification might not reflect Lewy pathology
Figure 2 Relationships of baseline regional local gyrification index and clinical measurements among Parkinson disease (PD) participants inthe longitudinal cohort
directly as we hypothesized. These differences may be
explained by several possibilities. First, Lewy pathology
may not be correlated with cell death equally
through-out all cortical regions. Second, Lewy pathology is
known to occur in distinct cortical layers in PD,
pref-erentially in deeper layers in the neocortical areas and
in superficial layers of the mesocortex.
5This
differen-tial pattern of pathology may contribute to the
gyrifi-cation losses observed in this study. Few details,
however, are available regarding the exact
layer-specific pattern of Lewy pathology, warranting further
investigation.
5Third, changes in underlying white
matter could result in altered cortical folding.
32To understand the stage-dependent changes of
gyrification in PD, we subdivided PD patients into
3 subgroups as we have done previously.
33The PD
E
upper limit of DOI (1 year) was chosen to define PD
participants who had not received extended
treat-ment. PD
Lwas defined as PD participants having
at least 5 years of disease duration for several reasons.
For example, nigrostriatal terminal labeling has been
suggested to reach a floor after approximately 5 years,
1although some data suggest that nigral cell death
continues,
34and dopamine levels certainly decline
throughout disease progression.
35Clinically,
dyskine-sias, cognitive decline, and dopamine-nonresponsive
symptoms tend to be more prominent after the first 5
years (honeymoon phase).
36,37These subgroup
cate-gorizations provided balanced subgroup sample sizes
that are powerful for equivalence testing.
1,38,39Inter-estingly, the LGI continued to decline after 5 years
(figure e-2). We also repeated our analyses using
H&Y stage, with similar results (table e-1). There
were also inverse correlations between gyrification
indices and clinical measurements (LEDD and
UPDRS-III, figures 2 and 3). Together, our results
support the notion that gyrification is
stage-dependent and associated with PD progression.
The current study had several limitations.
Although the overall sample size is large, the sample
size for PD subgroup analysis was relatively small.
Larger sample sizes and longer follow-up of various
disease staging categories will be needed to generalize
these findings. In addition, as is common in
longitu-dinal studies, there was significant dropout in both
the PD and control groups. The total number of
Figure 3 Relationships of regional local gyrification index and clinical measurements among Parkinson disease (PD) participants in thevalidation study sample
visits, however, did not differ between these groups.
There also may be considerable variability in clinical
severity and disease duration.
40However, we repeated
all of our analyses using H&Y staging and found
similar results (figure e-1).
The PD
Lgroup also had a relatively high
male-to-female ratio. Most relationships between LGI and
disease duration persisted when male and female
par-ticipants with PD were analyzed separately (table
e-1). Although the
p
values in table e-1 may give
the impression of discordant results among female
participants, the directions of the correlations were
the same for all regions regardless of sex or cohort.
Furthermore, we found no significant differences in
overall, inferior parietal, postcentral, precentral,
supe-rior frontal, or supramarginal LGI between male and
female controls, and sex had no effect on the rate of
LGI change in controls. Nevertheless, to minimize
any potential confounding effect, we included sex
in our statistical model. We also utilized
“on”
medi-cation motor scores because some participants could
not tolerate
“off”
medication assessment. Of note, the
scores obtained in the practically defined
“off”
med-ication state may not represent true
“
off
”
medication
symptoms, since some drugs may not completely
wash out.
“
On
”
medication scores may be more
rep-resentative of the levodopa-unresponsive components
of patient symptoms, which may be more closely
related to cortical findings. Finally, the study was
val-idated using the baseline data from another newly
established cohort, and the longitudinal data are not
yet available. Although the Parkinson
’
s Progression
Markers Initiative has longitudinal data, this cohort
only includes PD participants in very early stages.
Independent validation of longitudinal trajectories
in advanced stage PD is needed.
This study demonstrated that cortical gyrification
is reduced among participants with PD without
dementia, and is associated with measurements of
PD progression. Loss of cortical gyrification may be
accelerated shortly after PD diagnosis and becomes
prominent in later stages. These findings suggest that
folding metrics may be informative for quantifying
cortical changes throughout PD progression.
More-over, the finding of reduced gyrification in areas
known to be spared from Lewy pathology is
unex-pected, raising the possibility that cortical folding
abnormalities reflect processes not attributable solely
to Lewy pathology in PD.
AUTHOR CONTRIBUTIONS
Nicholas W. Sterling: research project conception, research project orga-nization, research project execution, statistical analysis design, statistical analysis execution, statistical analysis review and critique, writing of first draft, manuscript review and critique. Ming Wang: research project con-ception, research project execution, statistical analysis design, statistical analysis execution, statistical analysis review and critique, manuscript
review and critique. Lijun Zhang: research project conception, research project organization, research project execution, statistical analysis review and critique, manuscript review and critique. Eun-Young Lee: research project conception, manuscript review and critique. Guangwei Du: research project conception, research project organization, research project execution, statistical analysis design, statistical analysis review and critique, manuscript review and critique. Mechelle M. Lewis: research project conception, research project organization, research pro-ject execution, statistical analysis review and critique, writing of first draft, manuscript review and critique. Martin Styner: statistical analysis review and critique, manuscript review and critique. Xuemei Huang: research project conception, research project organization, research project execu-tion, statistical analysis review and critique, writing of first draft, manu-script review and critique.
ACKNOWLEDGMENT
The authors thank the participants; Jeffery Vesek for MRI technical sup-port; and study coordinators Eleanore Hernandez, Brittany Jones, Melissa Santos, and Raghda Clayiff for assistance.
STUDY FUNDING
Supported by NINDS (NS060722 and NS082151 to X.H.), the Her-shey Medical Center GCRC (NIH M01RR10732), GCRC Construction Grant (C06RR016499), and Pennsylvania Department of Health Tobacco CURE Funds.
DISCLOSURE
The authors report no disclosures relevant to the manuscript. Go to Neurology.org for full disclosures.
Received June 21, 2015. Accepted in final form October 15, 2015.
REFERENCES
1. Maetzler W, Liepelt I, Berg D. Progression of Parkinson’s disease in the clinical phase: potential markers. Lancet Neurol 2009;8:1158–1171.
2. Jiang H, He P, Adler CH, et al. Bid signal pathway com-ponents are identified in the temporal cortex with Parkin-son disease. Neurology 2012;79:1767–1773.
3. Fukuda T, Takahashi J, Tanaka J. Tyrosine hydroxylase-immunoreactive neurons are decreased in number in the cerebral cortex of Parkinson’s disease. Neuropathology 1999;19:10–13.
4. Scatton B, Javoy-Agid F, Rouquier L, Dubois B, Agid Y. Reduction of cortical dopamine, noradrenaline, serotonin and their metabolites in Parkinson’s disease. Brain Res 1983;275:321–328.
5. Braak H, Del Tredici K, Rub U, de Vos RA, Jansen Steur EN, Braak E. Staging of brain pathology related to sporadic Parkinson’s disease. Neurobiol Aging 2003;24: 197–211.
6. Orimo S, Uchihara T, Kanazawa T, et al. Unmyelinated axons are more vulnerable to degeneration than myeli-nated axons of the cardiac nerve in Parkinson’s disease. Neuropathol Appl Neurobiol 2011;37:791–802. 7. Pagonabarraga J, Corcuera-Solano I, Vives-Gilabert Y,
et al. Pattern of regional cortical thinning associated with cognitive deterioration in Parkinson’s disease. PLoS One 2013;8:e54980.
8. Zarei M, Ibarretxe-Bilbao N, Compta Y, et al. Cortical thinning is associated with disease stages and dementia in Parkinson’s disease. J Neurol Neurosurg Psychiatry 2013;84:875–881.
10. Dubois B, Burn D, Goetz C, et al. Diagnostic procedures for Parkinson’s disease dementia: recommendations from the movement disorder society task force. Mov Disord 2007;22:2314–2324.
11. Goetz CG, Emre M, Dubois B. Parkinson’s disease dementia: definitions, guidelines, and research perspectives in diagnosis. Ann Neurol 2008;64(suppl 2):S81–S92. 12. Hughes AJ, Ben-Shlomo Y, Daniel SE, Lees AJ. What
features improve the accuracy of clinical diagnosis in Par-kinson’s disease: a clinicopathologic study. Neurology 1992;42:1142–1146.
13. Hamilton M. A rating scale for depression. J Neurol Neu-rosurg Psychiatry 1960;23:56–62.
14. Hoehn MM, Yahr MD. Parkinsonism: onset, progression and mortality. Neurology 1967;17:427–442.
15. Ofori E, Du G, Babcock D, Huang X, Vaillancourt DE. Parkinson’s disease biomarkers program brain imaging repository. Neuroimage 2015;124:1120–1124. 16. Fahn S, Elton R. Unified Parkinson’s disease rating scale.
In: Fahn S, Jenner P, Marsden CD, Goldstein M, Calne DB, eds. Recent Developments in Parkinson’s Dis-ease. Florham Park, NJ: Macmillan Healthcare Informa-tion; 1986.
17. Goetz CG, Tilley BC, Shaftman SR, et al. Movement Disorder Society-sponsored revision of the Unified Parkin-son’s Disease Rating Scale (MDS-UPDRS): scale presen-tation and clinimetric testing results. Mov Disord 2008; 23:2129–2170.
18. Tomlinson CL, Stowe R, Patel S, Rick C, Gray R, Clarke CE. Systematic review of levodopa dose equiva-lency reporting in Parkinson’s disease. Mov Disord 2010;25:2649–2653.
19. Bernal-Rusiel JL, Greve DN, Reuter M, Fischl B, Sabuncu MR; for the Alzheimer’s Disease Neuroimaging Initiative. Statistical analysis of longitudinal neuroimage data with linear mixed effects models. Neuroimage 2012;66C: 249–260.
20. Reuter M, Fischl B. Avoiding asymmetry-induced bias in longitudinal image processing. Neuroimage 2011;57:19–21. 21. Fischl B, Dale AM. Measuring the thickness of the human cerebral cortex from magnetic resonance images. Proc Natl Acad Sci USA 2000;97:11050–11055.
22. Zilles K, Armstrong E, Schleicher A, Kretschmann HJ. The human pattern of gyrification in the cerebral cortex. Anat Embryol 1988;179:173–179.
23. Schaer M, Cuadra MB, Tamarit L, Lazeyras F, Eliez S, Thiran JP. A surface-based approach to quantify local cortical gyrification. IEEE Trans Med Imaging 2008;27: 161–170.
24. Bernal-Rusiel JL, Reuter M, Greve DN, Fischl B, Sabuncu MR; Alzheimer’s Disease Neuroimaging Initia-tive. Spatiotemporal linear mixed effects modeling for the mass-univariate analysis of longitudinal neuroimage data. Neuroimage 2013;81:358–370.
25. Laird N, Lange N, Stram D. Maximum likelihood com-putations with repeated measures: application of the EM algorithm. J Am Stat Assoc 1987;82:97–105.
26. Kenward MG, Roger JH. Small sample inference for fixed effects from restricted maximum likelihood. Biometrics 1997;53:983–997.
27. Benjamini Y, Hochberg Y. Controlling the false discovery rate: a practical and powerful approach to multiple testing. J R Stat Soc Ser B 1995;57:289–300.
28. Singer JD, Willett JB. Applied Longitudinal Data Analy-sis: Modeling Change and Event Occurrence. New York: Oxford University Press; 2003.
29. R Core Team. R: A Language and Environment for Sta-tistical Computing. Vienna, Austria: R Foundation for Statistical Computing; 2014. Available at: http://www. R-project.org/. Accessed August 2014.
30. Braak H, Rub U, Schultz C, Del Tredici K. Vulnerability of cortical neurons to Alzheimer’s and Parkinson’s diseases. J Alzheimers Dis 2006;9:35–44.
31. Zhang Y, Zhang J, Xu J, et al. Cortical gyrification reduc-tions and subcortical atrophy in Parkinson’s disease. Mov Disord 2014;29:122–126.
32. Tallinen T, Chung JY, Biggins JS, Mahadevan L. Gyrifi-cation from constrained cortical expansion. Proc Natl Acad Sci USA 2014;111:12667–12672.
33. Du G, Lewis MM, Sen S, et al. Imaging nigral pathology and clinical progression in Parkinson’s disease. Mov Dis-ord 2012;27:1636–1643.
34. Perlmutter JS, Norris SA. Neuroimaging biomarkers for Parkinson disease: facts and fantasy. Ann Neurol 2014;76: 769–783.
35. Bernheimer H, Birkmayer W, Hornykiewicz O, Jellinger K, Seitelberger F. Brain dopamine and the syn-dromes of Parkinson and Huntington: clinical, morpho-logical and neurochemical correlations. J Neurol Sci 1973; 20:415–455.
36. Rascol O, Payoux P, Ory F, Ferreira JJ, Brefel-Courbon C, Montastruc JL. Limitations of current Parkinson’s disease therapy. Ann Neurol 2003;53(suppl 3):S3–S12; discussion S12–S15.
37. Pfeiffer RF, Wszolek ZK, Ebadi M. Parkinson’s Disease, 2nd ed. Philadelphia: Taylor & Francis; 2012.
38. Lee CS, Schulzer M, de la Fuente-Fernandez R, et al. Lack of regional selectivity during the progression of Parkinson disease: implications for pathogenesis. Arch Neurol 2004; 61:1920–1925.
39. Lee CS, Schulzer M, Mak EK, et al. Clinical observations on the rate of progression of idiopathic parkinsonism. Brain 1994;117:501–507.