arXiv:1705.00124v1 [astro-ph.GA] 29 Apr 2017
Radio and optical intra-day variability observations of five
blazars
X. Liu
1,2⋆, P.P. Yang
1.3, J. Liu
1,2, B.R. Liu
4, S.M. Hu
5, O.M. Kurtanidze
6,7,8, S. Zola
9,10,
A. Kraus
11, T.P. Krichbaum
11, R.Z. Su
1.3, K. Gazeas
12, K. Sadakane
13, K. Nilson
14,
D.E. Reichart
15, M. Kidger
16, K. Matsumoto
13, S. Okano
17,
M. Siwak
10, J.R. Webb
18, T. Pursimo
19, F. Garcia
20, R. Naves Nogues
21,
A. Erdem
22,23, F. Alicavus
22,23, T. Balonek
24, S.G. Jorstad
251 Xinjiang Astronomical Observatory, Chinese Academy of Sciences, 150 Science 1-Street, Urumqi 830011, China 2 Key Laboratory of Radio Astronomy, Chinese Academy of Sciences, Nanjing 210008, China
3 Graduate University of Chinese Academy of Sciences, Beijing 100049, China
4 Guangxi Key Laboratory for Relativistic Astrophysics, Guangxi University, Nanning, Guangxi 530004, China
5 Shandong Provincial Key Laboratory of Optical Astronomy and Solar-Terrestrial Environment, Institute of Space Sciences, Shandong University,
Weihai, 264209 Weihai, China
6 Abastumani Observatory, Mt. Kanobili, 0301 Abastumani, Georgia
7 Engelhardt Astronomical Observatory, Kazan Federal University, Tatarstan, Russia 8 Landessternwarte Heidelberg, K¨onigstuhl 12, 69117 Heidelberg, Germany
9 Astronomical Observatory, Jagiellonian University, ul. Orla 171, PL-30-244 Krakow, Poland 10Mt. Suhora Observatory, Pedagogical University, ul. Podchorazych 2, PL-30-084 Krakow, Poland 11Max-Plank-Institut f¨ur Radioastronomie, Auf dem H¨ugel 69, 53121, Bonn, Germany
12Section of Astrophysics, Astronomy and Mechanics, National & Kapodistrian University of Athens, Zografos GR-15784, Athens, Greece 13Astronomical Institute, Osaka Kyoiku University, 4-698 Asahigaoka,Kashiwara, Osaka 582-8582, Japan
14Tuorla Observatory, Department of Physics and Astronomy, University of Turku, Turku F-21500, Finland 15Department of Physics and Astronomy, University of North Carolina, Chapel Hill, North Carolina 27599, USA
16Herschel Science Centre, ESAC, European Space Agency, C/Bajo el Castillo, s/n, Villanueva de la Can˜ada, Madrid E-28692, Spain 17Planetary Plasma and Atmospheric Research Center, Tohoku University, Sendai 980-8578, Japan
18Florida International University and SARA Observatory, University Park Campus, Miami, Florida 33199, USA 19Nordic Optical Telescope, Apartado 474, Santa Cruz de La Palma E-38700, Spain
20Mun˜as de Arriba La Vara, Vald´es E-33780, Spain
21C/Jaume Balmes No 24, Cabrils, Barcelona E-08348, Spain
22Department of Physics, Faculty of Arts and Sciences, Canakkale Onsekiz Mart University, Canakkale TR-17100, Turkey 23Astrophysics Research Center and Ulupinar Observatory, Canakkale Onsekiz Mart University, Canakkale TR-17100, Turkey 24Foggy Bottom Observatory, Colgate University, 13 Oak Drive, Hamilton, New York 13346, USA
25Institute for Astrophysical Research, Boston University, 725 Commonwealth Ave., Boston, Massachusetts 02215, USA
Accepted XXX. Received YYY; in original form ZZZ
ABSTRACT
We carried out a pilot campaign of radio and optical band intra-day variability (IDV) observations of five blazars (3C66A, S5 0716+714, OJ287, B0925+504, and BL Lac-ertae) on December 18–21, 2015 by using the radio telescope in Effelsberg (Germany) and several optical telescopes in Asia, Europe, and America. After calibration, the light curves from both 5 GHz radio band and the optical R band were obtained, al-though the data were not smoothly sampled over the sampling period of about four days. We tentatively analyse the amplitudes and time scales of the variabilities, and any possible periodicity. The blazars vary significantly in the radio (except 3C66A and BL Lacertae with only marginal variations) and optical bands on intra- and inter-day time scales, and the source B0925+504 exhibits a strong quasi-periodic radio variabil-ity. No significant correlation between the radio- and optical-band variability appears in the five sources, which we attribute to the radio IDV being dominated by interstel-lar scintillation whereas the optical variability comes from the source itself. However, the radio- and optical-band variations appear to be weakly correlated in some sources and should be investigated based on well-sampled data from future observations.
1 INTRODUCTION
Among active galactic nuclei (AGNs), blazars (a combina-tion of flat-spectrum radio quasars and BL Lac objects) exhibit extreme variations in flux over almost the entire electromagnetic spectrum on time scales ranging from less than hours to many years. This violent behavior of blazars is generally explained in terms of the shock-in-jet model (Marscher & Gear 1985) and the beaming effect, in which a relativistic jet is oriented very close to our line of sight (Urry & Padovani 1995).
Discovered in the 1980s (Witzel et al. 1986;
Heeschen et al. 1987), the intra-day variability (IDV) of AGNs at centimeter wavelengths occurs in 56% of the flat-spectrum radio AGNs (Lovell et al. 2008) and in∼60% of the γ-ray blazars (Liu et al. 2012a). The cm-radio IDV has been largely attributed to the interstellar scintillation (ISS) for the dependence of variability on the Galactic latitude and the Hα emission (the Wisconsin H Alpha
Mapper (WHAM) Northern sky survey, Haffner et al.
(2003)), see Lovell et al. (2008), and especially for the an-nual modulation (owing to the Earth revolution around the Sun) of variability time scales discovered in a couple of IDV sources (e.g.Jauncey & Macquart 2001;Rickett et al. 2001;
Dennett-Thorpe & de Bruyn 2003; Bignall et al. 2003,
2006;Gab´anyi et al. 2007; Liu et al. 2012b, 2013) and the time delays of IDV found in trans-continent observations (Jauncey et al. 2000; Dennett-Thorpe & de Bruyn 2002;
Bignall et al. 2006). For more details, see the review by
Jauncey et al.(2016).
In the optical band, however, IDV should be intrinsic to the source because ISS does not affect extragalactic emission in optical wavelengths.
It is generally believed that the brightness
tem-perature Tb of the radio-jet component of AGNs
can-not exceed the inverse Compton limit TIC = 1011.5
K (Kellermann & Pauliny-Toth 1969) or the equipartition temperatureTeq= 5×10¹⁰≃1010.7 K (Readhead 1994). If
radio IDV at cm wavelengths is source-intrinsic, the bright-ness temperature of emitting components will exceed the limitTICorTeqby several orders of magnitudes, which would require a very large Doppler factorδ(e.g.,>100). However, for blazars, Doppler factors less than 30 are usually esti-mated from Very Long Baseline Interferometry (VLBI) ob-servations or flux monitoring data (Liodakis et al. 2017).
Although cm-radio IDV is generally attributed to ISS, source-intrinsic radio IDV might still be possible to detect in the following situations: (1) In some blazar cores, the in-trinsic brightness temperatureTint=Tobs/δis greater than 1012K (whereTobsis measured from the RadioAstron space
VLBI observations and δ is estimated from ground VLBI arrays; see Kovalev et al. (2016)), implying thatTIC could be violated for these blazars (Marscher 2016), but such ap-parent detections of high temperatures on very long base-lines as seen by RadioAstron may also be caused by refrac-tive substructure introduced by scattering in the interstellar medium, which is more evident at 1.6 GHz (Johnson et al. 2016). (2) A large fraction of IDV sources are intermittent (Kedziora-Chudczer 2006;Lovell et al. 2008), which should allow source-intrinsic IDV to be observed when ISS disap-pears. (3) Sometimes the radio and optical IDVs seem to be correlated, e.g., in blazar S5 0716 + 714,Quirrenbach et al.
(1991) found, during a four-week monitoring campaign in 1990, simultaneous transitions from fast to slow variabil-ity modes among 5 GHz radio-band and optical-band wave-lengths, they interpret the similar transitions as source in-trinsic variability.
However, the existence of source-intrinsic IDV, if present, is difficult to disentangle from ISS-induced vari-ability, and it may require multi-wavelength measurements with, for example, radio, optical, X-ray, andγ-ray IDV ob-servations to search for correlations between the bands. Note that the optical and high-energy-band IDVs are thought to be intrinsic to the source. Very few multi-band IDV obser-vations have been made over the past decades. To address this shortcoming, we are planning more radio-optical IDV observations. As a first step in this plan, we carried out a pilot campaign on December 18–21, 2015, using two radio telescopes and several optical telescopes.
2 OBSERVATIONS AND DATA REDUCTION
We carried out quasi-simultaneous radio-optical observa-tions of five blazars on December 18–21, 2015 using the following telescopes: Effelsberg and Urumqi (5 GHz radio), Weihai (1 m), Urumqi (1 m), Abastumani (70 cm), the Blazar Optical Sky Survey (BOSS Project) at the Univer-sity of Athens Observatory (40 cm), and OJ287-15/16 Col-laboration telescopes (optical R band). The target sources were 3C66A, S5 0716 + 714, OJ287, B0925 + 504, and BL Lac, which were selected from the RadioAstron 2015 De-cember observing sample, except B0925+504 that we added in this campaign for its significant radio IDV observed be-fore. These sources are also bright in optical, so we want to compare their radio and optical variations, and it will be interesting to see if there is a radio-optical correlation for S5 0716 + 714 as suggested before (Quirrenbach et al. 1991). Unfortunately, the Urumqi radio telescope was be-ing reconstructed and was still in testbe-ing at that time. It suffered from serious problems involving pointing, etc., that prevented the data from being used in our analysis. In ad-dition, the Urumqi optical observation had a problem with its camera gate, which led to serious light pollution that prevented that data from being used as well.
typical sampling rate of 1–2 hours for each calibrated data point. However, because sources were not always in the sky for 24 hours, some gaps appear in the light curves of the sources.
The raw optical data were processed by using standard methods (e.g., by using the standard routines of the Im-age Reduction and Analysis Facility or DAOPHOT II cali-brated with comparison stars in the observation field) (see
Valtonen et al.(2016) for the data-reduction method of the OJ287-15/16 Collaboration). We do not describe in detail here the telescopes and cameras involved in these observa-tions. However, note that, because the sources are compact, the different apertures used at different telescopes (≤1 m) had a negligible effect on the measured flux. Photometric error was estimated from the root-mean-square (rms) de-viations of the reference stars and found to be generally less than 0.02 mag, although some larger errors appeared in some time slots of individual telescopes (e.g., in the last day of the Weihai observations), which were mostly due to bad weather.
3 RESULTS AND VARIABILITY
CHARACTERISTICS
3.1 Light curves and variability analysis
Figures 1–4and 6show the radio and optical light curves, for 3C66A, S5 0716 + 714, OJ287, B0925 + 504, and BL Lac, respectively. We used the following methods to analyse the variability:
(1) The relative amplitude of variability, which is defined as the maximumSmaxminus the minimumSmindivided by the maximum plus the minimum of a light curve (Kovalev et al. 2005):
V = (Smax−Smin)/(Smax+Smin). (1)
The results are shown in Table1for both the radio and optical variability for the five sources. We also used the rms flux variation (in percent), which is the ratio of the rms variability σvar divided by the mean flux density S: m =
σvar/S. Note that the units of the optical magnitude are not those of the power intensity of the source, such as the radio-flux density; here we are concerned only with the relative variations and do not intend to transform these variations into flux density. Note that, in Table1,m < V by definition for both radio and optical variations.
(2) We analyse the variability time scale t and possi-ble variability period P in the light curves. For this, we used the first-order standard structure function (SF); see
Simonetti et al. (1985). The SF usually has a power-law form that reaches its maximum at a saturation level. Here we define the intersection of the power-law fit with the plateau corresponding to this saturation level as the time scale of the characteristic variability. The error of the time scale can be estimated by accounting for the formal errors of the power-law fit and the fitting to the SF plateau. Sometimes the SF has more than one plateau, in which case multiple variability time scales are estimated.
To determine the possible periodicity of the variations in light curves, we applied the power spectrum density (PSD)
analysis, in which strong narrow peaks in the PSD are as-sumed to be suggestive of variability periods, and the error is estimated from the full width at half power of the peak. Only three sources (S5 0716 + 714, OJ287, B0925 + 504) show possible periodic variations (see Table1).
Note that the resulting variability time scales and periods are tentative because of the gaps in the light curves of the sources (e.g., 3C66A, OJ287 and BL Lac in radio band, and 3C66A, S5 0716 + 714, B0925 + 504 and BL Lac in optical band).
(3) The correlation between radio and optical light curves was analysed by using the Pearson correlation coefficient and a null probability or confidence level (e.g.Olkin & Pratt 1958; Fan et al. 2017); the result is listed in Table 1. The results reveal no significant correlations between the radio and optical variations for the five blazars, although weak correlation seems to appear in some cases (S5 0716 + 714, B0925 + 504), but with low significance.
4 COMMENTS ON INDIVIDUAL SOURCES
All five blazars areγ-ray loud BL Lac objects and three of them are also TeV emitters (3C66A, S5 0716 + 714, and BL Lac), and their radio spectra are flat at centimeter wavelengths. Four of them show kpc-scale core-halo features but not more than 100 kpc, and one (B0925 + 504) is compact and unresolved with the Very Large Array (VLA). The BL Lac objects are low-accreting AGNs and could be in the early evolutionary stage of becoming larger-scale Fanaroff–Riley Class I radio sources. In the following, we briefly discuss each the five sources based on the literature and on the present results.
3C66A, 2FGL J0222.6 + 4302 (ISP BL)
This is an intermediate synchrotron peaked BL Lac ob-ject (ISP BL,Abdo et al. 2010;Fan et al. 2016) and a TeV
γ-ray source. Optical variability at short time scales has been reported for this source (Xie et al. 1994). In the radio band, it appears as a core halo on the <100 kpc scale and has a one-sided VLBI core jet to the south, in which fast ap-parent superluminal motions of up to 29cwere reported by
Jorstad et al.(2001). No evident correlation between long-term γ-ray by the Fermi Large-Area Telescope and multi-band radio emission was found in 3C66A(Fuhrmann et al. 2014).
The present results show a marginal inter-day variabil-ity at 5 GHz (with reduced Chi-squared of 1.2) and rapid optical variations with time scales of 0.6±0.1 and 1.4±0.2 days (see Fig.1 and Table 1), and no correlation between the radio and optical variations is found.
S5 0716+714, 2FGL J0721.9 + 7120 (ISP BL)
This object is a TeVγ-ray blazar and displays optical short-term variability and micro variability (Hu et al. 2014;
Man et al. 2016). In the radio band, it shows a two-sided halo on the kpc scale, and a one-sided VLBI core jet to the north with highly relativistic speeds (Rani et al. 2015;
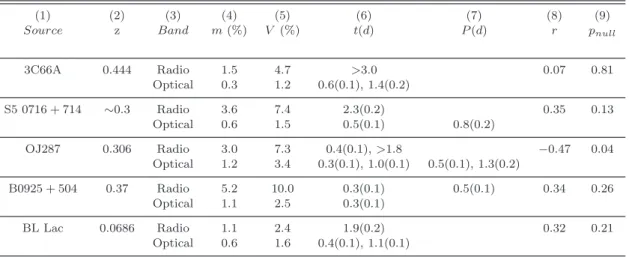
Table 1.Variability amplitudes and possible variability time scales and periods of blazars, and the correlation parameter between radio and optical variations. The columns are (1) source name, (2) redshift, (3) observation band (5 GHz radio in first line, optical R band in second line), (4) rms amplitude variation divided by average value in percent, (5) relative amplitude variations in percent as defined in the text, (6) variability time scales (in days) estimated from the SF, (7) variability periods (in days) estimated from the power spectrum density, (8) Pearson correlation coefficientr, (9) null probabilitypnull. The calibrator’s modulation indexm0is 0.35% at radio band.
(1) (2) (3) (4) (5) (6) (7) (8) (9)
Source z Band m(%) V (%) t(d) P(d) r pnull
3C66A 0.444 Radio 1.5 4.7 >3.0 0.07 0.81
Optical 0.3 1.2 0.6(0.1), 1.4(0.2)
S5 0716 + 714 ∼0.3 Radio 3.6 7.4 2.3(0.2) 0.35 0.13
Optical 0.6 1.5 0.5(0.1) 0.8(0.2)
OJ287 0.306 Radio 3.0 7.3 0.4(0.1),>1.8 −0.47 0.04
Optical 1.2 3.4 0.3(0.1), 1.0(0.1) 0.5(0.1), 1.3(0.2)
B0925 + 504 0.37 Radio 5.2 10.0 0.3(0.1) 0.5(0.1) 0.34 0.26
Optical 1.1 2.5 0.3(0.1)
BL Lac 0.0686 Radio 1.1 2.4 1.9(0.2) 0.32 0.21
Optical 0.6 1.6 0.4(0.1), 1.1(0.1)
the inner jet, which is suggestive of a helical jet (Liu et al. 2012c). The VLBI jet-position angle and theγrays are also correlated, which suggests that radio waves andγ rays are emitted on the same helical filament, which rotates with the jet (Rani et al. 2014),Rani et al. (2015) further state that “our analysis favours the major optical/γ-ray flares in S5 0716 + 714 being produced upstream of the 7 mm VLBI core”. This statement makes it clear that the radio and optical/γ-ray flares in S5 0716 + 714, come from separate regions. During a four-week monitoring campaign in 1990, simultaneous transitions were observed from fast to slow variability modes among 5 GHz radio and optical bands, suggesting a source intrinsic origin of the inter-day variabil-ity (Quirrenbach et al. 1991).Fuhrmann et al.(2008) found that the increase of the variability amplitudes from cm to mm bands contradicts expectations from standard ISS and suggests a source-intrinsic origin for the inter-day vari-ability. Gupta et al. (2012) observed multi-waveband IDV and found no significant correlation between cm-radio and optical-band IDV. At 5 GHz,Liu et al.(2012b) found strong evidence in the form of an annual cycle of IDV time scales of S5 0716 + 714, which suggests that the 6 cm IDV is dom-inated by ISS.
The present results show strong IDVs in both the radio and optical bands (Fig. 2 and Table 1). The radio flux initially increases and then decreases, and contains small IDV wiggles. In the optical band, it undergoes pronounced variations. A weak radio-optical correlation exists in the ‘common radio-optical data time’, but this is not significant (Table1).
OJ287, 2FGL J0854.8 + 2005 (LSP BL)
The BL Lac object is known for its ∼12-year period-icity in the optical light curve (Sillanp¨a¨a et al. 1988). The optical outbursts appear as double peaked and their peri-odic occurrence is interpreted primarily in terms of a
bi-nary black hole system (Valtonen 2007). The model pre-dicted a major optical outburst in December, 2015, which occurred within the expected time range, peaking on De-cember 5, 2015 at a magnitude of 12.9 in the optical R band (Valtonen et al. 2016). Various time scales and periods (or quasi-periodic oscillations) have been reported in the optical band (Sandrinelli et al. 2016;Bhatta et al. 2016;Zola et al. 2016). In the radio band, it shows a one-sided core jet on the kpc scale to the west, similar to its VLBI jet direction (Perlman & Stocke 1994). A prominent erratic wobbling of the inner-jet-position angle changes by up to 40◦ over two years (Agudo et al. 2012), and it has been suggested that OJ287 is a rotating helix (Cohen 2017). .
The present results show prominent intra- and inter-day variations in the radio and optical bands, with the shortest time scale being a few hours in the optical band (Fig. 3
and Table 1). The radio-band light curve has three gaps, so the radio-band time-scale assignment is only tentative. Finally, a weak (non-significant) anti-correlation appears between the radio and optical variations in the common radio-optical data time (see Table1).
B0925 + 504, 2FGL J0929.5 + 5009 (ISP BL)
The optical R-band image of this ISP BL Lac object at redshift 0.37 shows a very compact host galaxy that can be fitted with the de Vaucouleurs model (Nilsson et al. 2003). In the radio band, it is not resolved at 5 GHz with the VLA (Taylor et al. 1996) but is resolved with the VLBI, showing a core jet to the southeast. Rapid radio IDVs have previously been detected towards this source at 5 GHz (Koay et al. 2011;Liu & Liu 2015).
day estimated from the light curve (see Fig.4and Table1).
Liu & Liu (2015) find that, from our previous observations at Urumqi and Effelsberg, the IDV time scales of this source can be fitted with an ISS model, with the time scales mostly
<0.5 day and the longer time scales becoming relevant only during days 250–300 of the year. The IDV time scale of 0.3±0.1 days observed on December 18–21, 2015 about day 355 of the year, is shorter than that predicted by the model. We combined all previous and current observations of this source and fit the time scales again with the model of the anisotropic scattering ‘screen’ (see Fig.5). The parameters of the ISM model are updated with the projected velocity of the screen,VRA=−4.2±1.1 km/s,VDec=−2.5±1.8 km/s, the ratio of the two-dimensional screen axis R= 1.5±0.3, and the position angle of the major axis of the screen (mea-sured from the north to east),ψ= 111.1±8.4◦. Note that the data are fit withD= 110 pc, with the assumption that the distanceDfrom the ISM to Earth did not vary too much over the past years. SeeMarchili et al.(2012) andLiu & Liu
(2015) for more details of fitting to the ISS model.
Furthermore, a weak but non-significant radio-optical correlation exists (see Table1) for the common radio-optical data time (note, however, that only two nights of optical data are available). Further study of this correlation requires a longer optical-data train. However, the fitted annual cycle in Fig. 5 is clear evidence of ISS as a major cause of the radio IDV on B0925 + 504.
BL Lacertae, 2FGL J2202.8 + 4216 (LSP BL)
BL Lacertae (the prototype of BL Lac objects) lies at the centre of a giant elliptical galaxy with weak emission lines and is a TeVγ-ray source. The source exhibits optical variabilities with multiple time scales (Fan et al. 1999). In the radio band, it is a kpc-scale core halo and has a VLBI core jet to the south. The radio emission varies at higher frequencies, leading the lower-frequency emissions by several days to a few months (Villata et al. 2004), and the optical variations lead the 15 GHz radio emissions by ∼100 days (Bach et al. 2006).
The present results (Fig.6) show some intra- and inter-day optical variations with relatively weak variations in the radio band (with reduced Chi-squared of 1.5 andm= 1.1% in Table1, about 3σdetection). A weak but non-significant correlation exists between radio- and optical-band variations in the common radio-optical data time (Table1).
5 DISCUSSION AND SUMMARY
Striking highly periodic radio-band variations of B0925+504 are detected in this campaign, which share with the optical band a similar variability time scale of∼0.3 days to the op-tical one. Furthermore, a weak positive correlation between the radio- and optical-band variability seem to appear in the common data time range.Liu & Liu(2015) summarized the 5 GHz IDV data of B0925+504 observed prior to 2015, which can be fitted with an ISS model. With the two data points observed in 2015 added, the combined data can also be fit to an updated ISS model. The new model, which may be more reliable because it has been tested against more data, sug-gests the time scale of 0.3±0.1 day for B0925+504 is roughly
Figure 1.Radio-band (5 GHz) light curve (Effelsberg, on right axis) and optical R-band light curve (Weihai, Abastumani, on left axis) versus JD-2457300, for 3C66A.
Figure 2.Radio-band (5 GHz) light curve (Effelsberg, on right axis) and optical R-band light curve (Weihai, Abastumani, on left axis) versus JD-2457300, for S5 0716+714.
Figure 3.Radio (5 GHz) light curve (Effelsberg, on right axis) and optical R-band light curve (Weihai, Abastumani, OJ287-15/16 Collaboration, on left axis) versus JD-2457300, for OJ287.
Figure 4.Radio (5 GHz) light curve (Effelsberg, on right axis) and optical R-band (V-C) light curve (Abastumani, on left axis) versus JD-2457300, for B0925 + 504.
0 60 120 180 240 300 360 DoY [day]
0.0
0.5
1.0
1.5
2.0
2.5
3.0
3.5
4.0
T
im
es
ca
le
[d
ay
]
Liu2015 model new model Liu2015 data new data
Figure 5.Radio (5 GHz) IDV timescales from Liu & Liu (2015) and new observations (green) that we made in July and Decem-ber 2015 (the campaign reported herein) against day of year for B0925 + 504. The red solid line represents the updated model-expected timescales. See text for the values of the ISS model pa-rameters.
Figure 6. Radio-band (5 GHz) light curve (Effelsberg, on right axis) and optical R-band light curve (Weihai, Abastumani, the University of Athens Observatory, on left axis) versus JD-2457300, for BL Lac.
8.6 GHz in PKS1257−326, an IDV source about half as strong as B0925 + 504, byBignall et al.(2003).
For a source to produce intrinsic radio IDV at 5 GHz with a timescale of 0.5 day, for example, we can estimate the variability brightness temperature Tb,var ≈ 1.3×10¹⁸
K (Wagner & Witzel 1995) for a flux-density change of 0.1 Jy at 5 GHz during the variability period of 0.5 day for the B0925 + 504. Based on thisTb,varand the Doppler effect in total flux variability,Tb,var = δ3Tint (Hovatta et al. 2009),
we estimate a Doppler factor δ ≥160 if we assume an in-trinsic brightness temperatureTint ≤TIC= 1011.5 K. This δ∼160 is much greater than that estimated from VLBI data or from total flux variability on longer time scales for blazars (δ <30,L¨ahteenm¨aki & Valtaoja 1999;Hovatta et al. 2009;
Savolainen et al. 2010; Liodakis et al. 2017). The Doppler factor for a test with a viewing angleθ= 1◦and an intrinsic jet speedv= 0.98c isδ ∼10. The intrinsic variations at 5 GHz, with such a short timescale of 0.5 day, could only be possible for a source in the most extreme conditions, e.g. for an extreme case ofθ = 0.1◦ andv= 0.99992c, the Doppler factor isδ∼155, which is close to the value of 160 obtained above. However, for the B0925 + 504, as discussed previ-ously an annual cycle surely demonstrates that these radio variations seen in B0925 + 504 are predominantly caused by ISS.
To summarise, we conducted a pilot campaign of radio-and optical-bradio-and IDV observations of five blazars around December 18–21, 2015 with the radio telescope at Effels-berg, and several optical telescopes. After calibration, the light curves from both the 5 GHz radio band and the optical R band were obtained, although the data are not well sam-pled in time. We tentatively analyse the amplitudes and time scales of the variabilities and any possible periodicity. The blazars vary significantly in the radio (except 3C66A and BL Lac with only marginal variations) and optical bands on intra- and inter-day time scales. No significant correla-tion between radio- and optical-band variability is found in the five sources, which is most likely due to the radio IDV being dominated by interstellar scintillation whereas the op-tical variability comes from the source itself. However, the weak correlation between radio- and optical-band variation in some sources, whether real or not, should be investigated again based on observations that yield well-sampled data.
Some gaps appear in the light curves obtained in this pi-lot campaign, so future radio-optical IDV observations over continuous days with no gaps are required to well identify any correlation between radio- and optical-band variations and the time delay between them. In addition, the optical band is better suited for observing radio-band IDV at both cm and mm wavelengths because the ISS-induced variability is not present at mm wavelengths.
ACKNOWLEDGMENTS
O.M.K acknowledges financial support from the Shota Rus-taveli NSF under contract FR/217554/16; and S. M. Hu acknowledges support from the National Natural Science Foundation of China under Grant No. 11203016 and sup-port from the Young Scholars Program of Shandong Univer-sity, Weihai. S.Z. acknowledges partial support from NCN Grant No. 2013/09/B/ST9/00599. Optical monitoring ob-servations of OJ287 and BL Lac collected within the frame-work of the Blazar Optical Sky Survey (BOSS Project), is conducted at the University of Athens, Greece. We thank TUBITAK for partial support for using the T60 telescope through Project No. 10CT60-76. The radio data are based on observations with the 100-m telescope at the MPIfR (Max-Planck-Institut f¨ur Radioastronomie) at Effelsberg.
REFERENCES
Abdo A. A., Ackermann M., Ajello M., et al., 2010, ApJ, 710, 1271
Agudo I., Marscher A. P., Jorstad S. G., et al., 2012, ApJ, 747, 63
Bach U., Villata M., Raiteri C. M., et al., 2006, A&A, 456, 105 Bhatta G., Zola S., Stawarz L., et al., 2016, ApJ, 832, 47 Bignall H. E., Jauncey D. L., Lovell J. E. J., et al., 2003, ApJ,
585, 653
Bignall H. E., Macquart J.-P., Jauncey D. L., et al., 2006, ApJ, 652, 1050
Cohen M., 2017, Galaxies, 5, 12
Dennett-Thorpe J., de Bruyn A. G., 2002, Nature, 415, 57 Dennett-Thorpe J., de Bruyn A. G., 2003, A&A, 404, 113 Fan J. H., Xie G. Z., Bacon R., 1999, A&AS, 136, 13 Fan J. H., Yang J. H., Liu Y., et al., 2016, ApJS, 226, 20 Fan J. H., Yang J. H., Xiao H. B., et al., 2017, ApJ, 835, L38 Fuhrmann L., Krichbaum T. P., Witzel A., et al., 2008, A&A,
490, 1019
Fuhrmann L., Larsson S., Chiang J., et al., 2014, MNRAS, 441, 1899
Gab´anyi K. ´E., Marchili N., Krichbaum T. P., et al., 2007, A&A, 470, 83
Gupta A. C., Krichbaum T. P., et al., 2012, MNRAS, 425, 1357 Haffner L. M., Reynolds R. J., Tufte S. L., et al., 2003, ApJS,
149, 405
Heeschen D. S., Krichbaum T. P., Schalinski C. J., et al., 1987, AJ, 94, 1493
Hovatta T., Valtaoja E., Tornikoski M., L¨ahteenm¨aki A., 2009, A&A, 494, 527
Hu S. M., Chen X., Guo D. F., Jiang Y. G., Li K., 2014, MNRAS, 443, 2940
Jauncey D. L., Kedziora-Chudczer L. L., Lovell J. E. J., et al., 2000, in Hirabayashi H., Edwards P. G., Murphy D. W., eds., Proceedings of the VSOP Symposium, p147, Published by the Institute of Space and Astronautical Science, Tokyo, Japan. Jauncey D. L., Macquart J.-P., 2001, A&A, 370, L9
Jauncey D. L., Bignall H., Kedziora-Chudczer L., et al., 2016, Galaxies, 4, 62
Johnson M. D., Kovalev Y. Y., Gwinn C. R., et al., 2016, ApJ, 820, L10
Jorstad S. G., Marscher A. P., Mattox J. R., et al., 2001, ApJ, 556, 738
Kedziora-Chudczer L., 2006, MNRAS, 369, 449
Kellermann K. I., Pauliny-Toth I. I. K., 1969, ApJ, 155, L71 Koay J. Y., Bignall H. E., Macquart J.-P., et al., 2011, A&A, 534,
L1
Kovalev Y. Y., Kellermann K. I., Lister M. L., et al., 2005, AJ, 130, 2473
Kovalev Y. Y., Kardashev N. S., Kellermann K. I., et al., 2016, ApJ, 820, L9
L¨ahteenm¨aki A., Valtaoja E., 1999, ApJ, 521, 493
Liodakis I., Marchili N., Angelakis E., et al., 2017, MNRAS, 466, 4625
Lister M. L., Aller M. F., Aller H. D., et al., 2016, AJ, 152, 12 Liu X., Song H.-G., Liu J., et al., 2012a, Research in Astromony
and Astrophysics, 12, 147
Liu X., Song H.-G., Marchili N., Liu B.-R., Liu J., Krichbaum T. P., et al., 2012b, A&A, 543, A78
Liu X., Mi L. G., Liu B. R., Li Q. W., 2012c, Ap&SS, 342, 465 Liu B.-R., Liu X., Marchili N., Liu J., et al., 2013, A&A, 555,
A134
Liu J., Liu X., 2015, Ap&SS, 357, 165
Lovell J. E. J., Rickett B. J., Macquart J.-P., Jauncey D. L., Bignall H. E., et al., 2008, ApJ, 689, 108
Man Z. Y., Zhang X. Y., Wu J. H., Yuan Q. R., 2016, MNRAS, 456, 3168
Marchili N., Krichbaum T. P., Liu X., Song H.-G., et al., 2012, A&A, 542, A121
Marscher A. P., Gear W. K., 1985, ApJ, 298, 114 Marscher A. P., 2016, Galaxies, 4, 37
Nilsson K., Pursimo T., Heidt J., et al., 2003, A&A, 400, 95 Olkin I., Pratt J. W., 1958, The Annals of Mathematical
Statis-tics, 29, 201
Perlman E. S., Stocke J. T., 1994, AJ, 108, 56
Quirrenbach A., Witzel A., Wagner S., Sanchez-Pons F., Krich-baum T. P., et al., 1991, ApJ, 372, L71
Rani B., Krichbaum T. P., Marscher A. P., et al., 2014, A&A, 571, L2
Rani B., Krichbaum T. P., Marscher A. P., et al., 2015, A&A, 578, A123
Readhead A. C. S., 1994, ApJ, 426, 51
Rickett B. J., Witzel A., Kraus A., et al., 2001, ApJ, 550, L11 Sandrinelli A., Covino S., Dotti M., Treves A., 2016, AJ, 151, 54 Savolainen T., Homan D. C., Hovatta T., et al., 2010, A&A, 512,
24
Sillanp¨a¨a A., Haarala S., Valtonen M. J., Sundelius B., Byrd G. G., 1988, ApJ, 325, 628
Simonetti J. H., Cordes J. M., Heeschen D. S., 1985, ApJ, 296, 46
Taylor G. B., Vermeulen R. C., Readhead A. C. S., et al., 1996, ApJS, 107, 37
Urry C. M., Padovani P., 1995, PASP, 107, 803
Valtonen M. J., Zola S., Ciprini S., et al., 2016, ApJ, 819, L37 Valtonen M. J., 2007, ApJ, 659, 1074
Villata M., Raiteri C. M., Aller H. D., et al., 2004, A&A, 424, 497 Wagner S. J., Witzel A., 1995, ARA&A, 33, 163
Witzel A., Heeschen D. S., Schalinski C., Krichbaum T., 1986, Mitteilungender Astronomischen Gesellschaft Hamburg, 65, 239
Xie G. Z., Li K. H., Zhang Y. H., Liu F. K., Fan J. H., Wang J. C., 1994, A&A, 106, 361
Zola S., Valtonen M., Bhatta G., et al., 2016, Galaxies, 4, 41
This paper has been typeset from a TEX/LATEX file prepared by