The Journal of Experimental Medicine
J. Exp. Med. The Rockefeller University Press • 0022-1007/2003/12/1937/13 $8.00 Volume 198, Number 12, December 15, 2003 1937–1949
1937
The Role of
Brg1
, a Catalytic Subunit of Mammalian
Chromatin-remodeling Complexes, in T Cell Development
Thomas C. Gebuhr,
1Grigoriy I. Kovalev,
2,4Scott Bultman,
1Virginia Godfrey,
3Lishan Su,
2,4and Terry Magnuson
1,4,51Department of Genetics, 2Department of Microbiology and Immunology, 3Department of Pathology
and Laboratory Medicine, 4Lineberger Comprehensive Cancer Center, and 5Carolina Center for Genome Sciences, University of North Carolina at Chapel Hill, Chapel Hill, NC 27599
Abstract
Mammalian SWI–SNF-related complexes use brahma-related gene 1 (Brg1) as a catalytic subunit to remodel nucleosomes and regulate transcription. Recent biochemical data has linked Brg1
function to genes important for T lymphocyte differentiation. To investigate the role of SWI– SNF-related complexes in this lineage, we ablated Brg1 function in T lymphocytes. T cell–specific
Brg1-deficient mice showed profound thymic abnormalities, CD4 derepression at the double negative (DN; CD4 CD8) stage, and a developmental block at the DN to double positive (CD4 CD8) transition. 5-bromo-2-deoxyuridine incorporation and annexin V staining establish a role for Brg1 complexes in the regulation of thymocyte cell proliferation and survival. This Brg1-dependent cell survival is specific for developing thymocytes as indicated by the presence of Brg1-deficient mature T lymphocytes that have escaped the developmental block in the thymus. However, reductions in peripheral T cell populations lead to immunodeficiency and compromised health of mutant mice. These results highlight the importance of chromatin-remodeling complexes at different stages in the development of a mammalian cell lineage.
Key words: Brg1 • SWI–SNF • chromatin • T cell • development
Introduction
Coordinated programs of gene expression underlie the development, functional differentiation, and homeostatic regulation of the mammalian immune system. Perhaps one of the most intensely studied systems of transcriptional regulation is that of T lymphocyte ontogeny (1). Activation or repression of lineage-specific and developmental stage– restricted cell surface molecules has been correlated with cell fate choices in the T cell differentiation pathway. Up-regulation of both CD4 and CD8 and subsequent down-regulation of one of these two coreceptors in devel-oping thymocytes leads to mature T helper (CD4 CD8) and cytotoxic (CD4 CD8) T cells in the periphery.
In addition to lineage-restricted transcription factors, it is becoming increasingly clear that chromatin-modifying factors are necessary to achieve proper temporal and spatial patterns of gene expression in the immune system. Modification of
local chromatin structure is achieved, in part, through the activity of multisubunit protein complexes that use the energy of ATP hydrolysis to disrupt the conformation and position of nucleosomes (2). The yeast SWI–SNF complex was the first such complex to be identified. It has been character-ized in the most detail and is conserved throughout evolution. Mammalian SWI–SNF-related complexes consist of 9–11 subunits that utilize either brahma (Brm; also called SNF-
or Smarca2) or Brm-related gene 1 (Brg1; also called SNF2-
or Smarca4) as the catalytic subunit (2, 3).
Targeted mutations of the Brg1 catalytic subunit or two other complex members (INI1–Snf5 and Srg3–Baf155) confer early embryonic lethality in the mouse, indicating that mammalian SWI–SNF-related complexes are essential (4– 7). Although few direct target genes have been confirmed in mammalian cells, biochemical interactions with gene regulatory elements and transcription factors important for hematopoietic lineage specification have implicated SWI– SNF-related function in these processes (8). For example,
T.C. Gebuhr and G.I. Kovalev contributed equally to this work. The online version of this article contains supplemental material. Address correspondence to Terry Magnuson, Department of Genetics, Neurosciences Research Building, Room 4109D, University of North Carolina, CB 7264, 103 Mason Farm Road, Chapel Hill, NC 27599. Phone: (919) 843-6475; Fax: (919) 843-6365; email: [email protected]
Abbreviations used in this paper: BrdU, 5-bromo-2-deoxyuridine; Brg1,
brahma-related gene 1; Brm, brahma; DN, double negative; DP, double
interactions of chromatin-modifying complexes, including SWI–SNF-related, with Ikaros, a zinc finger–containing, se-quence-specific DNA-binding transcription factor impor-tant in lymphocyte development, suggest a link between chromatin regulation and hematopoietic cell fate decisions (9). Consistent with this notion, chromatin immunoprecipi-tation assays have correlated down-regulation of IL-2R (CD25) at the double negative (DN) stages of T cell devel-opment with the dissociation of Brg1 and histone acetylase p300 from promoter elements (10). Moreover, dominant negative expression of BAF57, an HMG-containing, DNA-binding subunit of the SWI–SNF-related complexes, in the T cell lineage revealed a role of chromatin remodeling in CD4 silencing and CD8 activation (11). These data provide evidence that SWI–SNF-related complexes are important regulators of stage-restricted gene expression in the T cell lineage. In addition to this developmental gene regulation, chromatin-modifying activity has been associated with proliferation of peripheral T lymphocytes. For example, antigenic activation of T cells induces rapid association of SWI–SNF-related complexes with chromatin in a Brg1 -dependent manner (12). Furthermore, inactivation of Lsh, a member of the SNF2 family of proteins including Brg1, in lymphoid precursors results in a severe proliferation defect in response to Con A activation of peripheral T lympho-cytes (13). Thus, chromatin-remodeling activity has been associated with a number of processes in T cell development and function, although the early lethality or minimal phe-notypes associated with targeted mutations in SWI–SNF-related complex members do not permit loss of function studies in this lineage.
To investigate the in vivo role of Brg1 and the SWI– SNF-related complex function in T cell biology, we specif-ically inactivated Brg1 in the T cell lineage using the
Cre-loxP conditional mutagenesis system. Here, we report that loss of Brg1 results in a block in T cell development at the immature stages and investigate the effect of Brg1 mutation on mature T cells in the periphery. These data provide in vivo evidence implicating ATP-dependent chromatin-remod-eling factors as important regulators of T lymphocyte de-velopment and immune response.
Materials and Methods
Mice. The Brg1 germline-null allele (4), the lck-Cre (14), and the Zp3-Cre (15) mice have been described. The Brg1 floxed al-lele mice were provided by P. Chambon (Centre National de la Recherche Scientifique, Strasbourg, France) and harbor previ-ously described loxP sites integrated into the Brg1 genomic locus (16). All mice were maintained on a mixed genetic background at the University of North Carolina, Chapel Hill Animal Facility.
Genotyping, RT-PCR, and PCR Quantification. Genotyping for the Brg1-targeted mutation has been described (4). For the detection of the lck-Cre and Zp3-Cre transgenes, similar condi-tions were used except for 1.5 mM MgCl2, 62C annealing tem-perature, and the following primers specific for Cre: forward, 5caatttactgaccgtacac3; reverse, 5catcgccatcttccagcag3. For the amplification of the unrecombined and recombined floxed allele depicted in Fig. 1 B the sequences are: primer 1, 5
-gatcagctcat-gccctaagg-3; primer 2, 5-gtcatacttatgtcatagcc-3; and primer 3, 5-gccttgtctcaaactgataag-3 (1 mM MgCl2 and 51C annealing). RT-PCR conditions for Brm, TCR, and CD3 have been re-ported (4, 17, 18).
Quantification of PCR products was performed on a GelDoc 2000 (Bio-Rad Laboratories) using Multianalyst software (Bio-Rad Laboratories; see Supplemental Materials and Methods, available at http://www.jem.org/cgi/content/full/jem.20030714/DC1).
Antibodies, Cell Labeling, and FACS® Assays. mAbs used for immunofluorescence are listed in Supplemental Materials and Methods, available at http://www.jem.org/cgi/content/full/ jem.20030714/DC1. Annexin-V/propidium iodide (PI) staining was performed according to the manufacturer’s protocol (Roche). LN cells were stained and analyzed on a FACScan™ flow cytome-ter (BD Biosciences). Cell sorting was performed on a MoFlow (DakoCytomation) instrument. The FACS® data were analyzed with the Summit V3.1 data analysis software (DakoCytomation).
Histology. Thymi from 4-wk-old animals and livers from 3–6-mo-old animals were dissected, fixed in 4% paraformaldehyde, and processed for the production of paraffin sections. 5–8- m sections were stained with hematoxylin and eosin using standard conditions.
In vivo 5-bromo-2-deoxyuridine (BrdU) Labeling and Anti-BrdU Staining. BrdU (Sigma-Aldrich) was administrated by intraperi-toneal administration of 1 mg/mouse injected two times 4 h apart as previously described (19). Thymocytes were harvested in 1 h after the second injection and stained with CD4 and anti-CD8 mAbs. The BrdU staining of those cells was performed by a conventionally modified method as previously described (19).
Cell Activation and Proliferation Assays. The complete medium (RPMI 1640 supplemented with 10% FCS, 2 mM l-glutamine, 50 U/ml pen/strep) was used for cell culture. CD3 and CD3/ CD28 stimulation was performed as previously described (20). For in vitro mitogen stimulation, 5 105 LN cells were cultured in 200 l medium, with or without 5 or 10 g/ml Con A (Sigma-Aldrich), or with 0.5 ng/ml PMA and 0.5 M ionomy-cin in 96-well flat-bottom plates. Incubation was performed in complete RPMI for 48 h in 37C with pulse [H3]thymidine at 1 uCi/well for the last 12 h.
Online Supplemental Material. See Supplemental Materials and Methods, available at http://www.jem.org/cgi/content/full/ jem.20030714/DC1, for details regarding genotyping, RT-PCR, and PCR quantification.
Results
Generation of T Cell–specific Brg1-deficient Mice. To in-vestigate the potential function of Brg1 during thymocyte development, we used a previously described Brg1
at embryonic days 7.5 and 8.5 (0/15; 0.05 P 0.025). The fact that no resorption moles or empty decidua were observed indicates that lethality occurs before decidualiza-tion is initiated as reported for the targeted null allele (4). Thus, floxed is a null allele.
Mice carrying the Brg1 floxed allele (/flox) were mated with mice heterozygous for a Brg1-null mutation generated by gene targeting (/null) and mice expressing Cre recombinase under the control of the lck-proximal promoter (/; lck-Cre) to obtain compound
heterozy-gous mice harboring the lck-Cre transgene (null/floxed;
lck-Cre, henceforth referred to as tBrg1 for T cell lin-eage–specific Brg1 mutation; references 4 and 14). Mice harboring one floxed allele, one wild-type allele, and the
lck-Cre transgene (/floxed; lck-Cre) showed no differences from wild-type mice in total thymocyte number or cell type composition (unpublished data), consistent with pre-viously published reports of no gross abnormalities in T cell development in mice heterozygous for the Brg1-null muta-tion (11). Therefore, both wild-type and /floxed; lck-Cre
mice were used as controls.
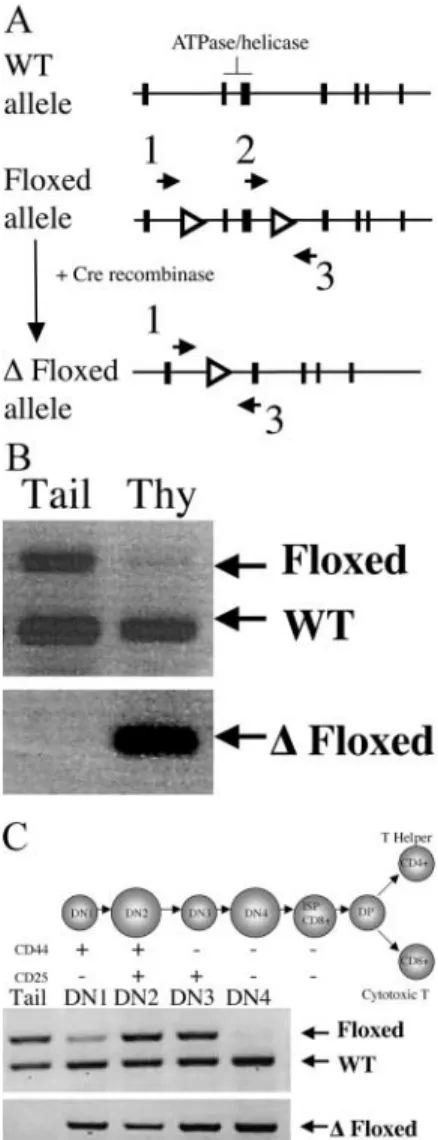
The lck-Cre transgene has previously been shown to ex-press Cre specifically in the T cell lineage, with Cre-medi-ated recombination detected as early as the DN1 (CD44 CD25) stage and complete by the double positive (DP; CD4 CD8) stage (14). PCR analysis of whole thymic DNA preparations from Brg1 /floxed; lck-Cre mice showed efficient recombination of loxP sites, as judged by the loss of the floxed amplicon (Fig. 1 B, top) using primers that amplify both the wild-type and floxed allele (Fig. 1 A, primers 2 and 3). Accordingly, the floxed allele showed significant amplification in thymus and not in tail DNA preparations using primers specific for the recombined floxed allele (Fig. 1 B, bottom, and A, primers 1 and 3). To investigate timing of recombination of the Brg1 floxed al-lele, we analyzed the triple negative (TN; CD4 CD8 CD3) DN1 through DN4 cell populations from Brg1 /flox; lck-Cre mice. Cre-mediated deletion began at DN1 and proceeded through DN4 (Fig. 1 C, bottom) stage, consistent with previous reports using this lck-Cre trans-gene (14). As shown in Fig. 1 C, top, the floxed allele was only partially deleted at the DN1, DN2, and DN3 stages, but was virtually complete by the DN4 stage. Loss of the floxed allele amplicon at DN4 indicates high efficiency of recombination by this stage.
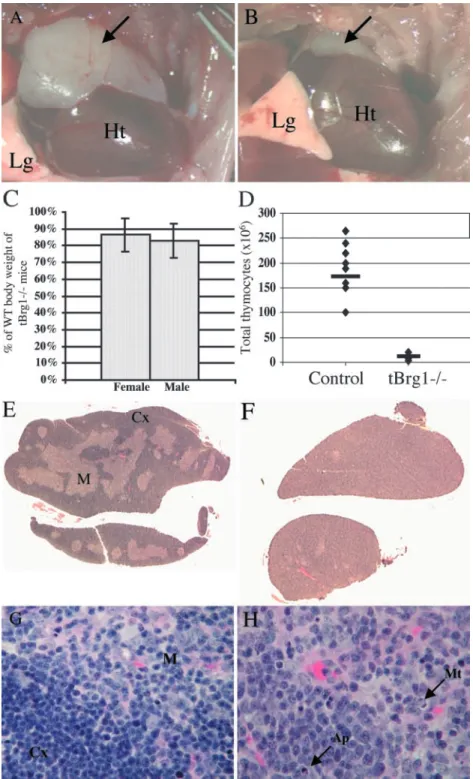
T Cell–specific Brg1 Inactivation Resulted in Abnormal Thy-mic Development and Runting. Gross dissection of tBrg1 mutant animals revealed severe thymic defects. The overall size of the mutant thymus was markedly reduced compared with the large, bi-lobed thymus observed in control litter-mates at 4 wk of age (compare A and B in Fig. 2). Thy-mocyte cell counts demonstrated a dramatic 20-fold reduc-tion in total thymocytes present in the mutant thymus, indicating a T cell developmental defect (1.3 0.7 107 in mutant vs. 27.3 8 107 in control 4-wk-old thymus; Fig. 2 D). In support of this finding, histological analysis re-vealed an almost complete loss of corticomedullary archi-tecture in tBrg mutant animals (compare E and F in Fig. 2) and enlarged cortical thymocytes containing irregular oval nuclei with more open chromatin, which is indicative of more immature thymocytes (Fig. 2 H). Additionally, higher magnification histological analysis revealed an in-crease in the number of mitotic figures as well as apoptotic bodies in the mutant thymus (compare G and H in Fig. 2). tBrg1 mice displayed a significant reduction in body weights at 3–4 wk of age compared with sex-matched con-trol littermates (Fig. 2 C). Although the severity of runting was variable between litters, differences in body weights
Figure 1. Conditional inactivation of Brg1 in developing thymocytes.
(A) Schematic representation of Brg1 floxed allele. Open triangles represent
position of loxP sites, solid boxes represent Brg1 exons, and arrows 1–3
indicate position and orientation of PCR primers used for genotype
analysis in C and D. (B) Detection of Cre-mediated deletion of the Brg1
floxed allele in thymus. PCR analysis using primers (primer set 2/3 in B) that amplify both the wild-type and floxed allele (top) in whole thymus
DNA preparations from /floxed; lck-Cre mice. Loss of upper floxed allele
band indicates efficient recombination of loxP sites and conversion to
floxed (bottom, primers set 1/3 in B). (C) Timing and efficiency of
recombi-nation during thymocyte development at the DN (CD4 CD8) stages.
TN (CD4 CD8 CD3) thymocytes from /floxed:lck-Cre mice were
subdivided into DN1→DN4 stages. PCR analysis as described in B allowed
between mutants and control animals remained relatively constant throughout the aging process.
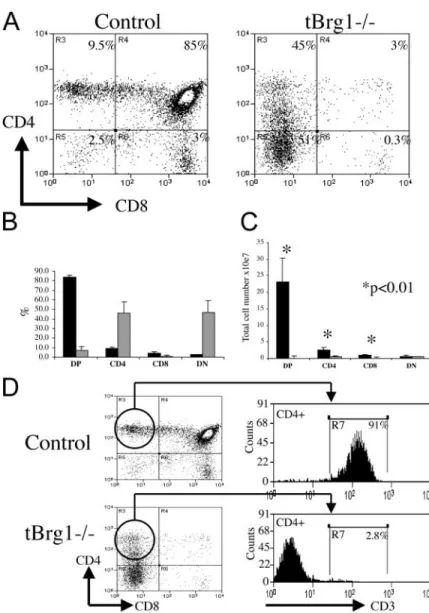
T Cell Developmental Block and CD4 Derepression in tBrg1 Mice. To provide insight into the nature of the T cell developmental defect, FACS® analysis of a number of stage-specific cell surface markers was performed on thy-mocytes from tBrg1 animals versus controls. Signifi-cantly, CD4/CD8 staining revealed an almost complete loss of the DP (CD4 CD8) and CD8 single positive (SP; CD4 CD8) cell populations, with a corresponding rela-tive increase in DN (CD4 CD8) T cells in the mutant
thymus (Fig. 3, A and B). Interestingly, mutant thymocytes showed an increased percentage of CD4 SP cells, although the absolute number of CD4 CD8 cells was reduced (Fig. 3, B and C). In absolute numbers per thymus, DP thymocytes were reduced 250-fold, CD4 SP fourfold, and CD8 100-fold, whereas the total DN cell population was largely unaffected (Fig. 3 C). Recently, SWI–SNF-related complexes have been implicated in the coordinated tran-scriptional regulation of CD4 (repression) and CD8 (acti-vation) in developing thymocytes (11). Therefore, we hy-pothesized that the CD4 SP cells present in the tBrg1
Figure 2. Thymic defects in tBrg1 mutant mice. (A and B) Gross morphology of control (A)
versus tBrg1 mutant (B) thymi of 4-wk-old
animals. Arrows indicate bi-lobed thymus above heart in upper thoracic cavity. Heart (Ht) and lung (Lg) tissue are indicated. (C) Bar graph representa-tion of mutant body weights. Bars represent averages
of tBrg1 weights at weaning from multiple litters
(left: female, n 5; right: male, n 6) expressed as
percent of wild-type body weight (littermate
con-trols). (D) Total thymic cellularity (106) in control
versus tBrg1 mice. Solid bars represent average
values of total cell counts from individual mice ().
control, n 8; mutant mice, n 8. (E–H)
Hema-toxylin and eosin–stained sections of control (E and G) and mutant (F and H) thymus. (F) Demonstrates loss of cortico-medullary (M, medulla; Cx, cortex) architecture in the mutant thymus at low
magnifi-cation (10). (H) Arrows indicate increased
apop-totic bodies (Ap) and miapop-totic figures (Mt) observed
mutant thymus constitute an immature T cell population that aberrantly express CD4 (derepression) at the DN stages in the absence of Brg1 function. Examination of TCR sur-face levels in mutant and control CD4 SP cells confirmed this hypothesis, with 5% of CD4 mutant thymocytes expressing high levels of the TCR compared with 90% TCR observed in control mature CD4 SP cells (Fig. 3 D). Moreover, direct examination of CD4 expression at the DN stages demonstrated significant increases of CD4 levels in mutant thymocytes at DN2, DN3, and DN4 (Fig. 4, B and C). Finally, PCR analysis on mutant CD4 and CD4 DN3 thymocytes revealed a much higher percent-age of mutant cells in the CD4 derepressed class than the CD4 cell population (see Fig. 6, bottom). Taken together, these data indicate that loss of Brg1 function in developing thymocytes results in CD4 derepression and a block at the DN stages of T cell development.
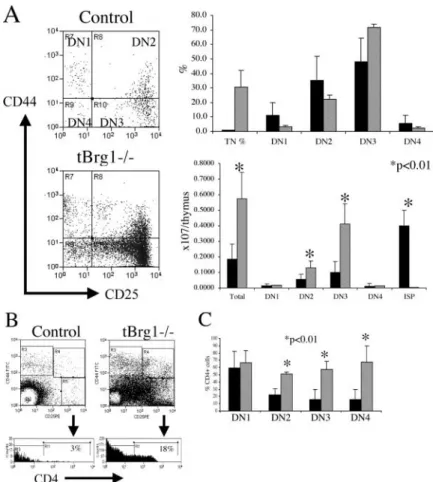
To determine more precisely at which stage the devel-opmental block occurred in the tBrg mutant mice, DN thymocytes were subdivided into four distinct develop-mental stages (DN1, DN2, DN3, and DN4) based on cell
surface expression of CD25 and CD44 expression on TN thymocytes (Figs. 4 A and 1 C). On a percentage basis, tBrg1 mice showed a relative increase in TN cells, as predicted by the loss of the DP population (see above), and this increased percentage translated into an increase in absolute terms as the total number of TN cells was signifi-cantly higher than in controls (Fig. 4 A). Examination of the DN1→DN4 populations from the mutant thymus re-vealed the total TN increase was attributed to increased DN2 and DN3 populations (Fig. 4 A), suggesting a devel-opmental block and/or increased proliferation at these stages that should be reflected by decreased or increased DN4 population, respectively (Fig. 4 A). However, DN4 cell counts were similar in mutant compared with con-trols. This is most likely explained by CD4 derepression occurring in mutant thymocytes transitioning from DN2/ DN3→DN4 stages (Fig. 4 B), which would exclude this population from DN4 cell counts. Given the almost com-plete deletion of the floxed allele at the DN4 stage, it is not clear why this population was not uniformly affected (CD4 derepression). In DN4 cells that have undergone
Figure 3. Block in T cell development at the DN stages
in tBrg1 mice. (A) Flow cytometric analysis of CD4
versus CD8 expression on thymocytes from 4-wk-old
tBrg1 mutant and control littermates. (B) Bar diagram
showing average percentages for CD4 CD8 (DP), CD4
SP, CD8 SP, and CD4 CD8 (DN) subpopulations. Solid
bars represent percentages from control mice (n 9) and
hatched bars represent tBrg1 thymic populations (n 9).
(C) Absolute cell numbers (107/thymus) for thymocyte
subsets described in B were calculated and are shown as bar
diagrams. Solid bars (control) and hatched bars (tBrg1)
represent average values. *, statistical significance calculated
using the Student’s t test (p-value indicated). (D) Analysis
of TCR (CD3) surface levels in CD4 SP thymocytes in
control (top) versus mutant (bottom). A low percentage of
CD4 SP cells in tBrg1 mice express TCR compared
Cre-mediated recombination but do not express CD4, it is likely that residual Brg1 protein–loaded prior loss of the floxed allele is sufficient to repress CD4 expression at this stage. Regardless, the remaining DN4 cells were blocked in differentiation based on the absence of DP cells. In sup-port of a DN4 to DP block, immature CD8 SP cells, the immediate precursors of the DP stage, are severely re-duced in the mutant thymus (Fig. 4 A). Complicating this interpretation, however, is data implicating the SWI–SNF complex in direct regulation of CD8 expression (11). Therefore, it is unclear whether the reductions in cell numbers at the immature SP stage are due to block before this stage or fail to activate CD8 expression. Taken to-gether, these data are consistent with developmental ab-normalities beginning at the DN2/DN3 stage and subse-quently with a block at the DN4→DP transition in tBrg1 thymocytes.
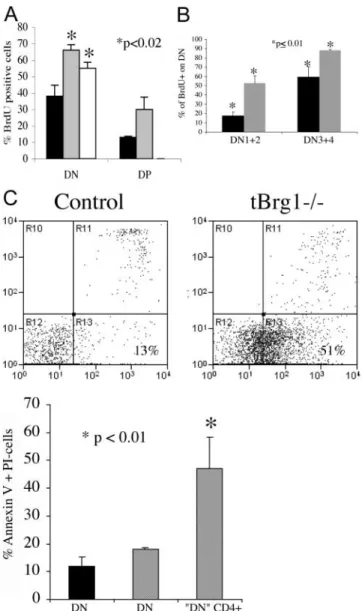
Increased Cell Proliferation and Apoptosis in tBrg1 Imma-ture Thymocytes. To further investigate the increases in DN2/DN3 populations and determine the fate of the CD4 CD3 thymocytes, the proliferative status of mutant thymocytes was measured through in vivo BrdU incorpo-ration. In tBrg1 mice, BrdU incorporation was signifi-cantly higher in both the DN and CD4 derepressed imma-ture cell populations compared with controls (Fig. 5 A). Additionally, a slightly higher percentage of DP cells stained positive for BrdU, however the low numbers of DP cells present in the mutant thymus make this data
unre-liable. To characterize the proliferative status at the imma-ture stages, DN cell populations were divided into two subclasses based on CD44 expression: CD44 (DN12) and CD44 (DN34). Interestingly, both subclasses showed an increased percentage of BrdU cells in the mu-tant thymus (Fig. 5 B), indicating increased cell prolifera-tion throughout the DN stages. This result is consistent with the histological observation of increased mitotic fig-ures in the mutant thymus and increased total cell numbers at DN2 and DN3 in mutant mice (Figs. 2 H and 4 A).
Although the increased proliferation observed in the tBrg1 mice is consistent with an increase in total TN cells (Fig. 4 A), the severe reduction in total thymocytes present in mutant thymus cannot be fully explained by the inability of cells to proliferate. Therefore, we used the an-nexin V staining method to assay the percentage of cells undergoing apoptosis (21). Analysis of annexin V staining revealed a slight increase in the percentage of apoptotic DN thymocytes in mutant compared with controls (Fig. 5 C). Although these differences are unlikely to account for the massive cell loss in the mutant thymus, examination of annexin V staining in the mutant CD4 derepressed class (CD4 CD8 CD3) did demonstrate high percentages of cells undergoing apoptosis (Fig. 5 C; P 0.01). These data are consistent with increased numbers of apoptotic bodies observed through histological analysis (Fig. 2 H). Taken together, these data suggest that loss of Brg1 triggers an in-crease in cell proliferation, derepression of CD4, and
sub-Figure 4. Loss of Brg1 derepresses CD4 expression and induces arrest at the DN stages of thymocyte development. (A) Flow cytometric analysis of early thymocyte precursors
in control (top) versus tBrg1 mutant (bottom). TN
(CD4 CD8 CD3) cells were analyzed for expression of
CD44 and CD25 (DN1 through DN4 stages, Fig. 1 C). Bar graph (top right) representing average percentages of the different subsets DN1, DN2, DN3, and DN4 in control (solid bars) versus mutant (hatched bars). Lower right bar
graph represents absolute cell numbers (107) for the subsets
described in Fig. 1 C. tBrg1 mice are represented by
hatched bars (n 3) and control population are
repre-sented by solid bars (n 3). (B) Flow sorting scheme to
investigate CD4 expression at DN stages in control (left)
versus tBrg1 mutant (right). TCR/low cells were
sub-divided into DN1→DN4 (Fig. 1 C, top) and then analyzed
for CD4 expression at the DN3 stage (bottom; reference 11). (C) Bar graph representing percentage of DN
(DN1→DN4) cells that express CD4. Solid bars represent
average value from controls (n 3) and hatched bars
represent average value from tBrg1 mutant (n 3).
sequently, programmed cell death at the DN stages of T cell development.
Brm and pre-TCR Expression Are Independent of Brg1.
Based on the timing and severity of defects in Brg1 -defi-cient thymocyte development, we investigated potential molecular abnormalities associated with the observed thy-mic phenotype. Specifically, we examined whether the loss of Brg1 affected the expression of Brm, another
SWI–SNF-related catalytic subunit often coordinately down-regulated in human tumor cell lines (22). As shown in Fig. 6, CD4 derepressed DN3 thymocytes exhibit efficient recombina-tion of the floxed allele, indicating high proporrecombina-tion of mu-tant cells, but similar levels of Brm expression through semiquantitative RT-PCR analysis, indicating that Brm ex-pression is independent of Brg1 and does not contribute to the severity of the thymic phenotype. Additionally, we ex-amined the expression of two components of the pre-TCR complex (TCR and CD3), which, when mutated, block thymocyte development at the DN3→DN4 transition (23). Both TCR and CD3 were expressed at similar lev-els in mutant and control DN3 thymocytes (Fig. 6), sug-gesting that Brg1 deletion impairs thymocyte developmen-tal processes downstream of pre-TCR assembly.
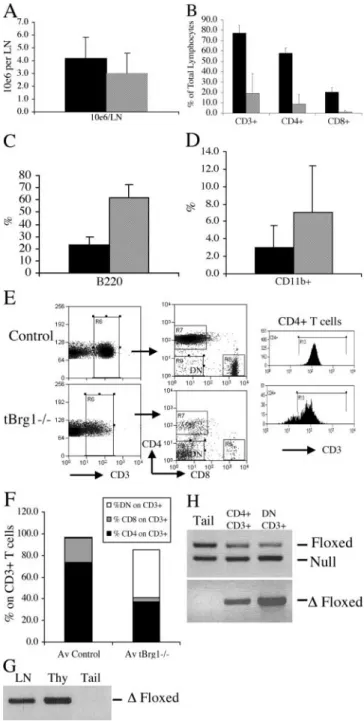
Cell Populations in the Periphery of tBrg1 Mice. To as-sess the degree of developmental block in the thymus and to determine whether Brg1 function is required for the survival of mature T cells, we used FACS® on LN and spleen cells to examine peripheral T cell populations in tBrg1 mice. Surprisingly, CD4/CD8 staining of peripheral lymphocytes indicated mature CD4 and CD8 cells present in the pe-riphery of the mutant animals, although at significantly re-duced levels, suggesting an incomplete developmental block in the thymus and/or failure of Cre-mediated recombina-tion in a low percentage of “escaping” cells. To address this issue, we performed PCR amplification for the presence of the deleted floxed allele in whole LN preparations from mu-tant animals. Results from this analysis demonstrated that
Brg1 mutant cells were present in the LN, suggesting that the peripheral T cells were not exclusively cells that had es-caped Cre-mediated recombination (Fig. 7 G).
Although total LN cell counts were similar in mutant compared with control (Fig. 7 A), TCR cells were re-duced fourfold in mutant mice with both the CD4 and
Figure 5. Cell proliferation and cell death at immature stages of T cell
development in tBrg1 mice. (A) Bar graph representing average
per-centages of cells staining positive for BrdU incorporation on FACS®.
Immature stages represent control DN (solid bar, n 3), mutant DN
(gray bar, n 3), and mutant CD4 derepressed subpopulation (CD4
CD8 CD3, open bar, n 3). *, statistical significance using Student’s t
test (p-value indicated). (B) Average percentage of BrdU incorporation at the DN1/DN2 and DN3/DN4 stages in control (solid bar) versus mutant
(hatched bar). (C) Annexin V/PI staining of apoptotic cells on CD4 cells
from mutant versus control (top). Bar graph representation (bottom) of
percentage of cell staining positive for annexin V/PI. Solid bar indicates
percentage of cells from control DN (CD4 CD8, n 3). Hatched bars
indicate percentage of apoptotic cells from tBrg1 mutant in total DN
and CD4 derepressed class (CD4 CD8 CD3, n 3).
Figure 6. Expression analysis of Brg and TCR at the DN3 stage.
RT-PCR measuring Brm, TCR, and CD3 expression in control (C),
mutant (M), CD4 (4), and CD4 (4) DN3 cells. actin was used as
CD8 populations significantly underrepresented (seven-fold and 20-(seven-fold, respectively; Fig. 7 B). Increased numbers of B cells and myeloid cells compensate for the reduced numbers of T cells in the mutant LN and account for the equivalent total LN cellularity observed (Fig. 7, C and D). Interestingly, analysis of CD4 and CD8 expression on CD3 cells revealed a significant increase in DN TCR cells (CD4 CD8 CD3; Fig. 7 E, middle, and F). This result could potentially be explained by increased percent-ages of -TCR (CD4 CD8) T cells due to loss of -TCR T cells in the periphery. However, calculation of to-tal DN CD3 T cells indicated an increase in absolute number of this cell type in tBrg1 compared with con-trols (1.5 0.2 105 vs. 0.6 0.1 105; P 0.01). FACS® analysis for -TCR cells in LN populations re-vealed that 80 9.4% of mutant DN CD3 cells are -TCR compared with 28.7 3% in controls. Similarly, absolute numbers of -TCR T cells were increased in mutants (1.2 0.12 105 in mutant vs. 0.18 0.05 105 in controls; P 0.01). This result was surprising given that the size of the -TCR T cell population has been shown to be regulated independently of the -TCR T cell population (24). Additionally, significantly higher numbers of CD4 T cells stained positive for -TCR in mutant compared with controls (20.1% or 0.15 0.03 105 vs. 0.05% or 0.07 0.0105 in controls; P 0.05) and likely represent -TCR T cells that have undergone CD4 derepression (see above). The lck proximal promoter has been shown to be active at the DN1 stage before / lineage commitment (Fig. 1 C; reference 25) and raised the possibility that Brg1 inactivation in these early stages of T cell development influenced / cell fate decisions in the thymus. Arguing against this interpretation, absolute numbers of -TCR cells were not significantly increased in the mutant thymus (1.45 0.6 106 in mutant vs. 1.04 0.3 106 in control) and suggested the increase in
-TCR cells in mutants is due to peripheral expansion of this population. If this expansion in -TCR cells were a direct result of loss of Brg1 function, a prediction would be high percentages of Brg1 mutant cells in this cell type. Therefore, we performed PCR analysis on CD4 CD8 CD3 and DN CD3 flow-sorted populations to test whether mutant cells contributed exclusively to the DN CD3 population. This prediction was not borne out ex-perimentally, however, because both the CD4 SP and the DN populations amplified with primers specific for the re-combined floxed allele (Fig. 7 H), indicating mutant cell contribution to both cell types. To examine relative contri-bution of mutant cells to these cell populations, we ampli-fied the unrecombined floxed allele and null alleles (the tar-geted null mutation and the wild-type allele amplify the same 230-bp fragment, which is different from the 387-bp
Figure 7. Peripheral T cell populations in tBrg1 mice. (A) Total LN
cell counts represented in bar graph format for control (solid bars, n 9)
and mutant (hatched bars, n 11). (B) Bar graph representation of
per-centages of CD3, CD4, and CD8 cells in control (solid bars, n 9)
and mutant (hatched bars, n 11) LN. (C and D) Percentages of B cells
(B220, C), and myeloid (CD11b, D) are represented in bar graph
format for control (solid bars, n 9) and mutant (hatched bars, n 11).
(E) Flow sorting analysis for CD4 and CD8 expression on CD3
lympho-cytes (left and middle) revealing increased DN (CD4 CD8 CD3) cell
populations in mutant LNs (middle). Histogram comparing TCR (CD3)
surface levels on mutant and control CD4 cells (right). (F) Average
percentage of CD4, CD8, and CD4 CD8 (DN) on CD3 T cells.
Increased DN percentages in mutant mice are represented by open bar.
CD4 CD3 (solid) and CD8 CD3 (hatched) percentages are shown
for mutant (tBrg1, n 11) and control (n 9). (G and H) Presence of
Brg1 mutant lymphocytes in the periphery. In G, whole LN DNA
prepa-rations from mutant animals were tested for amplification of the floxed
allele (primer set 1/3). Thymus (Thy) served as a positive control and tail
DNA as a negative control. PCR analysis of flow-sorted CD4 (CD4
CD8 CD3) and CD4 (CD4 CD8 CD3) populations from tBrg1
fragment for the floxed allele). Comparison of unrecom-bined floxed versus wild-type band intensity allowed us to estimate the percentage of undeleted floxed allele lost due to Cre-mediated conversion to flox. We determined 25% of the CD4 CD8 CD3 cells and 40% of the DN CD3 population were mutant for Brg1. Given that 20% of CD4 CD8 CD3 and 80% of DN CD3 cells are -TCR, it raises the possibility that most of the Brg1 mutant cells are -TCR cells. In this scenario, loss of Brg1 might be less detrimental to -TCR cells and therefore allows for survival of this cell type. However, the inability to sep-arate mutant (undergone Cre-mediated recombination) and heterozygous (escaped Cre-mediated recombination) T cells precludes direct examination of TCR or CD4/CD8 expression on mutant T cells. Although, significantly, these results suggest that, at least in the mature T cell lineage, Brg1 is not a general cell survival factor. In addition, loss of
Brg1 function in this lineage does not lead to increased
in-cidence of cancer due to the absence of T cell neoplasia (leukemia and/or lymphomas) in a cohort of mutants aged over 18 mo.
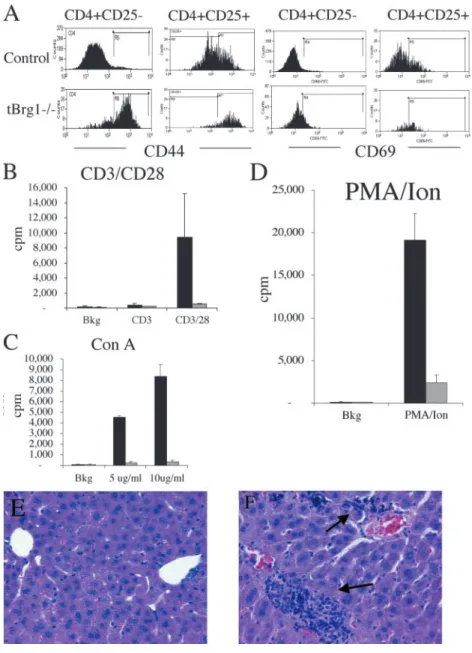
Functional Characteristics of T Lymphocytes from tBrg1 Mutant Mice. Taking advantage of this “mosaic” (with re-spect to Brg1 functional status) population of T cells, we sought to investigate potential T cell functional abnormali-ties, either cell autonomous or noncell autonomous, attrib-uted to Brg1 mutation. FACS® analysis of CD4 T lym-phocytes from tBrg1 mutant mice revealed reduced surface levels of the TCR (Fig. 7 E), which has been impli-cated as a hallmark of TCR-mediated activation of T cells (26). Moreover, expression levels of CD44 and CD69, markers that are up-regulated upon naive T cell activation, were found to be increased on these T cells (Fig. 8 A). In addition to marking activated T cells, CD44 up-regulation has been shown to persist into the memory pool (27). Therefore, the dramatic up-regulation observed in tBrg1
Figure 8. Functional characteristics of T
lym-phocytes from tBrg1 mice. (A) FACS® analysis
of CD44 and CD69 on mutant and control CD4
peripheral T cells (70% of cells CD44 in mutant vs.
10% CD4 CD44 in controls) indicates that these cells are effector cells or that they have undergone prior activa-tion and are memory-like T cells. To distinguish between these possibilities, we used IL-2R (CD25), another marker shown to be expressed on activated T cells, in con-cert with CD44 and CD69, an early marker of activation. Triple staining experiments indicated a moderate increase in CD4 CD25 CD44 (78.7 2.1% in mutant vs. 32.8 2.5% in controls) and CD4 CD25 CD69 (45.0 9.0% in mutant vs. 31.5 6.0% in controls) cells in mutant mice (Fig. 8 A). Collectively, these data demonstrate that mature T cells in the periphery of tBrg1 mice display features indicative of conversion of naive T cells to activated and/or memory-like state. Similar memory-like T cell phenotypes are characteristic of naive T cells that proliferate (called homeostatic proliferation) in response to conditions of lymphopenia after adoptive transfer into sublethally irra-diated or genetically modified T cell–deficient hosts (28). The severe block in thymocyte development and the low numbers of DP cells in the tBrg1 mice suggests that the lymphopenic environment created by Brg1 mutation in the mouse induces homeostatic proliferation of peripheral T cells.
To examine the functional consequences of loss of Brg1
function in peripheral mature T cells, we determined in vitro proliferative responses to a number of stimuli includ-ing TCR cross-linkinclud-ing usinclud-ing anti-CD3 or anti-CD3 plus anti-CD28, Con A, and PMA/Ion. Activation of total LN cells from tBrg1 showed a significant reduction in T cell proliferative response for CD3 alone or CD3/CD28, two different concentrations of Con A, and PMA/Ion stimula-tion when compared with controls (Fig. 8, B–D). Signifi-cantly, these results indicate that tBrg1 mutant LNs can-not mount a significant T cell response and therefore can be classified as immunodeficient mice. Taken together, these results indicate that in tBrg1 mice, a small number of mutant and unrecombined heterozygous T cells escape the developmental block in the thymus and undergo lim-ited homeostatic proliferation in the periphery that con-verts them to activated/memory-like T cells. These popu-lations of T cells do not, however, completely fill the periphery, which results in immunodeficiency.
Aging of tBrg1 Mice Revealed Low Penetrance Lethality and Rectal Prolapse. The biological consequence, in terms of overall animal health, attributed to Brg1 mutation in the T cell lineage was manifest at weaning (runting; Fig. 2 C) and throughout subsequent aging over a 12-mo period. Aging of mutant animals revealed low penetrance lethality. Roughly 15% of mutant animals (7 out of 49) died prema-turely over a 12-mo period, whereas no lethality was observed in littermate control (/floxed; lck-Cre and wild-type) animals (0 out of 72) over the same period. Further-more, 20% (11 out of 49 in mutant vs. 0 out of 72 in controls) of mutant animals exhibited rectal prolapse over this aging period, although there was no correlation be-tween the prolapsed rectums and premature lethality
phe-notypes. Based on the immunodeficiency observed in tBrg1 mice, these whole animal phenotypes were unex-pected, as other immunologically compromised mice, such as RAG-deficient and nude mice, thrive in specific patho-gen-free facilities similar to the one housing tBrg1 mice. Recently, it has been reported that infection of SCID/Ncr and nude mice with Helicobacter (Helicobacter hepaticus and
Helicobacter bilis) results in large bowel disease clinically de-tected by rectal prolapse (29, 30) and, in the case of H. he-paticus, mild periportal lymphocyte infiltration of the liver (31). Therefore, we sought to investigate whether endoge-nous Helicobacter infection was the causative agent of illness in tBrg1 mice. Indeed, fecal samples from our colony tested positive for both H. hepaticus and H. bilis using PCR analysis specific for these pathogenic bacteria (unpublished data). Moreover, hematoxylin and eosin–stained sections of mutant liver revealed mild to moderate periportal lympho-cyte (mixed lineage) infiltration in tBrg1 mice and not in controls (compare G and H in Fig. 8). These results sug-gest that endogenous Helicobacter infections contribute to the health problems in immunodeficiency associated with
Brg1 mutation in the T cell lineage.
Discussion
Considerable interest in ATP-dependent chromatin-remodeling complexes has focused on delineating biochemi-cal interactions and molecular mechanisms functioning at promoters to influence transcriptional regulation. These studies do not, however, address the function of these complexes in vivo and significantly less is known about the function of these complexes in the context of global gene regulation. The peri-implantation lethality observed in
Brg1 homozygous mutant mice demonstrated the impor-tance of these complexes in early development but pre-cluded further functional studies in cell lineages later in embryogenesis or adults. Here, we provide further insight into the function of Brg1 in an adult cell lineage by show-ing that the Brg1 complex is required for T cell develop-ment at the DN→DP transition but not for cell survival of mature T lymphocytes.
shown to stimulate the cleavage and processing of DNA by RAG1 and RAG2 in V(D)J recombination (32). However, this is an unlikely explanation for the developmental block observed in tBrg1 thymocytes because TCR- recom-bination and expression are unaffected by the loss of Brg1
function (Fig. 6; reference 33). Interestingly, a similar block beyond the DN3 stage has been found in mice mutant for N-CoR, a chromatin-modifying complex that has been shown to contain Brg1, suggesting that the coordinated ef-fort of multiple chromatin-modifying complexes are re-quired for transition to the DP stage (34). The loss of the Brg1–N-CoR complex function is unlikely to fully explain the tBrg1 phenotype, however, because injection of anti-CD3, an antibody that mimics pre-TCR signaling, promotes DN→DP transition in N-CoR thymocytes whereas in SWI–SNF-related mutant thymocytes it does not (33, 34). This result implicates the Brg1-containing complex(s) in mediating events downstream of the pre-TCR complex.
Signals emanating from the pre-TCR induce the cell proliferation and differentiation required for transition to the DP stage, raising the possibility that Brg1 is required for regulation of genes essential for these processes. In-deed, BrdU incorporation in tBrg1 thymocytes re-vealed increased cell proliferation at the DN stages, indi-cating a cell cycle defect. Interestingly, Brg1 has been shown to interact with the retinoblastoma (Rb) and cyclin E gene products, both of which are required for the G1/S phase transition (35). Based on these data, it has been sug-gested that Brg1 is a critical regulator of cell cycle progres-sion and tumor suppresprogres-sion. This notion is consistent with an increase in total TN thymocytes in mutants, however, the severe reduction in total thymocytes, owing to an al-most complete loss of DP cells, suggests a mechanism of active cell elimination before the DP stage. Indeed, using CD4 derepression to mark mutant cells, we observed in-creased apoptotic rates in DN populations, suggesting a coupling of cell proliferation to programmed cell death. In addition to the well-established role of Rb loss in tumor progression, a similar coupling of proliferation to apoptosis (p53-mediated) has been associated with Rb deficiency in a variety of cell types in animal models (35). In support of a similar Rb/E2F/p53 pathway operating in the thymic de-velopment, disruption of E2F1 leads to suppression of apoptosis and results in excess mature T cells (36). More-over, p53 deficiency rescues the block in pre–T cell differ-entiation associated with CD3 mutation (37). Therefore, given the interaction between Brg1 and Rb pathway, loss of Brg1 leading to aberrant Rb function, increased E2F-mediated transcription, and induction of p53-E2F-mediated ap-optotic pathways provide a plausible explanation for the defects in thymocyte development in tBrg1 mice. However, we cannot rule out a role for Brg1 in the cell survival–independent differentiation program underlying transition to the DP stage.
Due to the high efficiency of Cre-mediated recombina-tion at the DN4 stage in /floxed; lck-Cre mice and the
se-verity of developmental block (low numbers of DP cells) in the thymus of tBrg1 mice, an unexpected result of our study was the presence of mature T cells in the periphery of these mutants. These T cell populations were shown to be a mixture of mutant and heterozygous (unrecombined floxed) cells, ruling out defective Cre-mediated recombi-nation as the sole explarecombi-nation for survival of these T lym-phocytes. A parsimonious explanation for the survival of mutant cells is that in a small percentage of thymocytes, Cre-mediated recombination occurs relatively late in the DN4 stage and protein stability allows for clearing of key checkpoints required for further maturation. The mere ex-istence of mature mutant T cells indicates that in contrast to developing thymocytes, Brg1 is not required for survival of this more differentiated cell type. One could argue that because the Brg1 mutation induced cell death at a highly proliferative stage of thymocyte development ( selection), perhaps Brg1 would not be expected for survival in the more quiescent circulating mature T cell. Arguing against this view, however, is evidence for homeostatic prolifera-tion occurring in the lymphopenic environment of tBrg1 mice. Interestingly, homeostatic proliferation of the lim-ited number of surviving cells did not fully reconstitute pe-ripheral T cell populations, contrary to the notion that a single T cell clone stimulated to generate memory T cells can fill the activated peripheral T cell pool (24, 38). Our results are consistent with more recent reports showing that limited numbers of naive T cells cannot fully reconstitute the periphery (39), indicating that loss of Brg1 in these cells might not affect homeostasis, per se. The loss of Brg1 func-tion did not, however, lead to deregulated cell proliferafunc-tion and T cell–derived tumor formation in mutant animals aged over 18 mo, which stands in contrast to the high inci-dence of CD8 lymphomas observed through conditional inactivation of SNF5, another SWI–SNF-related complex member (40). Importantly, this finding supports the notion that the putative tumor suppressor function associated with
Brg1 loss of function mutations in neoplasms of humans and mice is tissue and cell type dependent and further, does not predispose cells of the mature T cell lineage to onco-genic transformation. Thus, taken together these results suggest that Brg1 has inherently different functions with re-spect to cell survival and proliferation at different stages of T cell lineage specification.
We thank Daniel Metzger and Pierre Chambon for the Brg1 floxed allele, Yuan Zhuang for the lck-Cre mice, and Gail Martin for the Zp3-Cre mice. We are also grateful to members of the Magnuson and Su labs for useful discussions and advice.
This work was supported by grants from the National Institutes of Health to T. Magnuson and L. Su.
Submitted: 1 May 2003 Accepted: 4 November 2003
References
Im-munol. 17:149–187.
2. Workman, J.L., and R.E. Kingston. 1998. Alteration of nu-cleosome structure as a mechanism of transcriptional regula-tion. Annu. Rev. Biochem. 67:545–579.
3. Narlikar, G.J., H.Y. Fan, and R.E. Kingston. 2002. Coopera-tion between complexes that regulate chromatin structure and transcription. Cell. 108:475–487.
4. Bultman, S., T. Gebuhr, D. Yee, C. La Mantia, J. Nicholson, A. Gilliam, F. Randazzo, D. Metzger, P. Chambon, G. Crabtree, et al. 2000. A Brg1 null mutation in the mouse re-veals functional differences among mammalian SWI/SNF complexes. Mol. Cell. 6:1287–1295.
5. Klochendler-Yeivin, A., L. Fiette, J. Barra, C. Muchardt, C. Babinet, and M. Yaniv. 2000. The murine SNF5/INI1 chro-matin remodeling factor is essential for embryonic develop-ment and tumor suppression. EMBO Rep. 1:500–506. 6. Roberts, C.W., S.A. Galusha, M.E. McMenamin, C.D.
Fletcher, and S.H. Orkin. 2000. Haploinsufficiency of Snf5 (integrase interactor 1) predisposes to malignant rhabdoid tu-mors in mice. Proc. Natl. Acad. Sci. USA. 97:13796–13800. 7. Kim, J.K., S.O. Huh, H. Choi, K.S. Lee, D. Shin, C. Lee,
J.S. Nam, H. Kim, H. Chung, H.W. Lee, et al. 2001. Srg3, a mouse homolog of yeast SWI3, is essential for early embryo-genesis and involved in brain development. Mol. Cell. Biol. 21:7787–7795.
8. Smale, S.T., and A.G. Fisher. 2002. Chromatin structure and gene regulation in the immune system. Annu. Rev. Immunol. 20:427–462.
9. Georgopoulos, K. 2002. Haematopoietic cell-fate decisions, chromatin regulation and ikaros. Nat. Rev. Immunol. 2:162– 174.
10. Yeh, J.H., S. Spicuglia, S. Kumar, A. Sanchez-Sevilla, P. Fer-rier, and J. Imbert. 2002. Control of IL-2Ralpha gene ex-pression: structural changes within the proximal enhancer/ core promoter during T-cell development. Nucleic Acids Res. 30:1944–1951.
11. Chi, T.H., M. Wan, K. Zhao, I. Taniuchi, L. Chen, D.R. Littman, and G.R. Crabtree. 2002. Reciprocal regulation of CD4/CD8 expression by SWI/SNF-like BAF complexes. Nature. 418:195–199.
12. Zhao, K., W. Wang, O.J. Rando, Y. Xue, K. Swiderek, A. Kuo, and G.R. Crabtree. 1998. Rapid and phosphoinositol-dependent binding of the SWI/SNF-like BAF complex to chromatin after T lymphocyte receptor signaling. Cell. 95: 625–636.
13. Geiman, T.M., and K. Muegge. 2000. Lsh, an SNF2/helicase family member, is required for proliferation of mature T lym-phocytes. Proc. Natl. Acad. Sci. USA. 97:4772–4777. 14. Pan, L., J. Hanrahan, J. Li, L.P. Hale, and Y. Zhuang. 2002.
An analysis of T cell intrinsic roles of E2A by conditional gene disruption in the thymus. J. Immunol. 168:3923–3932. 15. Lewandoski, M., K.M. Wassarman, and G.R. Martin. 1997.
Zp3-cre, a transgenic mouse line for the activation or inacti-vation of loxP-flanked target genes specifically in the female germ line. Curr. Biol. 7:148–151.
16. Sumi-Ichinose, C., H. Ichinose, D. Metzger, and P. Cham-bon. 1997. SNF2beta-BRG1 is essential for the viability of F9 murine embryonal carcinoma cells. Mol. Cell. Biol. 17: 5976–5986.
17. Wakabayashi, Y., H. Watanabe, J. Inoue, N. Takeda, J. Sakata, Y. Mishima, J. Hitomi, T. Yamamoto, M. Utsuyama, O. Niwa, et al. 2003. Bcl11b is required for differentiation and survival of alphabeta T lymphocytes. Nat. Immunol.
4:533–539.
18. Nutt, S.L., B. Heavey, A.G. Rolink, and M. Busslinger. 1999. Commitment to the B-lymphoid lineage depends on the transcription factor Pax5. Nature. 401:556–562.
19. Lucas, B., F. Vasseur, and C. Penit. 1994. Production, selec-tion, and maturation of thymocytes with high surface density of TCR. J. Immunol. 153:53–62.
20. Kovalev, G.I., D.S. Franklin, V.M. Coffield, Y. Xiong, and L. Su. 2001. An important role of CDK inhibitor p18(INK4c) in modulating antigen receptor-mediated T cell proliferation. J. Immunol. 167:3285–3292.
21. Vermes, I., C. Haanen, H. Steffens-Nakken, and C. Reutel-ingsperger. 1995. A novel assay for apoptosis. Flow cytomet-ric detection of phosphatidylserine expression on early apop-totic cells using fluorescein labelled Annexin V. J. Immunol. Methods. 184:39–51.
22. Reisman, D.N., M.W. Strobeck, B.L. Betz, J. Sciariotta, W. Funkhouser, Jr., C. Murchardt, M. Yaniv, L.S. Sherman, E.S. Knudsen, and B.E. Weissman. 2002. Concomitant down-regulation of BRM and BRG1 in human tumor cell lines: differential effects on RB-mediated growth arrest vs CD44 expression. Oncogene. 21:1196–1207.
23. Fischer, A., and B. Malissen. 1998. Natural and engineered disorders of lymphocyte development. Science. 280:237–243. 24. Freitas, A.A., and B. Rocha. 2000. Population biology of
lymphocytes: the flight for survival. Annu. Rev. Immunol. 18: 83–111.
25. Shimizu, C., H. Kawamoto, M. Yamashita, M. Kimura, E. Kondou, Y. Kaneko, S. Okada, T. Tokuhisa, M. Yokoyama, M. Taniguchi, et al. 2001. Progression of T cell lineage re-striction in the earliest subpopulation of murine adult thymus visualized by the expression of lck proximal promoter activ-ity. Int. Immunol. 13:105–117.
26. Valitutti, S., S. Muller, M. Dessing, and A. Lanzavecchia. 1996. Different responses are elicited in cytotoxic T lympho-cytes by different levels of T cell receptor occupancy. J. Exp. Med. 183:1917–1921.
27. Tough, D.F., and J. Sprent. 1994. Turnover of naive- and memory-phenotype T cells. J. Exp. Med. 179:1127–1135. 28. Jameson, S.C. 2002. Maintaining the norm: T-cell
homeosta-sis. Nat. Rev. Immunol. 2:547–556.
29. Ward, J.M., M.R. Anver, D.C. Haines, J.M. Melhorn, P. Gorelick, L. Yan, and J.G. Fox. 1996. Inflammatory large bowel disease in immunodeficient mice naturally infected with Helicobacter hepaticus. Lab. Anim. Sci. 46:15–20.
30. Shomer, N.H., C.A. Dangler, M.D. Schrenzel, and J.G. Fox. 1997. Helicobacter bilis-induced inflammatory bowel disease in scid mice with defined flora. Infect. Immun. 65:4858–4864. 31. Li, X., J.G. Fox, M.T. Whary, L. Yan, B. Shames, and Z.
Zhao. 1998. SCID/NCr mice naturally infected with Helico-bacter hepaticus develop progressive hepatitis, proliferative typhlitis, and colitis. Infect. Immun. 66:5477–5484.
32. Kwon, J., K.B. Morshead, J.R. Guyon, R.E. Kingston, and M.A. Oettinger. 2000. Histone acetylation and hSWI/SNF remodeling act in concert to stimulate V(D)J cleavage of nu-cleosomal DNA. Mol. Cell. 6:1037–1048.
33. Chi, T.H., M. Wan, P.P. Lee, K. Akashi, D. Metzger, P. Chambon, C.B. Wilson, and G.R. Crabtree. 2003. Sequen-tial roles of Brg, the ATPase subunit of BAF chromatin re-modeling complexes, in thymocyte development. Immunity. 19:169–182.
E. Seto, et al. 2000. Combinatorial roles of the nuclear recep-tor corepressor in transcription and development. Cell. 102: 753–763.
35. Zhang, H.S., M. Gavin, A. Dahiya, A.A. Postigo, D. Ma, R.X. Luo, J.W. Harbour, and D.C. Dean. 2000. Exit from G1 and S phase of the cell cycle is regulated by repressor complexes containing HDAC-hSWI/SNF and Rb-hSWI/SNF. Cell. 101:79–89.
36. Field, S.J., F.Y. Tsai, F. Kuo, A.M. Zubiaga, W.G. Kaelin, Jr., D.M. Livingston, S.H. Orkin, and M.E. Greenberg. 1996. E2F-1 functions in mice to promote apoptosis and sup-press proliferation. Cell. 85:549–561.
37. Haks, M.C., P. Krimpenfort, J.H. van den Brakel, and A.M. Kruisbeek. 1999. Pre-TCR signaling and inactivation of p53
induces crucial cell survival pathways in pre-T cells. Immu-nity. 11:91–101.
38. Tanchot, C., and B. Rocha. 1997. Peripheral selection of T cell repertoires: the role of continuous thymus output. J. Exp. Med. 186:1099–1106.
39. Tanchot, C., A. Le Campion, B. Martin, S. Leaument, N. Dautigny, and B. Lucas. 2002. Conversion of naive T cells to a memory-like phenotype in lymphopenic hosts is not related to a homeostatic mechanism that fills the peripheral naive T cell pool. J. Immunol. 168:5042–5046.