CA Performance Management
Solution for Communications
Service Providers
CA Technologies
Publication Date: 23 Mar 2015 | Product code: IT0012-000102 Peter Dykes
Summary
Catalyst
Flexible and cost-effective network performance monitoring and management solutions are now more important than ever for communications service providers (CSPs) that are looking to roll out
innovative services and avoid customer churn in a fiercely competitive environment. Although more than 30% of the world’s population is now covered by 4G, the majority of the world’s communications are carried by legacy networks, both fixed and mobile, meaning CSPs are increasingly looking to consolidate management of the legacy network and the new infrastructure with a single tool.
Key findings
CSPs require a scalable management solution that provides rich visualization of performance data, predictive analytics to improve productivity, and an open and extensible architecture to integrate with other management systems, including legacy systems.
Based on support for a broad range of legacy and 4G devices and element management systems (EMSes), CA Performance Management is vendor- and technology-agnostic and normalizes, stores, analyzes, and reports all key performance indicators from all network devices and technologies in a single user interface.
The CA Performance Management portfolio has a multi-tiered, multi-threaded architecture that eliminates the bottlenecks found in older and currently competing solution architectures. As it offers a single user interface, it helps to reduce opex for multiple license fees and
maintenance contracts to monitor the range of network devices and technologies in place. CA Performance Management portfolio has the potential to take a significant share of the
telecoms operations support systems (OSS) market going forward.
Recommendations for CSPs
CA Performance Management should be considered by any CSP looking to exploit new network infrastructure to its full potential.
The solution is vertical-agnostic, making it also appropriate for web-scale large enterprise organizations across a wide range of industry sectors.
Any CSP aiming to launch a wide range of new services would do well to evaluate CA Performance Management as a potential solution to manage the complexities of providing high-quality and highly available services.
Value proposition
CA Technologies is one of the world’s top 10 management software providers. Founded in 1976 in the US, the company has solutions deployed in the majority of the Forbes Global 2000 companies as well as in government organizations and thousands of companies in diverse industries worldwide. CSPs, in particular, have recognized that effective performance management will be vital to the exploitation of new infrastructure technologies for their optical and microwave transport, Long-Term Evolution (LTE) and Ethernet backhaul, metro and carrier Ethernet, and voice-over-LTE (VoLTE) networks.
In Ovum's opinion, CA Performance Management has the potential to take a significant share of the telecoms OSS market. The ability to collect massive amounts of performance data and apply advanced analytics on the data with a cost-efficient platform puts CA Technologies’ solution on a par with those of major players in the sector. The company should be on the shortlist of potential
performance management vendors for any CSP seeking to understand what is going on within its networks and looking to exploit both legacy and next-generation networks.
Solution analysis
Functionality
CA Performance Management 2.4
CA Technologies provides a set of performance management solutions designed to monitor the world’s largest networks and data sets – current deployments exceed 50,000 devices and poll more than 2 million metrics every 15 minutes. Any CSP looking to develop a coherent Internet of Things (IoT) strategy will need this kind of functionality as a cornerstone of its “five nines” capability – the highly scalable product suite is geared toward meeting the service management needs of a wide range of CSPs.
CA Performance Management comprises a big data collection, warehousing, and analytics solution that helps CSPs and very large enterprises in manufacturing and financial services maximize the return on their network infrastructure investments and lower the cost of network operations. It monitors, stores, analyzes, and displays massive amounts of performance information for assuring quality across complex, multi-technology, multi-vendor network infrastructure. Designed for high scalability at low cost, the solution enables proactive capacity planning and problem-solving through flexible dashboards and reports, the intelligent analytics of which can unify all aspects of network monitoring, including performance, network flow, application response, and unified communications. An extensible, open architecture enables users to optimize multiple aspects of their operational requirements.
Architecture
CA Performance Management is architected to monitor Simple Network Management Protocol (SNMP)-managed devices as well as non-SNMP devices and proprietary management systems such as EMSes. This versatility means CSPs can have a single tool to manage their various networks without the excessive hosting requirements, administrative overheads, and performance bottlenecks of vendor-specific and EMS solutions based on legacy architectures. Consequently, CA Performance Management can eliminate the license fees and maintenance contracts of the multiple legacy solutions often used to monitor the range of network devices and technologies in place.
The centralized, multi-tiered architecture also comprises intelligent analytics in a more flexible user interface and greater extensibility for end-user customization and integration.The architecture consists of a centralized cluster of servers, with each server hosting the software logic for a specific function, including data collection, aggregation, and storage, along with a console for visualizing the monitored data and the analytics applied to the raw data.
Each tier of the architecture is optimized to contribute to the solution’s overall value to network operators, planners and architects, capacity planners and managers, and line-of-business executives.
Based on CA Technologies’ own research among users of competing architectures managing
large-scale networks, it claims that its architecture requires 90% fewer servers than distributed polling and data storage architectures, and 50% fewer servers than peer-to-peer appliance-based
architectures. A single collector can monitor 500,000 items using 25 million metrics, with monitoring capacity scaling linearly as collectors are added.
The solution’s centralized, multi-tiered/multi-threaded architecture is built upon three core principles: high-performance for high-scale monitoring; flexible, intelligent analytics; and solution extensibility and openness.
High performance for high-scale monitoring
The multi-tiered, multi-threaded architecture is designed to collect, store, analyze, visualize, and report on the very large data sets associated with the very large networks that the solution monitors. For example, a single collector can process 330,000 performance metrics per second. In addition, the centralized clustering of host servers and tight logical integration of the data aggregation, data
warehousing, and data processing functions enable instant normalization, correlation, analysis, and, most importantly, the display of massive amounts of monitored data. Some existing solutions can take up to 45 minutes to populate a dashboard or report. By drawing on the centralized data store,
dashboards and reports are instantly populated and all monitored data is instantly available for analysis, including export to other analytical and reporting tools.
Flexible, intelligent analytics
Based on support for a broad range of vendor devices and EMSes, CA Performance Management is vendor- and technology-agnostic and normalizes, stores, analyzes, and reports all key performance indicators from all network devices and technologies in a single user interface. Patented intelligent displays improve visualization of monitored data, anomaly detection, and trends at very high scale, enabling network operations centers (NoCs) to proactively and more efficiently manage entire networks and services in one user interface.
CA Performance Management supports third-party vendor devices and EMSes including, but not limited to, those of Alcatel-Lucent, Cisco/Starent, Ericsson, Fujitsu, Huawei, Metaswitch, Nokia Networks, Oracle/Tekelec, and ZTE. The open API allows customers to add support for alternative devices and EMSes if CA Performance Management does not provide out-of-the-box support. Work is underway to add capabilities for managing software-defined networking (SDN) and network functions virtualization (NFV) as these emerging technologies make their way into CSP and large enterprise environments.
The solution’s dashboards provide a higher density of metrics and more intelligent metrics than competitive solutions. They include patented and patent-pending metrics in business-cycle-aware heat charts, combination chart-tables, minimum-maximum gauges, trends with events charts, and scorecards. The analytical displays, combined with no-wait paging and data population, enable network engineers and NoC operators to view a massive amount of data and visually correlate it. Sophisticated thresholding and trend charts provide predictive analytics to advance capacity planning and catch problems before they seriously affect services. End users can simply click to convert a dashboard to display all data by tenant, customer, group, or location, further simplifying reporting and assuring productivity.
Extensible and open solution
CA Performance Management enables integration with operational and business support systems for importing and exporting data and customizing metrics, thresholds, and dashboards. User-friendly interfaces and role-based permissions enable network operators and engineers to extend and customize the tool so that they are more productive and less dependent on power users or manual analysis. The solution also enables the generation of personalized workflows, zero-touch monitoring and improved visualization, notifications, and reporting through self-customized dashboards.
The solution uses representational state transfer (ReST) web services and the OData 2.0 industry standard as the basis of its open application programming interface (API) to provide exceptional freedom to customize the solution. The solution’s public API provides access to monitored
configuration information and metric data, and it enables full integration with external systems such as configuration management databases (CMDBs) and business service catalogs to inform the solution to automatically initiate zero-touch monitoring of new network devices. The open API also allows for the exporting of monitored data to other tools for analytics and reporting, and the self-certification of new devices and new management information bases (MIBs) from network equipment vendors. End users can customize dashboards and reports easily via a drag-and-drop interface to build their own best-practice workflows and reports for technical and business stakeholders, without the aid of an administrator.
CA Performance Management integrates with a variety of CA Technologies products for displaying additional metrics and contextually launching into those add-on products from the CA Performance Management user interface. These include:
CA Network Flow Analysis (network flow metrics)
CA Application Delivery Analysis (application response metrics)
CA Application Performance Management (user experience and business transaction metrics) CA Unified Communications Monitor (IP voice and video metrics).
The solution can also integrate with CA Spectrum to link performance issue alerts with the root cause analysis and event management functions provided by CA Spectrum.
Go-to-market strategy
The CA Technologies go-to-market strategy is a mix of both direct and indirect channels. The company primarily uses the direct channel and systems integrators such as Tech Mahindra, Fujitsu, and Capgemini to offer its product to a range of industry verticals. The company’s technology strength and the extensibility of its product suite in the performance management sector make the solution an attractive choice for a wide range of customers in different verticals, telecoms in particular, each having infrastructures with varying degrees of complexity.
The company has a large customer base with a strong geographical presence, and the continuing technology additions to its portfolio are commendable. Overall, Ovum considers the depth and breadth of functionality in the CA Performance Management solution to be impressive.
Deployment
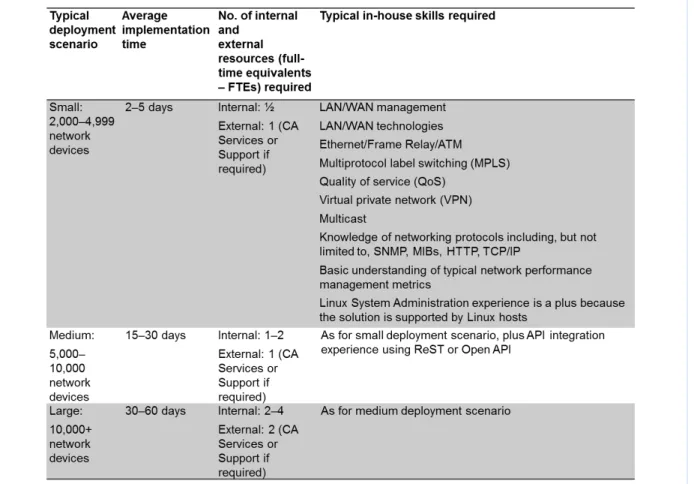
Performance management is fundamental to the efficient operation of networks of any size. However, the speed with which a new system can be deployed is also crucial. With more than 200 commercial
deployments of its CA Performance Management solution, CA Technologies has reduced the implementation time to an absolute minimum (see Figure 1), and although some in-house skills are required by the purchaser, CA Technologies provides informal on-site knowledge transfer by presales advisors and/or services. In addition, it offers formal four-day entry-level and advanced administration courses with its own instructors.
CA Technologies also offers ongoing support through its Practice Services team, which follows on from an initial deployment to offer a health check on implementation match, performance-tuning to ensure solution optimization, dashboard configuration, API integrations, and custom device
certifications. The cost of these additional services is based on the Practice Services engineer’s time and travel costs. Figure 1 below shows some typical scenarios and implementation times, although these may vary according to local conditions and requirements.
Figure 1: Typical deployment scenarios
Source: Ovum
Deployment examples
More than 200 organizations of various sizes across a number of industry verticals use the CA Performance Management solution. Among them is a major mobile wireless CSP that has deployed the solution to give it the visibility required to manage its networks as it transitions from network legacy infrastructure to 4G LTE infrastructure. The CSP was aiming to enhance services, reduce 3G customer churn, offer new revenue-generating 4G services, and build market share. At the same time, it was aggressively expanding its network footprint and deploying new infrastructure to improve 3G services and take the lead in 4G LTE services. The project involved more than 12,000 cell towers,
where separate 3G and 4G base stations were replaced by a single multi-mode base station and new software.
CA Performance Management is also used by one of the world’s largest financial services companies with 9,000 locations. Its network of more than 15,000 network devices also includes more than 12,500 ATMs and mobile devices. The challenge for its IT Operations team was to assure network availability and performance, reduce network administration overhead and monitoring costs, and transform network data into business information. The initial deployment of CA Performance Management monitors 17,000 network devices and 1.5 million items, including network elements, device subsystems, IP service-level agreements (SLAs), and class-based QoS (CBQoS). Data from CA Network Flow Analysis and CA Unified Communications Monitor are displayed in CA Performance Management dashboards through a standard out-of-the-box integration.
Data sheet
Key facts about the solution
Data sheet: CA Performance Management
Product name CA Performance Management Product classification Network Performance Management
Version number 2.4 Release date December 2014
Solution keywords Network management; network monitoring; network performance management; network performance monitoring; SNMP monitoring; network flow analysis
Geographies covered Asia-Pacific including Japan; Europe, Middle East and Africa (EMEA); Latin America; North America
Industries covered Service providers; telcos, carriers; mobile wireless carriers; cable providers; multi-system operators; managed service providers; public sector: federal, state, and local governments; commercial enterprises; education; financial services; healthcare; manufacturing; media and communications; retail; transportation
Platforms supported Linux
Relevant company sizes Medium and large Licensing options Perpetual; term
Languages supported Chinese; English; French; Italian; Japanese; Korean
Routes to market Direct sales; service providers; system integrators; resellers
Deployment options On-premise URL and email contact http://www.ca.com/us/op
scenter/ca-performance-management.aspx https://www.ca.com/us/c ontact/call-me.aspx
Company headquarters New York, NY, US European headquarters Morges, Switzerland
headquarters Source: Ovum
Appendix
Methodology
Ovum Technology Audits are independent product reviews carried out using Ovum’s evaluation model for the relevant technology area, supported by conversations with vendors, users, and service providers of the solution concerned, and in-depth secondary research.
Author
Peter Dykes, Senior Analyst, Telecoms Operations and IT, Ovum Consulting peter.dykes@ovum.com
Ovum Consulting
We hope that this analysis will help you make informed and imaginative business decisions. If you have further requirements, Ovum’s consulting team may be able to help you. For more information about Ovum’s consulting capabilities, please contact us directly at consulting@ovum.com.
Copyright notice and disclaimer
The contents of this product are protected by international copyright laws, database rights and other intellectual property rights. The owner of these rights is Informa Telecoms and Media Limited, our affiliates or other third party licensors. All product and company names and logos contained within or appearing on this product are the trademarks, service marks or trading names of their respective owners, including Informa Telecoms and Media Limited. This product may not be copied, reproduced, distributed or transmitted in any form or by any means without the prior permission of Informa
Telecoms and Media Limited.
Whilst reasonable efforts have been made to ensure that the information and content of this product was correct as at the date of first publication, neither Informa Telecoms and Media Limited nor any person engaged or employed by Informa Telecoms and Media Limited accepts any liability for any errors, omissions or other inaccuracies. Readers should independently verify any facts and figures as no liability can be accepted in this regard – readers assume full responsibility and risk accordingly for their use of such information and content.
Any views and/or opinions expressed in this product by individual authors or contributors are their personal views and/or opinions and do not necessarily reflect the views and/or opinions of Informa Telecoms and Media Limited.
CONTACT US
www.ovum.com
analystsupport@ovum.com
INTERNATIONAL OFFICES
Beijing Dubai Hong Kong Hyderabad Johannesburg London Melbourne New York San Francisco Sao Paulo Tokyo