C10: CT SBEA
Data Mining Report
Final
December 15, 2014
Table of Contents
Executive Summary ... i I. Introduction ...1 II. Methodology ...2 A. Research Objectives ...2 B. Program Data ...2 C. Customer Data ...3III. Program Data Analysis ...4
A. Projects and Time Period Studied ...4
B. Types of Facilities and Businesses ...8
C. Building Characteristics ...10
D. Usage and Demand ...11
E. Contractors ...15
F. Installed Measures ...18
G. Project Costs and Incentives ...22
H. Financing...26
I. Tracked Savings ...28
IV. Comparison to Eligible Population ...41
A. Business Segment ...41
B. Usage and Demand ...43
Executive Summary
Connecticut Light & Power and United Illuminating offer the Small Business Energy Advantage (SBEA) Program that provides an energy audit and incentives to small business owners to improve the energy efficiency of their buildings. The program provides direct installation of lighting upgrades and controls, air conditioning equipment tune-ups, and automated controls for refrigeration equipment.
The SBEA Data Mining Research aimed to help program administrators make more informed decisions about how to garner deeper and more comprehensive energy savings by examining what has and has not been accomplished through the SBEA from 2007 through 2012. The research consisted of analysis of the SBEA program databases and the utility customer databases to characterize the program and the participants, and compare the population of eligible customers to those who participated in the program.
Research Objectives
The objectives of the research were to assess and report from a third-party the following.
Assess the representation of various market sectors among the SBEA participants over the last five years, which sectors were underrepresented and which were missing.
Determine how the market sector distribution of program participants compared to those of nonparticipants.
Characterize the mix of measures installed in the program, including an examination of the nature and frequency at which measures beyond lighting were installed.
Explore the levels of savings tracked by sector.
Data
APPRISE requested a complete download of SBEA program data from CL&P and UI for projects that were undertaken between 2007 and 2012. The data received included information on program dates; project cost, incentives and financing; business type; measures installed; and usage and demand savings.
APPRISE requested customer data from CL&P and UI to merge with the program data and to provide analysis of customers who were eligible and who did and did not participate in the SBEA. The data received included business type, usage, and demand.
There was no new data collected by this study. The study never planned to generate new data. The only dataset outside of the utilities would have been if purchasing an outside vendor dataset would help in the comparison. The original plan was to purchase a dataset of businesses from
Dunn & Bradstreet that would best fit the SBEA-eligible population as best could be requested given data available in the Dunn & Bradstreet database. It was discovered that CL&P had been pulling its entire commercial and industrial (C&I) customer billing data for aggregate analyses. This data could include demand, kW, estimates which would allow an extraction to be made of the SBEA-eligible customer base to compare with SBEA participants. Utility data within a similar data format was then requested to use as the comparison dataset.
Program Data Analysis
Key findings from the program data analysis were as follows.
Projects: From 2007 through 2012 there were nearly 6,300 CL&P SBEA projects installed
and nearly 2,000 UI SBEA projects installed. The peak year for the SBEA installations was 2010 for CL&P and 2009 for UI.
Business Type: The most common types of participants were offices, retail, auto-related, and
restaurants, making up half of the projects.
Usage Intensity: Restaurant and food establishments had the greatest energy usage intensity.
While 74 percent of this facility type had over 30 kWh per square foot of facility space, other establishment types were most likely to use less than 10 kWh per square foot of space.
Demand: Mean average demand was 31 kW, but 25 percent had average demand over 33
kW. College/school, manufacturing and restaurants/food participants were most likely to have average demand over 50 kW.
Contractors: The top two contractors completed 25 percent of the SBEA jobs and the top six
contractors completed more than half of the jobs. While 42 contractors participated, 15 completed fewer than 20 jobs each over the six years studied.
Measures: While 72 percent of projects were lighting only, 16 percent had lighting and
refrigeration measures installed, ten percent had lighting and custom measures installed, and three percent had lighting and cooling, heating, or domestic hot water measures installed.
Costs and Incentives: Mean project costs were approximately $14,000 and incentives covered
approximately 40 percent of the costs on average.
Financing: Approximately 90 percent of the SBEA projects used financing. Colleges and
schools were least likely to use program financing and government was also less likely to use financing than most of the other facility types.
Savings: Projected average annual savings were 22,197 kWh per CL&P SBEA project and
18,899 kWh per UI SBEA project. Colleges/schools had the greatest mean savings by far, followed by the entertainment/gym category. Projects with other measures in addition to lighting had much higher savings.
Savings per Square Foot: Higher savings for colleges and schools followed by entertainment and gym facilities was related to their larger facility size. Restaurant/food stores, parking, and retail establishments had the greatest savings per square foot.
Percent Savings: Warehouses and parking facilities had the highest average savings as a
percentage of pre-treatment usage.
Demand Reduction: Mean annual kW savings in the program database were estimated as 5.7
kW per project. Colleges/schools had the greatest projected savings.
Comparison to Eligible Population
Participants and eligible customers were distributed similarly across business segments and corporate structures. Eligible customers had somewhat higher usage and demand than the post-program usage and demand of SBEA participants, but the differences were approximately equal to the projected reductions, indicating that these customers may have had similar usage and demand prior to program participation.
Overall Summary
There were two primary findings of import from this research. The first is that the program appears to be doing a good job of serving all customer segments. SBEA participation is a very good representation of Connecticut businesses of this size (by kW usage). Therefore, there does not seem to be underserved business segments that need to be targeted and no change is recommended regarding a change of market target.
To target particular segments would move SBEA away from its equal level of service to the C&I customers. If greater savings or higher cost-effectiveness is desired and viewed as having greater value than providing services equally to the C&I customer segments, then targeting colleges/schools followed by entertainment/gym should aid these alternative goals as these sectors have the highest savings per participant and program dollar.
The second important finding from this independent third-party research is that SBEA participants appear to have on-average saved 24% off their prior demand usage. The SBEA program tracking data does not contain the participant’s usage. Matching the billing data to the program data allowed an estimate of the average percent of demand savings expected from the program tracking estimates and customer usage. Comparison of demand usage for the SBEA-eligible population to the SBEA participants over the 2007-2012 period generally supports the program estimates of savings since the difference between the two groups is close to that savings level.1
1 This also provides secondary support to the SBEA Impact Evaluation that found relatively high realization rates
There were a limited number of contractors who have worked on the program. The utilities have worked to develop these relationships and expand contractor reach in the program. Another potential avenue for increased participation is to increase the contractor participation base.
We have seen the analysis of contractor data by CL&P and the efforts to leverage detailed contractor knowledge to aid in obtaining more savings efficiently. Both program administrators (PAs) are working to expand their relationship with the SBEA contractors. We have no recommendation to change that.
Colleges/schools, followed by entertainment/gym had the greatest mean savings, and are good potential targets for the program to increase savings per participant or cost-effectiveness. The decision to target specific sectors for greater cost-effectiveness would reduce the close representativeness of the SBEA program seen in 2007-2012. The desire for greater cost-effectiveness may outweigh the desire to have the program exactly match its target population. Another alternative mentioned by the utilities during comments on the draft report is that colleges and schools may be better served by energy efficiency efforts other than SBEA.
Given the fact that 72 percent of projects were lighting only and that projects with measures in addition to lighting had much higher savings, increasing the percent of projects with additional measure categories appears to be one of the surest ways to increase program savings. But we know that the PAs have already been undertaking activities to obtain more savings from a broader number of measures in 2013 and 2014. We have no recommendation to change that. This research study did not involve any new data collection. However, it did involve analysis of existing data that, in our experience, PAs do not usually undertake on their own. We would recommend that future research and evaluation activities have an initial task that involves interviews with PAs to ensure that the research is valuable to the PAs. Undertaking research that relies on data already available to the utilities and being undertaken for outside parties to either have knowledge from this data, or as analysis from an independent third-party, should be carefully assessed for its need and be very explicit about what information from the utility data needs to be produced or assessed by an independent third-party.
I.
Introduction
Connecticut Light & Power and United Illuminating offer the Small Business Energy Advantage (SBEA) Program that provides an energy audit and incentives to small business owners to improve the energy efficiency of their buildings. The program provides direct installation of lighting upgrades and controls, air conditioning equipment tune-ups, and automated controls for refrigeration equipment.
The SBEA Data Mining Research aims to help program administrators make more informed decisions about how to garner deeper and more comprehensive energy savings by examining what has and has not been accomplished through the SBEA over the years. The research consisted of analysis of the SBEA program databases and the utility customer databases to characterize the program and the participants, and compare the population of eligible customers to those who have chosen to participate in the program.
This report provides the following information in four sections following this introduction. Section II – Methodology: Provides a summary of the data that were obtained and the analyses that were conducted.
Section III – Program Data Analysis: Provides data and information on the participating customers, contractors, measures, and projected savings from the program.
Section IV – Comparison to Eligible Population: Compares the full database of utility customers who are potentially eligible for the SBEA to the customers who participated and assesses whether there may be opportunities for targeted outreach to particular market segments.
Section V – Summary of Findings: Provides a summary of findings from the analysis and recommendations for potentially reaching a larger population of eligible customers.
APPRISE prepared this report under subcontract to DNV KEMA. The utilities facilitated this research by furnishing program and customer data to APPRISE. Any errors or omissions in this report are the responsibility of APPRISE. Further, the statements, findings, conclusions, and recommendations are solely those of analysts from APPRISE and do not necessarily reflect the views of the utilities.
II.
Methodology
This section describes the research objectives and the data that were utilized in the analyses.
A.
Research Objectives
The primary objective of this evaluation was to help program administrators make more informed decisions about how to garner deeper and more comprehensive energy savings through an examination of what has and has not been accomplished through the SBEA program over the years. The analysis focused on the following.
Assessed the representation of various market sectors among the SBEA participants over the last five years, which sectors were underrepresented and which were missing.
Determined how the market sector distribution of program participants compared to those of nonparticipants.
Characterized the mix of measures installed in the program, including an examination of the nature and frequency at which measures beyond lighting were installed.
Explored the levels of savings tracked by sector.
B.
Program Data
APPRISE requested a complete download of SBEA program data from CL&P and UI for projects that were undertaken between 2007 and 2012. The data included the following types of information.
Project Level Data
Project Identification
Key Program Participation Dates – Data availability varied by utility, but generally included the project create date, site visit date, approved project date, installation date, inspection date, and payment date
Payment Status Contractor Name
Financing Data – An indicator for whether financing was approved and accepted (UI only)
Building Data – Square footage Facility Type – Type of business
Cost Data – Customer cost, material cost, labor cost, electric incentive amount, gas incentive amount
Savings – Annual and lifetime kWh savings; annual, summer, and winter kW savings; annual and lifetime ccf savings
Measure Level Data
Project Identification
Measure Category - Cooling, Heating, Lighting, Custom, High-Performance Lighting, Refrigeration
Measure Life
Replaced Type and Size – Type and watts of replaced item
Cost Data – Customer cost, material cost, labor cost, incentive amount+
Savings – Annual and lifetime kWh savings; annual, summer, and winter kW savings; annual and lifetime ccf savings
C.
Customer Data
APPRISE requested customer data from CL&P and UI to merge with the program data and to provide analysis of customers who were eligible and who did and did not participate in the SBEA. The requested data included identification information, building data, business type data, and energy usage and demand. The following data were received.
Customer Identification Business Type
III.
Program Data Analysis
This section provides an analysis of the SBEA program data provided by CL&P and UI. The following types of analyses are presented.
Projects by Year Facility Type Building Type Usage and Demand Contractors
Measures Installed
Project Costs and Incentives Financing
Projected Savings
A.
Projects and Time Period Studied
This section provides an analysis of the number of projects by time period. Table III-1 shows that from 2007 through 2012, there were nearly 6,300 CL&P SBEA projects installed and nearly 2,000 UI SBEA projects installed. The peak year for the SBEA installations was 2010 for CL&P and 2009 for UI.
Table III-1
Number of Projects by Installation Year
CL&P UI Both Utilities
2007 109 20 129 2008 1,088 491 1,579 2009 773 549 1,322 2010 1,640 330 1,970 2011 1,443 303 1,746 2012 1,227 259 1,486 TOTAL 6,280 1,952 8,232
*Source: Project level data file.
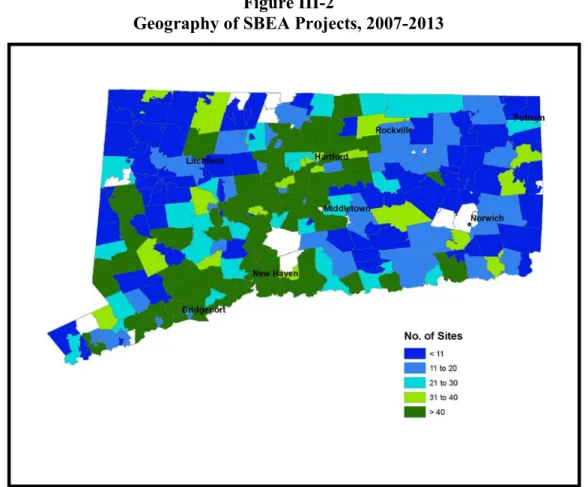
Figure III-1
Figure III-2 displays a map of the projects that were completed through the SBEA between 2007 and 2012.
Figure III-2
Table III-2 displays the earliest, mean, and latest project start date, signature date, installation date and end date. The table shows that CL&P projects in the database extract began as early as 2006 and ended through the end of 2012. UI projects began as early as 2005 and also ended by the end of 2012.
Table III-2 Project Level Dates
CL&P UI Both Utilities
Number of Projects 6,280 1,952 8,232
Missing Observations 3 186 189
Projects Included in Analysis 6,277 1,766 8,043
Start Date Min 2/6/2006 1/20/2005 1/20/2005 Mean 3/20/2010 11/20/2009 2/20/2010 Max 10/20/2012 9/20/2012 10/20/2012 Signature Date Min 2/20/2007 1/20/2007 1/20/2007 Mean 5/20/2010 1/20/2010 4/20/2010 Max 11/20/2012 11/20/2012 11/20/2012 Installation Date Min 1/20/2007 5/20/2007 1/20/2007 Mean 8/20/2010 2/20/2010 7/20/2010 Max 11/20/2012 12/20/2012 12/20/2012 End Date Min 1/20/2008 1/20/2008 1/20/2008 Mean 9/20/2010 3/20/2010 8/20/2010 Max 12/20/2012 12/20/2012 12/20/2012
*Source: Project level data file.
*Three cases from the UI data had start date after end and were excluded from the analysis. *One case from the CL&P data had signature date as 2/28/1980 and was excluded from the analysis.
*For the CL&P data, the latest of three variables, Pay Invoice Date, Process Invoice Date and Invoice Project Date, was chosen to populate End Date. In all but 18 cases, Pay Invoice Date was used.
Table III-3A displays data on the number of days from the start to the end of the project. The table shows that the mean number of days was 189 across both utilities. While 25 percent of projects were completed within about 3.5 months, 25 percent took almost eight months or more.
Table III-3A
Days from Start to End of Project
CL&P UI Both Utilities
Projects 6,280 1,952 8,232
Missing Observations 1 179 180
CL&P UI Both Utilities
Mean 202 141 189
25th Percentile 122 77 111
Median 175 120 164
75th Percentile 249 190 237
*Source: Project level data file.
Table III-3B displays the distribution of the project length. The table shows that approximately 30 percent of projects took less than four months, almost half took four to eight months, and about 25 percent took more than eight months. While CL&P projects were most likely to take four to eight months, UI projects were most likely to take less than four months.
Table III-3B
Range of Days from Start to End of Project
CL&P UI Both Utilities Number Percent Number Percent Number Percent
Projects 6,280 --- 1,952 --- 8,232 ---
Missing Observations 1 --- 179 --- 180 ---
Projects Included in Analysis 6,279 100.0% 1,773 100.0% 8,052 100.0%
<4 months 1,516 24.1% 882 49.8% 2,398 29.8%
4-<8 months 3,024 48.2% 689 38.9% 3,713 46.1%
8-<12 months 1,242 19.8% 151 8.5% 1,393 17.3%
1 year or more 497 7.9% 51 2.9% 548 6.8%
*Source: Project level data file.
Table III-3C displays the project length range by year for UI and CL&P. The table shows that the utilities appear to have been successful in reducing the time to completion. While 25 percent of projects took eight months to one year and 21 percent took one year or more to complete in 2007, 13 percent took eight months to one year and only two percent took one year or more in 2012. (There are also participant and project changes that could affect the change in these averages.)2
2 This is not a process evaluation of the SBEA program. We do not have information on why some projects took
longer than others. Some of the difference may be due to the type of project or the type of customer and their decision-making process. Differences between the utilities could be due to differences between types of projects, customer decision-making, the operation of the SBEA program at that utility, or other factors.
Table III-3C
Project Length by Year for Both Utilities
2007 2008 2009 2010 2011 2012 <4 months 10.7% 25.8% 37.6% 33.7% 21.9% 32.5% 4-<8 months 42.6% 41.0% 43.8% 41.5% 52.4% 52.5% 8-<12 months 25.4% 22.8% 14.2% 16.5% 18.8% 13.0% 1 year or more 21.3% 10.4% 4.4% 8.2% 6.9% 2.1% TOTAL 100.0% 100.0% 100.0% 100.0% 100.0% 100.0%
*Source: Project level data file.
B.
Types of Facilities and Businesses
This section provides information on the types of facilities and businesses that participated in the SBEA. Table III-4 shows that the most common facility types were offices, retail, auto-related, and restaurants, making up more than half of the projects. Other common types were manufacturing, colleges, and residential.
Table III-4 Facility Type
CL&P UI Both Utilities Number Percent Office 1,341 460 1,801 21.9% Retail 1,223 374 1,597 19.4% Auto-Related 616 171 787 9.6% Restaurant/Food Store 505 253 758 9.2% Manufacturing/Industrial/Workshop 492 163 655 8.0% College/School 354 73 427 5.2% Residential 273 151 424 5.2% Warehouse 157 115 272 3.3% Religious 199 55 254 3.1% Entertainment/Gym 175 52 227 2.8% Hospitals/Health 157 24 181 2.2% Government 163 2 165 2.0% Parking 148 17 165 2.0% Other 477 42 519 6.3% TOTAL 6,280 1,952 8,232 100.0%
*Source: Project level data file.
Office includes Medical Offices and Office. Retail includes Retail and Small Services. Restaurant/Food Store includes Bakery, Convenience Stores, Food Stores and Restaurant. College/School includes College-Cafeteria, College-Classes/Administrative, College-Dormitory, College-Other and School. Residential includes Lodging, Lodging (Hotels/Motels), Nursing Homes and Residential. Warehouse includes Refrigerated
Warehouse, Warehouse and Warehouse (Not Refrigerated). Entertainment/Gym includes Convention Center, Entertainment, Exercise Center, Gymnasium, Motion Picture Theatre, Museum, Performing Arts Theatre, Recreation and Sports Arena. Government includes Court House, Fire Station (unmanned), Library, Police/Fires Stations (24 hr), Post Office and Town Hall. Parking includes Parking and Parking Garages & Lots. *Other includes Banks, Financial Centers, Laundry/Laundromat, Mall Concourse, Marina, Miscellaneous, Non-Building, Penitentiary, Pump Stations, Transportation and Waste Water Treatment Plant.
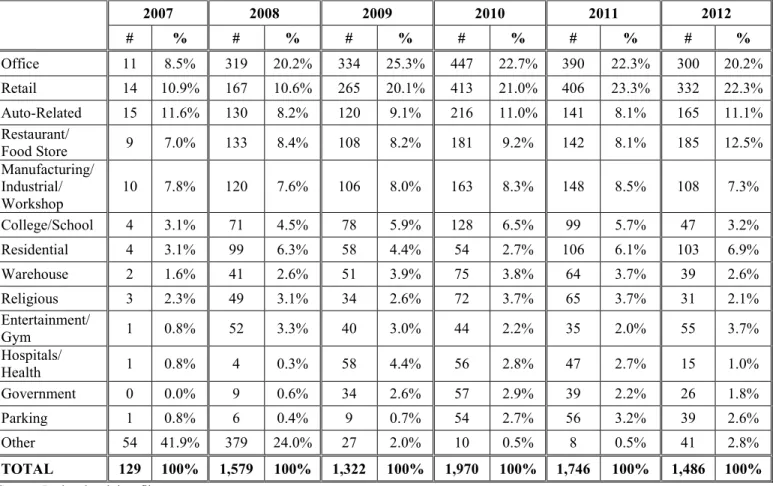
Table III-5 displays the facility type by installation year. For the most part, the distribution of facility type remained fairly constant from 2007 through 2012. However, the share of retail facilities increased from about ten percent to about 20 percent between 2008 and 2009, and then remained at the higher level.
Table III-5
Facility Type by Installation Year (Both Utilities)
2007 2008 2009 2010 2011 2012 # % # % # % # % # % # % Office 11 8.5% 319 20.2% 334 25.3% 447 22.7% 390 22.3% 300 20.2% Retail 14 10.9% 167 10.6% 265 20.1% 413 21.0% 406 23.3% 332 22.3% Auto-Related 15 11.6% 130 8.2% 120 9.1% 216 11.0% 141 8.1% 165 11.1% Restaurant/ Food Store 9 7.0% 133 8.4% 108 8.2% 181 9.2% 142 8.1% 185 12.5% Manufacturing/ Industrial/ Workshop 10 7.8% 120 7.6% 106 8.0% 163 8.3% 148 8.5% 108 7.3% College/School 4 3.1% 71 4.5% 78 5.9% 128 6.5% 99 5.7% 47 3.2% Residential 4 3.1% 99 6.3% 58 4.4% 54 2.7% 106 6.1% 103 6.9% Warehouse 2 1.6% 41 2.6% 51 3.9% 75 3.8% 64 3.7% 39 2.6% Religious 3 2.3% 49 3.1% 34 2.6% 72 3.7% 65 3.7% 31 2.1% Entertainment/ Gym 1 0.8% 52 3.3% 40 3.0% 44 2.2% 35 2.0% 55 3.7% Hospitals/ Health 1 0.8% 4 0.3% 58 4.4% 56 2.8% 47 2.7% 15 1.0% Government 0 0.0% 9 0.6% 34 2.6% 57 2.9% 39 2.2% 26 1.8% Parking 1 0.8% 6 0.4% 9 0.7% 54 2.7% 56 3.2% 39 2.6% Other 54 41.9% 379 24.0% 27 2.0% 10 0.5% 8 0.5% 41 2.8% TOTAL 129 100% 1,579 100% 1,322 100% 1,970 100% 1,746 100% 1,486 100%
*Source: Project level data file.
Table III-6 examines the project time range by facility type. The table shows that college/school projects were more likely to take eight months or more, longer than the other project types, perhaps due to greater levels of oversight that must provide approval in these types of organizations. Government projects were next most likely to take one year or more to complete.
Table III-6
Project Time Range by Facility Type for Both Utilities
<4 Months 4- <8 Months 8- <12 Months 1 Year Total
Office 31.2% 46.4% 14.9% 7.5% 100.0% Retail 40.3% 44.0% 12.5% 3.2% 100.0% Auto-Related 41.2% 40.7% 15.3% 2.8% 100.0% Restaurant/Food Store 21.5% 54.8% 18.5% 5.1% 100.0% Manufacturing/Industrial/Workshop 34.1% 49.1% 12.5% 4.2% 100.0% College/School 6.2% 41.9% 31.3% 20.7% 100.0% Residential 15.9% 53.6% 23.8% 6.7% 100.0% Warehouse 53.7% 37.8% 4.3% 4.3% 100.0% Religious 15.6% 54.0% 24.8% 5.6% 100.0% Entertainment/Gym 30.5% 40.3% 22.1% 7.1% 100.0% Hospitals/Health 27.1% 39.2% 21.0% 12.7% 100.0% Government 12.7% 43.0% 27.3% 17.0% 100.0% Parking 13.7% 54.0% 24.2% 8.1% 100.0% Other 18.0% 44.6% 25.2% 12.2% 100.0%
*Source: Project level data file.
C.
Building Characteristics
This section examines the building square footage of participating businesses. Table III-7A shows that the mean square footage of participating businesses was approximately 10,000 square feet and was larger for CL&P businesses than for UI businesses. Both utilities, however, had about half of their participating buildings under 4,000 square feet and about half above that (the median square footage). The largest buildings drove up the average square footage. While 60 CL&P customers and 3 UI customers had square footage over 100,000, 17 CL&P customers had square footage over 200,000 square feet.
Table III-7A Building Square Footage
CL&P UI Both Utilities
Projects 6,280 1,952 8,232
Missing Observations 788 0 788
Zero Value Observations 393 1,223 1,616
Outlier Observations† 12 42 54
Projects Included in Analysis 5,087 687 5,774
Mean 10,967 8,527 10,677
CL&P UI Both Utilities
Median 4,000 3,000 4,000
75th Percentile 10,000 8,333 10,000
*Source: Project level data file.
†12 observations in CL&P and 42 observations in UI had building square feet values under 100. These cases were excluded from this analysis.
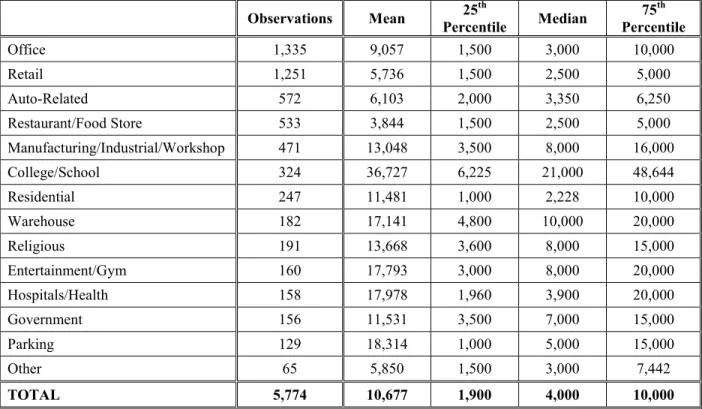
Table III-7B displays statistics on square footage by facility type. The table shows that college/schools were the largest buildings. Other large building types were warehouses, entertainment/gym, hospitals/health care, and parking. Restaurants and retail participants had the smallest facilities among SBEA participants.
Table III-7B
Building Square Footage by Facility Type for Both Utilities
Observations Mean Percentile 25th Median Percentile 75th
Office 1,335 9,057 1,500 3,000 10,000 Retail 1,251 5,736 1,500 2,500 5,000 Auto-Related 572 6,103 2,000 3,350 6,250 Restaurant/Food Store 533 3,844 1,500 2,500 5,000 Manufacturing/Industrial/Workshop 471 13,048 3,500 8,000 16,000 College/School 324 36,727 6,225 21,000 48,644 Residential 247 11,481 1,000 2,228 10,000 Warehouse 182 17,141 4,800 10,000 20,000 Religious 191 13,668 3,600 8,000 15,000 Entertainment/Gym 160 17,793 3,000 8,000 20,000 Hospitals/Health 158 17,978 1,960 3,900 20,000 Government 156 11,531 3,500 7,000 15,000 Parking 129 18,314 1,000 5,000 15,000 Other 65 5,850 1,500 3,000 7,442 TOTAL 5,774 10,677 1,900 4,000 10,000
*Source: Project level data file.
*12 observations in CL&P and 42 observations in UI had building square feet values under 100. These cases were excluded from this analysis.
The more the mean is above the median indicates a greater influence of the larger projects on the average size. There are a few cases where the mean is above the 75th percentile, indicating that those business types have a small number of very large
buildings that drive up the average size. This is the case for retail, residential, and parking type businesses.
D.
Usage and Demand
Usage and demand data were provided in the customer data file, but are analyzed in this section only for businesses that participated in the SBEA from 2005 through 2012. Data from the customer file were merged with data from the SBEA participant file to analyze
usage for participants. These data were obtained in 2014, and represent post-treatment usage for SBEA participants. Table III-8A shows that 32 percent of CL&P and 13 percent of UI participants did not merge with the customer file and therefore do not have usage data for analysis. While mean usage for CL&P customers was over 121,000 kWh annually, mean usage for UI customers was over 90,000 kWh annually.
Table III-8A Annual Usage (kWh)
CL&P UI Both Utilities
Observations 6,280 1,952 8,232
Missing Observations 1,984 259 2,243
Zero or Negative Value Observations 0 4 4
Projects Included in Analysis 4,296 1,689 5,985
Mean 121,121 90,469 112,471
25th Percentile 17,762 14,741 16,832
Median 42,519 34,649 40,400
75th Percentile 120,080 86,998 110,320
*Source: Customer data file.
Table III-8B displays the distribution of annual usage. The table shows that nearly one third of the participants had post participation annual usage of less than 20,000 kWh, and nearly one quarter had usage over 120,000 kWh.
Table III-8B
Annual Usage Distribution (kWh)
Annual Usage (kWh) CL&P UI Both Utilities
<20,000 28% 34% 30% 20,000 -<40,000 20% 20% 20% 40,000 - <60,000 12% 11% 11% 60,000 - <80,000 7% 9% 7% 80,000 – <100,000 5% 5% 5% 100,000 - 120,000 4% 3% 4% >120,000 25% 19% 23% TOTAL 100% 100% 100%
†Cases with negative and zero annual kWh usage were excluded from this analysis.
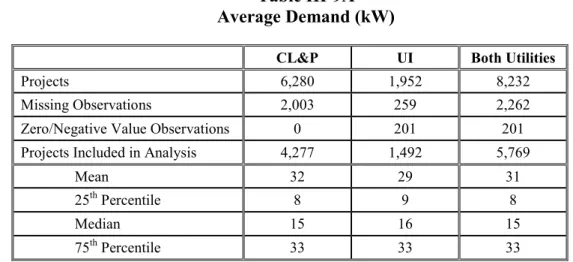
Table III-9A displays average kW demand over the one-year period from is November 1, 2011 through October 31, 2012 for SBEA participants. The table shows that mean average demand was 31 kW, but that 25 percent had average demand over 33 kW.
Table III-9A Average Demand (kW)
CL&P UI Both Utilities
Projects 6,280 1,952 8,232
Missing Observations 2,003 259 2,262
Zero/Negative Value Observations 0 201 201
Projects Included in Analysis 4,277 1,492 5,769
Mean 32 29 31
25th Percentile 8 9 8
Median 15 16 15
75th Percentile 33 33 33
*Source: Customer data file.
Table III-9B displays the distribution of average demand for SBEA participants. The table shows that one third of the participants had average demand of less than 10 kW, and 17 percent had average demand greater than 50 kW.
Table III-9B
Average Demand Distribution (kW)
Average Demand (kW) CL&P UI Both Utilities
0 0% 12% 3% 1-<10 34% 27% 32% 10 - <20 27% 26% 27% 20 - <30 12% 11% 12% 30 - <40 6% 6% 6% 40 - 50 4% 3% 3% > 50 17% 15% 17% TOTAL 100% 100% 100%
†Cases with negative average demand were excluded from this analysis.
Table III-10A displays the distribution of annual usage for the most common types of facilities that participated in the SBEA. The table shows that college/school, restaurants/food, and manufacturing were most likely to have annual usage over 100,000 kWh.
Table III-10A
Annual Usage Distribution (kWh) by Facility Type for Both Utilities
Office Retail Auto Restaurant/ Food Manufacturing College/ School Workshop
Obs 1,441 1,325 627 601 351 280 150 <20,000 41% 35% 40% 3% 18% 9% 33% 20,000 -<40,000 23% 22% 26% 10% 15% 11% 23% 40,000 - <60,000 11% 13% 9% 12% 11% 10% 14% 60,000 - <80,000 6% 8% 4% 12% 10% 8% 6% 80,000 – <100,000 4% 4% 3% 9% 6% 4% 3% 100,000 - <200,000 7% 10% 10% 23% 14% 14% 12% 200,000 - < 400,000 5% 5% 6% 18% 13% 18% 5% 400,000 4% 4% 2% 13% 13% 27% 5% TOTAL 100% 100% 100% 100% 100% 100% 100%
†Cases with negative and zero annual kWh usage were excluded from this analysis.
Table III-10B displays the distribution of annual usage per square foot for the most common types of facilities that participated in the SBEA. The table shows that energy usage intensity is less than 10 kWh per square foot of space for the majority of office, auto, manufacturing, colleges and schools, and workshops. Restaurant and food establishments are likely to have greater energy usage intensity, as 74 percent use more than 30 kWh per square foot of space.
Table III-10B
Annual Usage per Square Foot by Facility Type for Both Utilities
Annual Usage per
Square Foot (kWh) Office Retail Auto Restaurant/ Food Manufacturing College/ School Workshop
Obs 1,167 1,108 523 477 289 240 116 <10 58% 42% 61% 6% 56% 56% 69% 10 - <20 26% 23% 23% 9% 25% 24% 15% 20 - <30 7% 12% 6% 11% 5% 6% 5% 9% 23% 10% 74% 14% 14% 11% TOTAL 100% 100% 100% 100% 100% 100% 100%
†Cases with negative and zero annual kWh usage, building square foot values under 100, missing or zero square feet values were excluded from this analysis.
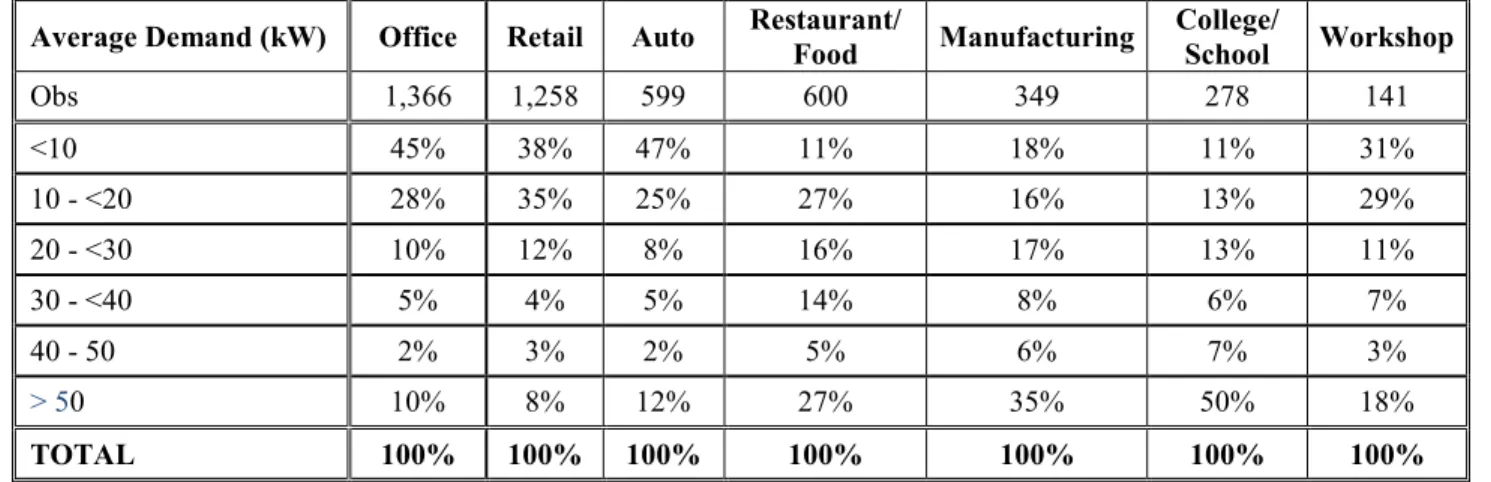
Table III-10C displays the distribution of average demand for the most common types of facilities that participated in the SBEA. The table shows that college/school, manufacturing, and restaurants/food were most likely to have average demand over 50 kW.
Table III-10C
Average Demand (kW) by Facility Type for Both Utilities
Average Demand (kW) Office Retail Auto Restaurant/ Food Manufacturing College/ School Workshop
Obs 1,366 1,258 599 600 349 278 141 <10 45% 38% 47% 11% 18% 11% 31% 10 - <20 28% 35% 25% 27% 16% 13% 29% 20 - <30 10% 12% 8% 16% 17% 13% 11% 30 - <40 5% 4% 5% 14% 8% 6% 7% 40 - 50 2% 3% 2% 5% 6% 7% 3% > 50 10% 8% 12% 27% 35% 50% 18% TOTAL 100% 100% 100% 100% 100% 100% 100%
†Cases with negative and zero annual kWh usage were excluded from this analysis.
Table III-10D displays the distribution of average demand per square foot for the most common types of facilities that participated in the SBEA. The table shows that most of the facility types had the majority with average demand per square foot of one to less than five kW. However, restaurant and food establishments were most likely to have average demand of more than 10 kW per square foot.
Table III-10D
Average Demand per Square Foot by Facility Type for Both Utilities
Average Demand (0.001kW) per Square
Foot Office Retail Auto
Restaurant/
Food Manufacturing College/ School Workshop
Obs 1,134 1,084 516 477 287 238 114 <1 13% 5% 5% 1% 11% 10% 11% 1 - <5 55% 46% 68% 12% 53% 63% 58% 5 - <10 23% 29% 16% 26% 23% 15% 18% 9% 20% 11% 62% 13% 13% 13% TOTAL 100% 100% 100% 100% 100% 100% 100%
†Cases with negative and zero average demand, building square foot values under 100, missing or zero square feet values were excluded from this analysis.
E.
Contractors
This section provides data on the contractors that provided services through the SBEA. Table III-11A shows that the top two contractors completed 25 percent of the SBEA jobs and the top six contractors completed more than half of the jobs. There were 42 contractors overall, and fifteen completed fewer than 20 jobs.
Table III-11A
Number of Jobs by Contractor
CL&P UI Both Utilities Number Percent Number Percent Number Percent Contractor 1 1,022 16.3% 78 4.1% 1,100 13.4% Contractor 2 584 9.3% 376 19.6% 960 11.7% Contractor 3 555 8.8% 73 3.8% 628 7.7% Contractor 4 494 7.9% 85 4.4% 579 7.1% Contractor 5 533 8.5% 31 1.6% 564 6.9% Contractor 6 312 5.0% 250 13.0% 562 6.9% Contractor 7 396 6.3% 107 5.6% 503 6.1% Contractor 8 0 0.0% 391 20.4% 391 4.8% Contractor 9 373 5.9% 0 0.0% 373 4.6% Contractor 10 311 5.0% 22 1.2% 333 4.1% Contractor 11 231 3.7% 36 1.9% 267 3.3% Contractor 12 231 3.7% 4 0.2% 235 2.9% Contractor 13 213 3.4% 0 0.0% 213 2.6% Contractor 14 208 3.3% 0 0.0% 208 2.5% Contractor 15 0 0.0% 182 9.5% 182 2.2% Contractor 16 172 2.7% 5 0.3% 177 2.2% Contractor 17 99 1.6% 60 3.1% 159 1.9% Contractor 18 152 2.4% 0 0.0% 152 1.9% Contractor 19 113 1.8% 0 0.0% 113 1.4% Contractor 20 72 1.2% 15 0.8% 87 1.1% Contractor 21 83 1.3% 0 0.0% 83 1.0% Contractor 22 0 0.0% 57 3.0% 57 0.7% Contractor 23 46 0.7% 0 0.0% 46 0.6% Contractor 24 0 0.0% 39 2.0% 39 0.5% Contractor 25 26 0.4% 4 0.2% 30 0.4% Contractor 26 0 0.0% 24 1.3% 24 0.3% Contractor 27 18 0.3% 0 0.0% 18 0.2% Contractor 28 0 0.0% 17 0.9% 17 0.2% Contractor 29 17 0.3% 0 0.0% 17 0.2% Contractor 30 0 0.0% 16 0.8% 16 0.2% Contractor 31 0 0.0% 13 0.7% 13 0.2% Contractor 32 12 0.2% 0 0.0% 12 0.2% Contractor 33 0 0.0% 12 0.6% 12 0.2% Contractor 34 0 0.0% 7 0.4% 7 0.1% Contractor 35 5 0.1% 0 0.0% 5 0.1%
CL&P UI Both Utilities Number Percent Number Percent Number Percent
Contractor 36 0 0.0% 5 0.3% 5 0.1% Contractor 37 0 0.0% 4 0.2% 4 0.1% Contractor 38 0 0.0% 4 0.2% 4 0.1% Contractor 39 2 <0.1% 1 0.1% 3 <0.1% Contractor 40 0 0.0% 1 0.1% 1 <0.1% Contractor 41 0 0.0% 1 0.1% 1 <0.1% TOTAL 6,280 100.0% 1,920 100.0% 8,200 100.0%
*Source: Project level data file
*32 UI cases which did not have contractor names were excluded from this analysis. Contractor 1 in Table III-11A is the same firm as Contractor 1 in Table III-11B.
Table III-11B displays the percentage of jobs completed by year and contractor for the 14 highest producing contractors with more than 200 jobs over the time period studied. While the two most productive contractors dropped off their production in 2012, some of the contractors began participating in 2010 or became more productive in 2011 and 2012.
Table III-11B
Percentage of Jobs by Year and by Contractor
2007 2008 2009 2010 2011 2012
Observations 129 1,579 1,322 1,970 1,717 1,483
Contractor 1
Number of Jobs 13 292 169 221 249 156
Percent of All Jobs That Year 10% 18% 13% 11% 15% 11%
Contractor 2
Number of Jobs 22 245 170 199 198 126
Percent of All Jobs That Year 17% 16% 13% 10% 12% 9%
Contractor 3
Number of Jobs 27 136 139 125 94 107
Percent of All Jobs That Year 21% 9% 11% 6% 5% 7%
Contractor 4
Number of Jobs 0 14 17 157 170 221
Percent of All Jobs That Year 0% 1% 1% 8% 10% 15%
Contractor 5
Number of Jobs 34 265 100 112 52 1
Percent of All Jobs That Year 26% 17% 8% 6% 3% <1%
Contractor 6
Number of Jobs 2 79 127 151 90 113
2007 2008 2009 2010 2011 2012 Contractor 7
Number of Jobs 3 114 57 78 126 125
Percent of All Jobs That Year 2% 7% 4% 4% 7% 8%
Contractor 8
Number of Jobs 3 131 113 62 41 41
Percent of All Jobs That Year 2% 8% 9% 3% 2% 3%
Contractor 9
Number of Jobs 5 73 65 93 88 49
Percent of All Jobs That Year 4% 5% 5% 5% 5% 3%
Contractor 10
Number of Jobs 5 45 67 116 64 36
Percent of All Jobs That Year 4% 3% 5% 6% 4% 2%
Contractor 11
Number of Jobs 8 43 64 80 40 32
Percent of All Jobs That Year 6% 3% 5% 4% 2% 2%
Contractor 12
Number of Jobs 0 0 0 85 69 81
Percent of All Jobs That Year 0% 0% 0% 4% 4% 5%
Contractor 13
Number of Jobs 0 0 0 59 97 57
Percent of All Jobs That Year 0% 0% 0% 3% 6% 4%
Contractor 14
Number of Jobs 0 0 3 73 67 65
Percent of All Jobs That Year 0% 0% <1% 4% 4% 4%
* Source: Project level data file
* 32 UI cases which did not have contractor names were excluded from this analysis. Contractor 1 in Table III-11A is the same firm as Contractor 1 in Table III-11B.
F.
Installed Measures
This section examines the measures that were installed through the SBEA. Table III-12A shows that while almost all projects installed lighting, 17 percent had refrigeration measures, 11 percent had custom measures, and three percent had cooling, heating, or hot water measures.
Table III-12A
Percent of Projects with At Least One Measure in Measure Category
CL&P UI Both Utilities
Observations 6,280 1,952 8,232
Lighting 99% 98% 99%
Refrigeration 17% 18% 17%
Custom 14% 1% 11%
Cooling/Heating/Domestic Hot Water 4% 1% 3%
*Source: Measure level data file.
Table III-12B displays the percent of projects with each measure type by year. The table shows that CL&P projects were less likely to have refrigeration measures in 2008 than in the other years. They had an increase in custom measures beginning in 2010. UI projects began to include custom measures in 2011 and increased in 2012. UI also expanded to cooling, heating, and hot water measures in 2012.
Table III-12B
Percent of Projects with At Least One Measure in Measure Category by Year 2007 2008 2009 2010 2011 2012 CL&P Observations 109 1,088 773 1,640 1,443 1,227 Lighting 97% 98% 98% 99% 99% 99% Refrigeration 23% 12% 21% 17% 17% 18% Custom 5% 5% 8% 17% 20% 16%
Cooling/Heating/Domestic Hot Water 2% 3% 2% 4% 5% 3%
UI
Observations 20 491 549 330 303 259
Lighting 100% 98% 98% 99% 97% 98%
Refrigeration 15% 20% 18% 19% 15% 19%
Custom 0% 0% 0% 0% 2% 6%
Cooling/Heating/Domestic Hot Water 0% <1% <1% 0% 0% 7%
CL&P & UI
Observations 129 1,579 1,322 1,970 1,746 1,486
Lighting 98% 98% 98% 99% 99% 99%
Refrigeration 22% 14% 20% 18% 17% 18%
Custom 4% 4% 4% 14% 17% 15%
Cooling/Heating/Domestic Hot Water 2% 2% 1% 3% 4% 4%
*Source: Measure level data file.
Table III-12 shows that while 72 percent of projects were lighting only, 16 percent had lighting and refrigeration measures installed, ten percent had lighting and custom measures
installed, and three percent had lighting and cooling, heating, or domestic hot water measures installed.
Table III-12C
Installed Measures Combinations
Lighting Only Lighting and Refrigeration Lighting and Custom Lighting and Cooling/Heating/ Domestic Hot Water Projects 6,185 1,354 880 221 Percent of Projects 72% 16% 10% 3%
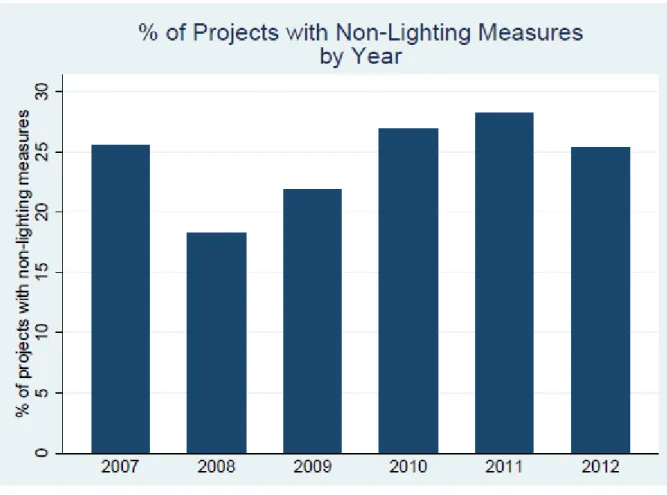
Figure III-3 displays the percent over time of SBEA projects that had measures other than lighting. The graph shows the gradual increase in projects with non-lighting measures from about 18 percent in 2008 to 28 percent in 2011.
Table III-12D displays the types of measures by facility type. As expected, restaurant/food stores were most likely to have refrigeration measures, followed by retail and entertainment/gym. Government and restaurant/food stores were most likely to have custom measures.
Table III-12D
Percent of Projects with At Least One Measure in Measure Category By Facility Type for Both Utilities
Observations Lighting Refrigeration Custom Domestic Hot Water Cooling/Heating/
Office 1,801 99% 6% 8% 4% Retail 1,597 98% 29% 13% 3% Auto-Related 787 99% 10% 7% 1% Restaurant/Food Store 758 96% 61% 24% 8% Manufacturing/Industrial/Workshop 655 99% 9% 7% 1% College/School 427 99% 13% 19% 1% Residential 424 99% 4% 3% 1% Warehouse 272 98% 6% 6% 1% Religious 254 99% 6% 9% 3% Entertainment/Gym 227 98% 21% 13% 5% Hospitals/Health 181 100% 14% 11% 6% Government 165 99% 12% 27% 5% Parking 165 100% 1% 15% 0% Other 519 98% 11% 4% 2% TOTAL 8,232 99% 17% 11% 3%
*Source: Measure level data file.
Figure III-4 displays the percent of projects with non-lighting measures by facility type. The graph clearly shows that restaurants and food stores were much more likely than the other facility types to install additional measures beyond lighting.
Figure III-4
G.
Project Costs and Incentives
This section examines the project costs and incentives. Table III-13 displays the mean project, material, and labor costs. Mean project costs were approximately $14,000.
Table III-13
Mean Project, Material, and Labor Cost
CL&P UI Both Utilities
Projects 6,280 1,952 8,232
Zero Value Observations 5 32 37
Projects Included in Analysis 6,275 1,920 8,195
Mean Project Cost $14,414 $12,231 $13,903
Mean Material Cost $9,221 $7,700 $8,865
Mean Labor Cost $5,193 $4,531 $5,038
*Source: Measure level data file.
Table III-14A displays the customer cost, incentive, total cost, and percent of project cost covered by the incentive. The table shows that the mean percent of the project cost covered by the incentive was 41 percent for CL&P jobs and 34 percent for UI jobs.
Table III-14A
Customer Cost, Incentive, and Total Project Cost
CL&P UI Both Utilities
Projects† 6,280 1,952 8,232
Zero Value Observations 0 3 3
Outliers 1 22 23
Projects Included in Analysis 6,279 1,927 8,206
Project Customer Cost Mean $8,965 $7,950 $8,726 25th Percentile $1,922 $1,673 $1,863 Median $4,130 $3,771 $4,046 75th Percentile $9,462 $8,797 $9,215 Project Incentive Mean $6,014 $4,272 $5,605 25th Percentile $1,193 $810 $1,096 Median $2,620 $1,747 $2,377 75th Percentile $6,123 $4,240 $5,689 Total Project Cost Mean $14,431 $12,222 $13,912 25th Percentile $3,030 $2,596 $2,901 Median $6,602 $5,558 $6,322 75th Percentile $15,182 $13,088 $14,625 Percentage of Project Cost Covered by Incentive Mean 41% 34% 39% 25th Percentile 35% 27% 32% Median 41% 32% 40% 75th Percentile 49% 40% 46%
*Source: The project level CL&P data file was used for all CL&P variables. The measure level UI data file was used to determine customer cost and total cost, while the project level UI data file was used to determine project incentive.
†One CL&P case was excluded from the statistics because the percentage of the Project Cost covered by the Incentive exceeded 100%. In this case the incentive covered 331% of the project cost. †22 UI cases were excluded from the statistics because the Customer Cost (calculated as Total Project Cost – Project Incentive) was negative.
Table III-14B displays the distribution of the percent of project costs covered by the incentive. The table shows that most projects had between 30 and 50 percent of the costs covered. While 17 percent had less than 30 percent of the project costs covered, 17 percent had more than 50 percent covered.
Table III-14B
Percent of Project Costs Covered by Incentive
Percent of Project Cost
Covered by Incentive CL&P UI Both Utilities
2% 5% 3% 21% - 30% 7% 36% 14% 31% - 40% 33% 40% 35% 41% - 50% 36% 16% 31% 51% – 60% 22% 3% 17% 61% – 80% <1% <1% <1% 81% – 100% <1% <1% <1% TOTAL 100% 100% 100%
†Cases with negative and zero annual kWh usage were excluded from this analysis.
Table III-14C displays the percent of the project cost covered by the incentive by year of installation. The table does not show a trend in the mean coverage rate, but that they have fluctuated over time, ranging from a low of 35 percent in 2009 to a high of 49 percent in 2007.
Table III-14C
Percent of Project Cost Covered by Incentive by Year 2007 2008 2009 2010 2011 2012 Projects 129 1,578 1,322 1,969 1,725 1,483 Mean 49% 42% 35% 44% 36% 36% 25th Percentile 49% 37% 30% 40% 30% 31% Median 50% 42% 32% 43% 35% 37% 75th Percentile 51% 50% 40% 51% 43% 39%
*Source: The project level CL&P data file was used for all CL&P variables. The measure level UI data file was used to determine customer cost and total cost, while the project level UI data file was used to determine project incentive. *One CL&P case was excluded because the percentage of the project cost covered by the incentive exceeded 100%.
Table III-14D displays the percent of the project cost covered by the program incentive by facility type. The lowest mean percent covered was 36 percent for residential facility types and the highest was 46 percent for “other”. Most of the facility types had mean coverage rates of 37 to 39 percent.
Table III-14D
Percent of Project Cost Covered by Incentive By Facility Type for Both Utilities
Observations Mean Percentile 25th Median Percentile 75th
Office 1,795 38% 32% 39% 43% Retail 1,593 39% 32% 40% 45% Auto-Related 786 39% 32% 40% 45% Restaurant/Food Store 753 42% 36% 41% 50% Manufacturing/Industrial /Workshop 653 38% 31% 38% 45% College/School 425 39% 32% 40% 43% Residential 421 36% 29% 37% 42% Warehouse 271 37% 30% 37% 42% Religious 253 37% 30% 39% 43% Entertainment/Gym 227 38% 31% 39% 43% Hospitals/Health 181 39% 32% 40% 44% Government 165 38% 31% 40% 43% Parking 165 38% 31% 40% 47% Other 518 46% 41% 48% 51% TOTAL 8,206 39% 32% 40% 46%
*Source: The project level CL&P data file was used for all CL&P variables. The measure level UI data file was used to determine customer cost and total cost, while the project level UI data file was used to determine project incentive. *One CL&P case was excluded because the percentage of the project cost exceeded 100%.
Table III-14E displays the percent of project cost covered by the combination of measures installed. The table shows that projects with custom measures had somewhat higher coverage rates.
Table III-14E
Percent of Project Cost Covered by Incentive By Measure Category
Lighting
Only Refrigeration Lighting and Lighting and Custom
Lighting and Cooling/Heating/ Domestic Hot Water Projects 6,185 1,354 880 221 Mean 39% 41% 43% 41% 25th Percentile 32% 35% 37% 34% Median 40% 41% 44% 43% 75th Percentile 43% 50% 50% 50%
*Source: The project level CL&P data file was used for all CL&P variables. The measure level UI data file was used to determine customer cost and total cost, while the project level UI data file was used to determine project incentive.
*One CL&P case was excluded from the statistics because the percentage of the Project Cost covered by the Incentive exceeded 100%. In this case the incentive covered 331% of the project cost, so an error in one of the numbers is very likely.
H.
Financing
CL&P provided data on whether financing was approved and whether it was accepted, and UI provided data on whether financing was used to support the project. Table III-15A shows that 93 percent of CL&P projects had financing approved and 88 percent accepted financing, while 95 percent of UI projects use financing.
Table III-15A Financing
CL&P UI Both Utilities Number Percent Number Percent Number Percent
Projects 6,280 --- 1,952 --- 8,232 ---
Missing Observations 2 --- 0 --- 2 ---
Projects Included in Analysis 6,278 100.0% 1,952 100.0% 8,230 100.0%
Finance Approved 5,823 92.8% --- --- --- ---
Finance Accepted 5,512 87.8% 1,856 95.1% 7,368 89.5%
*Source: Project level data file.
Table III-15B displays the approval and use of financing by facility type. The table shows that colleges and schools were least likely to use program financing. Government was also less likely to use financing than most of the other facility types.
Table III-15B
Financing by Facility Type
CL&P UI Both Utilities Obs. Financing Approved Financing Accepted Obs. Financing Accepted Obs. Financing Accepted
Office 1,341 93.1% 88.5% 460 95.9% 1,801 90.4% Retail 1,223 95.5% 92.2% 374 94.1% 1,597 92.7% Auto-Related 616 93.0% 90.4% 171 95.9% 787 91.6% Restaurant/Food Store 505 96.2% 91.9% 253 96.1% 758 93.3% Manufacturing/ Industrial/Workshop 491 87.6% 83.5% 163 96.3% 654 86.7% College/School 354 85.6% 64.7% 73 93.2% 427 69.6% Residential 273 93.4% 90.5% 151 90.7% 424 90.6% Warehouse 157 93.0% 92.4% 115 96.5% 272 94.1% Religious 199 97.5% 95.0% 55 90.9% 254 94.1% Entertainment/Gym 175 94.3% 88.0% 52 98.1% 227 90.3% Hospitals/Health 157 93.0% 89.2% 24 95.8% 181 90.1% Government 163 92.0% 80.4% 2 100.0% 165 80.6% Parking 148 93.9% 88.5% 17 94.1% 165 89.1% Other 476 88.2% 84.0% 42 97.6% 518 85.1% TOTAL 6,278 92.8% 87.8% 1,952 95.1% 8,230 89.5%
*Source: Project level data file and Measure level data file
*The variable determining whether finance was accepted for UI was contained in the measure level data file and for CL&P in the project level data file.
*Only cases with non-missing values for both “finance approved” (when available) and “finance accepted” were included in these statistics.
Figure III-5 displays the percent of projects that used financing by facility type. The chart clearly shows that colleges and schools are the outlier as the least likely facility type to make use of financing.
Figure III-5
I.
Tracked Savings
This section examines the tracked savings and demand reduction due to the SBEA. Table III-16A examines data availability and mean annual and lifetime savings. Mean annual savings were projected to be 21,416 kWh and mean lifetime savings were projected to be 260,111 kWh.
Table III-16A
Project Level Savings (kWh)
CL&P UI Both Utilities
Projects 6,280 1,952 8,232
Annual kWh Savings
Number Missing 0 1 1
Number Zero 0 1 1
Projects Included in Analysis 6,280 1,950 8,230
Mean Annual kWh Savings 22,197 18,899 21,416
Lifetime kWh Savings
CL&P UI Both Utilities
Number Zero 0 6 6
Projects Included in Analysis 6,280 1,944 8,224
Mean Lifetime kWh Savings 272,068 221,483 260,111
* Source: Project level data file except for UI Mean Lifetime kWh Savings, from the measure level data file.
Table III-16B examines mean and total annual savings by year. The table shows that mean savings over both utilities were highest in the earlier years of this analysis (2007 through 2009) and declined in 2010 to 2012.
Table III-16B
Project Level Annual Savings (kWh) by Year
CL&P UI Both Utilities
Mean Total Mean Total Mean Total
2007 21,717 2,367,182 25,773 515,460 22,346 2,882,642 2008 27,256 29,654,638 19,186 9,400,954 24,750 39,055,592 2009 29,786 23,024,233 13,889 7,624,994 23,184 30,649,227 2010 19,367 31,762,293 23,800 7,854,010 20,110 39,616,303 2011 20,855 30,093,139 17,630 5,324,273 20,297 35,417,412 2012 18,336 22,498,710 23,682 6,133,683 19,268 28,632,393 TOTAL 22,197 139,400,195 18,899 36,853,374 21,416 176,253,569
* Source: Project level data file except for UI Mean Lifetime kWh Savings, from the measure level data file. * 1 negative value for Annual kWh Savings in the UI data file was not included.
Table III-16C examines annual savings by facility type. College/schools had the greatest mean savings by far, followed by the entertainment/gym category. Office, auto-related, and religious facility types had lower savings.
Table III-16C
Project Level Annual Savings (kWh) By Facility Type
CL&P UI Both Utilities
Mean Total Mean Total Mean Total
Office 17,381 23,308,156 13,113 6,032,022 16,291 29,340,178
Retail 21,959 26,855,840 14,929 5,553,627 20,319 32,409,467
Auto-Related 15,938 9,817,718 15,164 2,592,988 15,770 12,410,706
Restaurant/ Food Store 26,883 13,575,839 21,586 5,461,294 25,115 19,037,133
CL&P UI Both Utilities College/ School 43,189 15,289,060 46,604 3,402,122 43,773 18,691,182 Residential 18,743 5,116,753 17,581 2,654,765 18,329 7,771,518 Warehouse 22,248 3,492,971 23,539 2,706,966 22,794 6,199,937 Religious 14,226 2,830,969 18,386 1,011,250 15,127 3,842,219 Entertainment/Gym 28,597 5,004,508 44,293 2,303,226 32,193 7,307,734 Hospitals/ Health 28,552 4,482,740 16,542 397,008 26,960 4,879,748 Government 21,156 3,448,369 5,990 11,980 20,972 3,460,349 Parking 28,878 4,273,884 30,460 517,824 29,041 4,791,708 Other 20,947 9,991,873 13,971 586,792 20,383 10,578,665 TOTAL 22,197 139,400,195 18,899 36,853,374 21,416 176,253,569
*Source: Project level data file except for UI Mean Lifetime kWh Savings, which came from the measure level data file. *1 negative value for Annual kWh Savings in the UI data file was not included
Table III-16D displays project level annual savings per square foot by facility type. While the previous table shows that colleges/schools followed by entertainment/gym had the highest savings, the table below shows that these types of facilities had lower than average savings per square foot. The higher savings for these facilities are related to their larger facility size. The table shows that restaurant/food stores, parking, and retail establishments had the greatest savings per square foot.
Table III-16D
Project Level Annual Savings (kWh) per Square Foot By Facility Type
CL&P UI Both Utilities
Mean Total Mean Total Mean Total
Office 3.2 3,738 3.4 538 3.2 4,276
Retail 6.3 7,042 5.0 643 6.1 7,685
Auto-Related 3.8 1,946 5.5 298 3.9 2,244
Restaurant/ Food Store 8.7 3,755 9.6 984 8.9 4,739
Manufacturing/ Industrial /Workshop 2.5 1,031 4.9 268 2.8 1,299
College/ School 3.0 857 3.2 115 3.0 973 Residential 3.7 727 5.2 264 4.0 991 Warehouse 1.9 287 3.0 101 2.1 389 Religious 2.0 326 2.9 73 2.1 399 Entertainment/Gym 4.2 603 4.8 73 4.2 676 Hospitals/ Health 3.4 510 4.6 28 3.4 538 Government 5.3 819 0.2 <1 5.3 819 Parking 7.8 947 13.4 94 8.1 1,041
CL&P UI Both Utilities
Other 3.6 188 4.1 53 3.7 242
TOTAL 4.5 22,779 5.1 3,533 4.6 26,311
*Source: Project level data file
*Cases with negative Annual kWh Savings and square foot under 100 (including 0) or missing were not included
Figure III-4 shows the cost per kWh saved by year. While the cost was somewhat higher in the more recent program years, the cost only ranged from about $0.60 in 2007 to $0.95 in 2011.
Figure III-6
Table III-16E examines annual savings by measure categories. Projects with other measures in additional to lighting had much higher savings.
Table III-16E
Project Level Annual kWh Savings By Measure Category
Lighting
Only Refrigeration Lighting and Lighting and Custom
Lighting and Cooling/Heating/ Domestic Hot Water Projects 6,208 1,354 880 221 Mean 16,071 40,406 43,515 40,723 25th Percentile 3,676 12,336 11,550 8,205 Median 7,444 24,482 24,874 18,151 75th Percentile 16,531 48,385 52,872 60,522
Table III-17A displays peak savings and gross annual kW savings. The table shows that mean peak savings for UI were 4 kW. Mean annual kW savings were estimated to be 5.7.
Table III-17A
Project Level Peak and Annual Average kW Savings
Peak kW Savings Annual Average kW Savings UI CL&P UI Both Utilities
Projects 1,952 6,280 1,952 8,232
Number Negative or Outlier† 5 22 1 23
Number Zero 76 244 1 245
Projects Included In Analysis 1,871 6,014 1,950 7,964
Mean Savings 4.0 5.6 6.0 5.7
*Source: Project level data file
†6 values greater than 900 kW in the CL&P data file for annual kW savings were defined as outliers.
Table III-17B shows that the peak savings were higher in 2007 and lower in 2009, but averaged around 4 to 5 kW in the other program years. Mean annual average kW savings ranged from 5 to 7 kW over the years included in the analysis.
Table III-17B
Project Level Peak and Annual Average kW Savings by Year
UI Mean Peak Savings (kW)
Annual Average kW Savings
CL&P UI Both Utilities
Mean Total Mean Total Mean Total
2007 6.8 5.9 646 8.0 161 6.3 807
UI Mean Peak Savings (kW)
Annual Average kW Savings
CL&P UI Both Utilities
2009 2.8 7.5 5,739 4.4 2,434 6.2 8,173
2010 5.0 4.7 7,322 6.9 2,278 5.1 9,600
2011 4.1 4.7 6,164 6.2 1,885 5.0 8,049
2012 4.3 4.4 5,308 7.6 1,965 5.0 7,273
TOTAL 4.0 5.6 33,792 6.0 11,743 5.7 45,535
*Source: Project level data file
*Peak savings was only available for UI. *5 negative values for peak kW savings were not included.
*1 negative value in the UI data file and 16 negative values in the CL&P data file for annual kW savings were not included. * 6 values greater than 900 kW in the CL&P data file for annual kW savings were not included.
Table III-17C displays peak and annual kW savings by facility type. The table shows that colleges/schools, followed by entertainment/gym had the highest mean peak savings and college/school had the highest mean annual kW savings.
Table III-17C
Project Level Annual Average kW Savings By Facility Type
Facility Type UI Mean Peak Savings (kW)
Annual Average kW Savings
CL&P UI Both Utilities Mean Total Mean Total Mean Total
Office 3.5 4.8 6,337 5.1 2,362 4.9 8,699 Retail 3.1 4.1 4,970 4.5 1,692 4.2 6,662 Auto-Related 2.1 4.1 2,490 4.6 785 4.2 3,275 Restaurant/Food Store 3.1 4.2 2,104 5.3 1,330 4.6 3,434 Manufacturing/Industrial/Workshop 5.4 7.0 3,414 7.8 1,279 7.2 4,693 College/School 10.6 13.6 4,095 15.1 1,101 13.9 5,196 Residential 3.1 3.8 928 4.5 674 4.1 1,603 Warehouse 6.0 7.0 1,089 8.2 940 7.5 2,028 Religious 6.3 7.5 1,455 10.6 584 8.2 2,038 Entertainment/Gym 7.9 7.6 1,271 10.9 569 8.4 1,840 Hospitals/Health 3.8 6.7 1,031 5.2 125 6.5 1,156 Government 4.1 5.9 917 5.4 11 5.9 927 Parking 0.6 7.4 516 7.6 130 7.4 645 Other 2.4 6.7 3,176 3.9 163 6.5 3,339 TOTAL 4.0 5.6 33,792 6.0 11,743 5.7 45,535
*Source: Project level data file
*Peak savings were only available for UI. *5 negative values for peak kW savings were set to missing in the UI data file. *1 negative value in the UI data file and 16 negative values in the CL&P data file for annual kW savings were set to missing. * 6 values greater than 900 kW in the CL&P data file for annual kW savings were not included.